I. INTRODUCTION
Interest in using quantum dots (QDs)-encoded nano-/microparticles instead of organic fluorophore counterparts as optical probes is increasing, owing to significant advantages in terms of detection sensitivity, throughput, and photostability.Reference Yang, Sena and Gao1 Since the QDs-loaded particle was first reported in 2000,Reference Rogach, Susha, Caruso, Sukhorukov, Kornowski, Kershaw, Möhwald, Eychmüller and Weller2, Reference Rogach, Nagesha, Ostrander, Giersig and Kotov3 investigations into fabrication methodsReference Gao and Nie4–Reference Joumaa, Lansalot, Théretz, Elaissari, Sukhanova, Artemyev, Nabiev and Cohen7 and characteristicsReference Li, Liu, Pickett, Skabara, Cummins, Ryley, Sutherland and O’Brien8–Reference Pan, Lu, Wu and Gai10 of QDs-encoded particles have followed, leading to the development of QDs-tagged particle technology as an intense research subject during the last decade. Microspheres bar-coded by six colors of QDs with 10 intensity levels have been demonstrated as a feasible tool for multiplexed DNA screening.Reference Han, Gao, Su and Nie11 QDs-tagged microspheres associated with bioconjugates can be treated as bioprobes for cellular quantificationReference Buranda, Wu and Sklar12, Reference Wu, Campos, Lopez, Ozbun, Sklar and Buranda13 and/or molecular detection.Reference Xiang, Zhang, Jiang, Chai and Yuan14, Reference Sun, Yu, Sun, Wang, Xu, Dixon, Wang, Li, Yang and Xu15 Recently, they were further used as a tracer for cancer diagnostics,Reference Sukhanova and Nabiev16–Reference Di Corato, Bigall, Ragusa, Dorfs, Genovese, Marotta, Manna and Pellegrino18 exhibiting tremendous potential in a wide spectrum of biomedical applications.
So far, there are three major approaches for the fabrication of QDs-encoded polymeric microspheres: (i) diffusion of QDs into swelled/porous microspheres, (ii) incorporation of QDs with microspheres during bead polymerization, and (iii) direct coating of particle surfaces with QDs. The former two approaches have significant advantages such as good size controllability, robust incorporation, and strong luminescent intensity.Reference Yang, Sena and Gao1 However, deficiencies such as cumbersome procedures and difficulty of phase transportation between QDs and polymeric microspheresReference Joumaa, Lansalot, Théretz, Elaissari, Sukhanova, Artemyev, Nabiev and Cohen7 severely hamper their utilization in practice. The third method entails immobilization of QDs on the surfaces of microparticles by either covalent bondsReference Chan, Zimmer, Stroh, Steckel, Jain and Bawendi19, Reference Graf, Dembski, Hofmann and Ruhl20 or electrostatic interactions in which charged QDs are adsorbed on a surface precoated with oppositely charged polyelectrolytes; it entails, in other words, a form of self-assembly. In comparison to other methods, this self-assembly approach provides a facile and effective protocol without elaborate chemical reactions, thus enabling it to precisely control the radial distribution of QDs as well as the size and topology of the microspheres.Reference Yang, Sena and Gao1
Several issues needed to be addressed before the development of self-assembly-based QDs-encoded microparticles could proceed. First, most QDs-tagged microspheres are optically functionalized by differentiating the luminescence levels of multiple colors of QDs within a microparticle. Previously, this has been achieved by phase-mediated diffusionReference Han, Gao, Su and Nie11, Reference Kuang, Wang, Bao, Gao, Möhwald and Jiang21 in which QDs are transported into porous beads over adequate solvent. Because QDs and microparticles share the same nature in terms of hydrophobicity or hydrophilicity, the number of QDs incorporated within the microparticles through this process can be precisely controlled. However, this strategy will likely not be applicable to the self-assembly approach since all the elements interact in the same phase throughout the procedures. In addition, the association between QDs and a particle surface may be interrupted due to particle collisions and/or fluid shear stress, leading to defunctionalization when used in hydrodynamic environments in vitro and/or in vivo. Therefore, it is preferable to have QDs-doped microparticles with controllable QD amounts and determined robustness for QD adsorption prepared by self-assembly. To the best of our knowledge, few studies have referred to the above issues in any analysis of self-assembly-based QDs-doped microspheres.
In this paper, we attempt to evaluate the capacity of a micrometer-sized particle for QDs adsorption and examine the stability of QDs-doped microspheres under the impact of mechanical stresses. To those ends, high luminescent CdSe/ZnS QDs-doped polystyrene (PS) microspheres prepared by self-assembly are presented and investigated.
II. EXPERIMENTAL
A. Materials
Polyethyleneimine (PEI; M w= 25 kDa), mercaptoacetic acid (MAA), and chloroform were purchased from Sigma-Aldrich (St. Louis, MO). Phosphate buffer saline (PBS; pH = 7.4) was purchased from Life Technologies (Carlsbad, CA). All chemicals were used as received. CdSe/ZnS core–shell QDs (diameter = 3.4 nm; emission wave length = 565 nm) stabilized with tri-n-octylphosphine oxide (TOPO) and hexadecylamine (HDA) were purchased from Nanoco Group PLC (Manchester, U.K.). PS microbeads (diameter = 10 μm) functionalized with carboxylic acid groups were obtained from Polysciences Inc. (Warrington, PA). The pH value of all the solutions was adjusted by the addition of HCl or NaOH at specific temperatures.
B. Synthesis of hydrophilic CdSe/ZnS nanoparticles
TOPO-/HDA-stabilized CdSe/ZnS QDs were water solubilized by using a MAA-mediated ligand exchange reaction as reported previously.Reference Chan and Nie22 The colloidal CdSe/ZnS nanoparticles were first dissolved in chloroform (0.2% w/v). The MAA (1.0 M) was then slowly added into the solution containing chloroform and QDs until the solution became obscure. After 2 h of reaction, PBS solution (pH = 10) was added to the reaction mixture (volume ratio = 1:1), and the combination was then vortexed vigorously. The organic and aqueous phases separated spontaneously. The aqueous phase containing MAA-capped QDs was aspirated carefully and centrifuged at 14,000 rpm for 10 min. The collected MAA-capped QDs were dispersed in 200 μL borate buffer (pH = 9.0) and stored at 4 °C for further use. The concentration of MAA-capped QDs was estimated using a ultraviolet (UV)–Vis spectroscope and calculated as 8 μM according to Beer–Lambert’s law.Reference Yu, Qu, Guo and Peng23
C. Fabrication of CdSe/ZnS QDs-doped PS microspheres
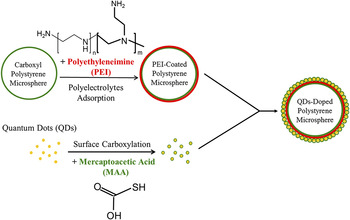
The CdSe/ZnS QDs-doped PS microspheres were fabricated using a self-assembly approach as diagrammed in Fig. 1. First, PEI was dissolved in PBS solution (10 mg/mL) and purged by filtration using a 0.45-μm filter. 1.5 × 10⁶ carboxyl PS microspheres were added to 600 μL of PEI solution and gently stirred at room temperature for up to 2 h. The zeta potential (ζ-potential) of PEI-encapsulated PS microspheres was monitored every 30 min using a SZ-100 Nanoparticle Analyzer (Horiba Co., Ltd., Santa Clara, CA) throughout the PEI coating process. The PEI-encapsulated PS microspheres were then washed twice with PBS solution and resuspended in 15 μL of deionized water (pH = 6.0). To synthesize QDs-doped PS microspheres, 5 μL of PEI-encapsulated PS microspheres (5 × 10⁵ particles) were mixed with specific amounts of carboxyl CdSe/ZnS nanoparticles in NaCl solution (130 mM). In this study, three different amounts (4, 8, and 16 pmoles) of carboxyl CdSe/ZnS nanoparticles were applied, and the total reaction volume of 50 μL was adjusted using NaCl solution. The mixtures were slightly vortexed and stored in the dark at room temperature for 2 h. Excess QDs were collected by centrifugation at 5,000 g for 5 min. The precipitated QDs-doped PS microspheres were resuspended in 50 μL of deionized water (pH = 9.0) and stored at 4 °C for further use.
Schematic diagram illustrating the fabrication procedures for CdSe/ZnS QDs-doped PS microspheres.

D. Characterization of CdSe/ZnS QDs-doped PS microspheres
The absorption spectrum of nonadsorbed carboxyl CdSe/ZnS QDs in NaCl solution was detected using a SYNERGY 2 Multi-Mode Microplate Reader (BioTek Instruments, Inc., Winooski, VT) as described above. The photoluminescence (PL) spectra of carboxyl QDs and QDs-doped PS microspheres in aqueous solution were detected using a FP-6500 fluorescence spectrophotometer (JASCO, Inc., Easton, MD) with settings of 1 nm wave length interval and 1 s integration time. The fluorescent intensities of QDs-doped PS microspheres prepared by different QD amounts were quantitatively measured using the FP-6500 fluorescence spectrophotometer and presented by relative fluorescence units (RFUs). All the samples were equalized with 5 × 10⁵ microparticles/mL in separated cuvettes for the detection of fluorescence spectrophotometry that was performed with excitation wave length of 480 nm and emission wave length of 565 nm.
The fluorescent expression and imaging of QDs-doped PS microspheres were observed using an inverted epifluorescence microscope (Olympus IX71, Olympus America Inc., Center Valley, PA) adapted to a CCD camera (Photometrics Cascade 512B, Photometrics, Tucson, AZ). The size and morphology of the QDs-tagged microparticles were determined via scanning electron microscopy (SEM; Philips XL-30 FEG, Royal Philips Electronics, Amsterdam, Netherlands) at an accelerating voltage of 20 kV. The specimen for SEM was prepared by drying the sample solution on a glass slide and sputtering a thin carbon film on the sample surface to prevent charging. A transmission electron microscope (TEM; Philips CM200) was used to observe the distribution and/or existence of QDs on the surface of a PS microsphere. Each TEM specimen was prepared by placing a drop of diluted sample with 95% ethanol on a copper grid (300 mesh) and then heating the sample at 70 °C overnight to completely evaporate the solvent. Detailed procedures followed the equipment manual provided by the manufacturer.
E. Stability of QDs-doped PS microspheres
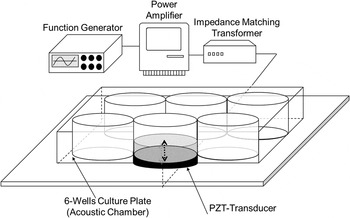
The rigidity of electrostatic interactions between carboxyl CdSe/ZnS QDs and amine PS matrices was examined by exposing the QDs-doped microspheres to an ultrasound field with cavitation and quantitatively analyzing the differences in fluorescent intensity emitted from the microparticles before and after ultrasound exposure. The complete experimental setup is illustrated in Fig. 2. The piezoelectric (PZT) transducer was made of a lead zirconate titanate disk with 50 mm diameter and 2 mm thickness (Ceramic Transducer Design Co., Ltd., Taiwan, Republic of China). The oscillation signal was generated from a function generator (FG708S DDS; Motech Industries Inc., Taiwan, Republic of China) and transferred through an amplifier (Model 7500; Krohn-Hite Corp., Brockton, MA) and an impedance matching transformer (Model MT-56; Krohn-Hite Corp.). The acoustic chamber was one well of a six-well culture plate with 1.0 mm bottom thickness. The transducer surface was smeared with glycerol as the coupling agent before use. After 1.5 × 10⁶ QDs-doped PS microspheres were transferred into one well of a six-well culture plate containing 3.0 mL of deionized water (pH = 6.0), the filled well was placed on the PZT transducer. The transmitted sound waves penetrated through the bottom of the well and formed ultrasound-induced cavitation inside the chamber. The ultrasound exposure was performed using 1 MHz sinusoidal waves with 100% duty cycle and 5 W/cm2 output energy for 15 min. All the samples were analyzed using both fluorescent microscopy and fluorospectrometry that was performed with excitation wave length of 480 nm and emission wave length of 565 nm before and after ultrasound treatment.
Schematic diagram of acoustic setup. The lead zirconate titanate PZT transducer, bonded to a plastic platform, was connected to an impedance matching transformer that was serially connected with an amplifier and a function generator. After the QDs-doped PS microspheres were transferred into one well of a six-well culture plate containing deionized water, the filled well was placed on the PZT transducer. The transmitted sound waves penetrated through the bottom of the well and formed ultrasound-induced cavitation inside the chamber. The dot arrow represents the direction of wave propagation.

F. Statistical analysis
All the experimental data were acquired in triplicate experiments and presented as mean ± standard deviation. Statistical comparisons were performed using analysis of variance at a significance level of P < 0.05 based on Student’s t test.
III. RESULTS AND DISCUSSION
The fabrication procedures of the CdSe/ZnS QDs-doped PS microspheres, including (i) the surface modification of QDs, (ii) the deposition of cationic polyelectrolytes on the surfaces of PS microspheres, and (iii) the incorporation of carboxyl QDs with polycationic PS microspheres, were based on the self-assembly approach as shown in Fig. 1. The electrical property of the product after each step was detected by ζ-potential measurement (Fig. S1). TOPO-/HDA-stabilized CdSe/ZnS QDs were first water solubilized by thiol exchange reaction using MAA and exhibited ζ = −59.2 ± 1.9 mV after modification. The expression of negative charge resulted from the presence of carboxyl groups on the surface, indicating that the MAA bonded with sulfur atoms of the QDs and offered hydrophilicity to the nanoparticles.
To electrostatically integrate with negatively charged QDs, the seed for QD adsorption should be positively charged before incorporation. In this study, we used carboxyl PS microspheres, instead of neutral microparticles, as the core for subsequent deposition of cationic PEI. The amine groups of PEI molecules can bind with the carboxyl groups of PS microspheres through electrostatic interactions, yielding a solid PEI-coated seed. The ζ-potential of the PEI-encapsulated PS microspheres was detected every 30 min throughout the coating process to achieve the highest positive charge magnitude on the surfaces of the microparticles. As presented in the Fig. S2, we found that the ζ-potential of the PEI-coated microparticles dramatically increased from −56.5 ± 1.28 to 8.3 ± 56 mV after 30 min and reached a maximum potential of ζ = 10.8 ± 2.5 mV at 60 min. With confirmed electrical properties for the MAA-capped CdSe/ZnS QDs and PEI-coated PS microspheres, carboxyl QDs with 16 pmoles were then added into a solution of polycationic PS microspheres in the presence of NaCl for integration. After interaction for 2 h, the PS microspheres exhibited ζ = −113.4 ± 4.9 mV (Fig. S1), indicating that the microparticles’ surfaces were covered with sufficient QD nanoparticles.
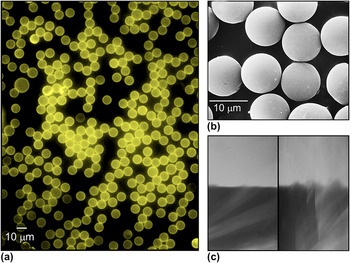
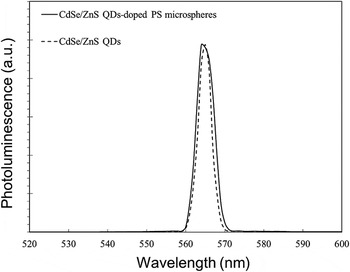
The optical properties and morphology of the QDs-doped PS microspheres were assessed using microscopic technology. As shown in Fig. 3(a), all the PS microspheres were fully covered with QDs on their surfaces and clearly displayed yellow luminance under fluorescent microscopy. The SEM image [Fig. 3(b)] showed that all the QDs-doped PS microspheres remained intact spheroids without deformation caused by centrifugation and/or stirring and exhibited a mean diameter of 10 ± 0.7 μm. It was extremely difficult to image the 10-μm QDs-coated PS microparticles by TEM due to electronic charging of the particles in the electron microscope.Reference Gómez, Pastoriza-Santos and Mulvaney24 Therefore, the TEM was performed on the edge of a microparticle instead of over the whole subject. As illustrated in Fig. 3(c), the QDs-doped PS microsphere surface is wavelike and rough (right) in comparison to the original PS matrix without QDs (left). Figure 4 presents the PL spectra of carboxyl CdSe/ZnS nanoparticles and QDs-doped PS microspheres detected in aqueous media. The QDs-doped microspheres exhibited a symmetrical PL spectrum curve similar to that obtained from the homogeneously dispersed QD nanoparticles, showing that QDs aggregation on the surfaces of the PS microparticles scarcely occurred.Reference Li, Liu, Pickett, Skabara, Cummins, Ryley, Sutherland and O’Brien8, Reference Mattoussi, Cumming, Murray, Bawendi and Ober25 The peak width and full width at half maximum of the QDs-doped PS microspheres were marginally greater than those obtained from isolated QDs. This increase in PL peak width likely occurred as a result of the interactions between QDs on the surfaces of the microspheres as reported previously.Reference Mattoussi, Cumming, Murray, Bawendi and Ober25 In addition, a minor shift for the PL peak maximum of QDs-doped PS microspheres as compared with that of isolated QDs was observed. This shift was reasoned to be due to an increase in the refractive index of the surrounding matrix of QDsReference Schmitt, Mächtle, Eck, Möhwald and Helm26 rather than to the influence of surface deposition, which is consistent with a previous study.Reference Li, Liu, Pickett, Skabara, Cummins, Ryley, Sutherland and O’Brien8
Images of QDs-doped PS microspheres obtained by (a) fluorescent microscopy, (b) SEM, and (c) TEM. In the TEM image, the left panel presents the edge of a carboxyl PS microsphere and the right panel presents the edge of a QDs-doped PS microsphere.

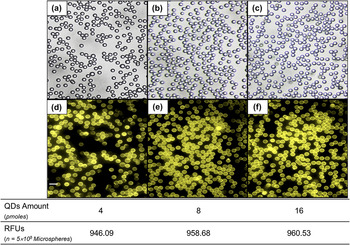
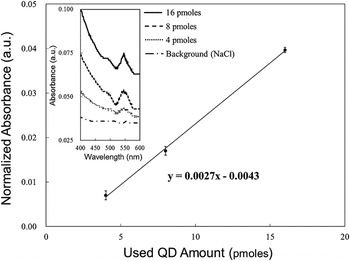
To evaluate the capacity of PS microspheres for QDs adsorption, we used 4, 8, and 16 pmoles of carboxyl CdSe/ZnS QDs and incorporated each of those amounts with 5 × 10⁵ PEI-coated PS microspheres in parallel, after which we detected the fluorescence of QDs-doped PS microspheres and the concentrations of nonadsorbed QDs for each group. As shown in Fig. 5, all the microspheres maintained complete QDs coverage, as is evident in both the bright-field images [Figs. 5(a)–5(c)] and those under fluorescent microscopy [Figs. 5(d)–5(f)] for each group. In addition, the fluorescent intensities of QDs-doped PS microspheres in the three groups were quantitatively measured using fluorospectrometry under equal 5 × 10⁵ microparticle numbers. The intensitiesexhibited by the 4, 8, and 16 pmole groups were 946.09 ± 23.51, 958.68 ± 32.95, and 960.53 ± 27.94 RFUs, respectively (Fig. 5). We also made between-group comparisons of the RFU values and obtained P = 0.622, 0.944, and 0.532, respectively, for the 4 versus 8 pmoles, 8 versus 16 pmoles, and 4 versus 16 pmoles comparisons. The difference in fluorescence expression among the three groups was insignificant. This finding indicates that the number of QDs adsorbed on each microsphere was similar even though the largest amount of QDs used was four times higher than the smallest amount. The absorption spectra of nonadsorbed QDs remaining from the 4, 8, and 16 pmole amounts used were detected to estimate the number of QDs per PS microsphere. As shown in Fig. 6 (inset), a characteristic exciton absorption peak at 545 nm wave length was observed for all three groups. The absorbance values obtained at 545 nm wave length were normalized by the background signal (i.e., absorbance for NaCl solution at 545 nm wave length) and linearized with the used QD amounts as plotted in Fig. 6. The normalized absorbance diminished from 0.04 to 0.007 as the used QD amount decreased from 16 to 4 pmoles, showing an 82.5% reduction of the concentration for nonadsorbed QDs based on Beer–Lambert’s Law. Moreover, through extrapolation analysis, we found that a minimum of approximately 1.6 pmoles of carboxyl CdSe/ZnS QDs can entirely cover the surfaces of 5 × 10⁵ PS microspheres, which corresponds to 1.0 pmole QDs/cm2. To verify the extrapolation result, we used 1, 1.6, and 8 pmoles of carboxyl QDs to incorporate with 5 × 10⁵ PEI-coated PS microspheres, respectively, and quantitatively compared the (i) absorbance values of the remaining QDs and (ii) fluorescence intensities of the QDs-doped microspheres between groups. It was found that both the absorption spectra of nonadsorbed QDs remaining from 1 and 1.6 pmoles amounts were similar to that detected by NaCl solution (i.e., background medium). In addition, the RFU value obtained from the 1.6 pmoles group was similar to that detected from the 8 pmoles group (P = NS) but significantly different to the result obtained from the 1 pmole group (P < 0.05). These results demonstrated the accuracy of the extrapolation analysis.
PL spectra of CdSe/ZnS QDs (dashed line) and QDs-doped PS microspheres (solid line).

Micrographic images of QDs-doped PS microspheres fabricated using 4 (a, d), 8 (b, e), and 16 (c, f) pmoles of QDs. The upper and bottom panels are the images photographed by bright-field (a–c) and fluorescent (d–f) microscopy, respectively (scale bar = 20 μm). The table shows fluorescent intensities of QDs-doped PS microspheres prepared with different QD amounts that were quantitatively represented by RFUs. Each RFU value represents the mean of three independent measurements. The fluorospectrometry was performed with excitation wave length of 480 nm and emission wave length of 565 nm for each group containing an equal number of 5 × 10⁵ microspheres.

Linear correlation between used QD amounts and absorbance of nonadsorbed QDs obtained from UV–Vis absorption spectra. The presented absorbance values were obtained at 545 nm wave length of UV–Vis absorption spectra (inset) and normalized by the background signal.

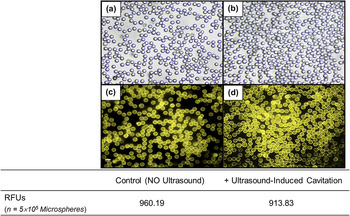
To examine the rigidity of binding between carboxyl QDs and amine PS matrices, ultrasound-induced cavitation was used to generate mechanical stresses upon the surfaces of QDs-tagged microparticles. Cavitation refers to the formation and destruction of micrometer-sized bubbles in the acoustic field. As bubbles grow, they will quickly reach resonant diameter and then collapse. Such bubble destruction will concentrate the intensity of the acoustic field by up to 11 orders of magnitudeReference Crum, Roy, Dinno, Church, Apfel, Holland and Madanshetty27 and highly impact the surrounding particles through the shock waves, shear stresses, and jet forces generated.Reference Miller28 Ultrasound-induced cavitation has been widely used in applications of drug/gene delivery (i.e., sonoporation) because it can enhance the permeability of cell membranes and accordingly allow the efficient entry of external molecules.Reference Liang, Tang and Halliwell29, Reference Pitt, Husseini and Staples30 In this study, 5 × 10⁵ QDs-doped PS microspheres were exposed to ultrasound performed using 1 MHz and 5 W/cm2 output intensity with 100% duty cycle for 15 min, following fluorescent microscopy and fluorospectrometry analyses. As shown in Fig. 7, all the microspheres that underwent ultrasound-induced cavitation still exhibited complete QDs coverage and clear fluorescent expression as they had before ultrasound treatment. In addition, we quantitatively measured the fluorescent intensities of QDs-doped PS microspheres before and after ultrasound exposure and obtained 960.19 ± 28.5 and 913.83 ± 25.94 RFUs, respectively. We further compared the RFU values between two groups and obtained P = 0.106, indicating that the fluorescence expression levels of QDs-tagged microspheres with and without impact of ultrasound-induced cavitation were similar. These results indicate that the CO2− provided by carboxyl QDs and the NH3+ from PEI groups can offer robust electrostatic interactions against mechanical stresses, hence maintaining a high photostability for QDs-doped PS microspheres.
Microscopic and fluorospectrometric analyses of QDs-doped PS microspheres with and without the impact of ultrasound-induced cavitation. Micrographic images of QDs-tagged microspheres were taken before (a, c) and after (b, d) ultrasound treatment using bright-field (a, b) and fluorescent (c, d) microscopy (scale bar = 20 μm). Fluorescent intensities of all samples were measured using a fluorescent microplate reader performed with excitation wave length of 480 nm and emission wave length of 565 nm and quantitatively represented by RFUs. Each RFU value exhibited is the mean of three independent measurements.

IV. CONCLUSIONS
In summary, we have presented the fabrication of high luminescence CdSe/ZnS QDs-doped PS microspheres using a self-assembly approach. The completeness of QDs coverage on the surfaces of the PS microspheres was demonstrated by ζ-potential measurement and corroborated by microscopic technology and fluorospectrometry. The quantity of CdSe/ZnS QDs on the PS microspheres was approximately 1.0 pmole/cm2 as verified through the analyses of fluorospectrometry and UV–Vis spectrophotometry. Furthermore, we demonstrated that the electrostatic interactions between carboxyl QDs and amine PS matrices can remain intact even in the presence of mechanical stresses, indicating the high stability of the product. Consequently, this research provides a facile and controllable strategy for the preparation of QDs-encoded microparticles that can be used as an optical tool in diverse biomedical applications.
Supplementary Material
Supplementary materials can be viewed in this issue of the Journal of Materials Research by visiting http://journals.cambridge.org/jmr.
ACKNOWLEDGMENT
The authors would like to thank Ceramic Transducer Design Co., Ltd. (Taiwan, Republic of China) for the gift of a PZT transducer.