1. Introduction
Equity is a complex concept and various definitions are proposed from different philosophical perspectives (e.g. Utilitarianism, Libertarianism etc.). Despite this complexity, the principle of equity in health care is espoused in the policy statements of many countries, including Ireland (e.g. DOHC, 2001). In the absence of a universally agreed definition of equity, empirical research has assessed health care delivery and financing against two pragmatic principles: that health care should be distributed according to need (rather than ability to pay) and financed according to ability to pay (e.g. van Doorslaer et al., Reference van Doorslaer, Wagstaff and Rutten1993). The focus of this paper is on the latter principle.
Specific analytic techniques have been developed to empirically test adherence to the two principles. The most widely recognised approach employs concentration indices to assess the distribution of health care services, and health financing resources, across the socio-economic distribution (see van Doorslaer et al., Reference van Doorslaer, Wagstaff and Rutten1993; Wagstaff and van Doorslaer, Reference Wagstaff and van Doorslaer2000). Researchers have used these methods to compare inequity in health care delivery and financing across a range of West European countries (including Ireland) and the US (van Doorslaer et al., Reference van Doorslaer, Wagstaff and Rutten1993; Wagstaff et al., Reference Wagstaff, Van Doorslaer, van der Burg, Calonge, Christiansen, Citoni, Gerdtham, Gerfin, Gross, Hakinnen, Johnson, John, Klavus, Lachaud, Lauritsen, Leu, Nolan, Peran, Pereira, Propper, Puffer, Rochaix, Rodriguez, Schellhorn, Sundberg and Winkilhake1999; van Doorslaer et al., Reference van Doorslaer, Wagstaff, van der Burg, Christiansen, de Graeve, Duchesne, Gerdtham, Gerfin, Geurts, Gross, Hakkinen, John, Klavus, Lue, Nolan, O’Donnell, Propper, Puffer, Schellhorn, Sundberg and Winkelhake2000).Footnote 1
The objectives of this paper are twofold. At a country-specific level, there are ongoing debates on options for changing the structure of Irish health care financing (e.g. Labour Party, 2008). These are taking place in the absence of up-to-date data on the equity implications of existing financing patterns as the most recent analysis refers to data from the late 1980s (Nolan, Reference Nolan1993; Wagstaff et al., Reference Wagstaff, Van Doorslaer, van der Burg, Calonge, Christiansen, Citoni, Gerdtham, Gerfin, Gross, Hakinnen, Johnson, John, Klavus, Lachaud, Lauritsen, Leu, Nolan, Peran, Pereira, Propper, Puffer, Rochaix, Rodriguez, Schellhorn, Sundberg and Winkilhake1999). This paper updates empirical findings on equity in Irish health care financing.
Second, the Irish context provides an example of a complex health financing system where public and private resources are used to finance different health care services for different people. It is important to assess the implications of this complexity for interpreting results from the standard measures of equity. Previous research has shown signs of progressive financing overall in the Irish health system (Nolan, Reference Nolan1993), indicating that richer people pay a higher proportion of their income towards health care relative to poorer people. The relatively benign conclusions about inequity in Irish health care financing are at odds with common perceptions of widespread inequities (e.g. Wren, Reference Wren2003; Tussing and Wren, Reference Tussing and Wren2006). There are concerns that available analytic measures are not adequately capturing patterns of inequity that are occurring in practice. Similar concerns have been raised in the context of low-income countries and adjustments to the methodological approach have been adopted (O’Donnell et al., Reference O’Donnell, van Doorslaer, Rannan-Eliya, Somanathan, Adhikari, Akkazieva, Harbianto, Garg, Hanvoravongchai, Herrin, Huq, Ibragimova, Karan, Kwon, Leung, Lu, Ohkusa, Pande, Racelis, Tin, Tisayaticom, Trisnantoro, Wan, Yang and Zhao2008; Leung et al., Reference Leung, Tin and O’Donnell2009). This paper assesses the existing methodological approach against the objective of understanding equity in the context of a high-income country, and assesses options for improving measurement.
Section 2 introduces the Irish health care financing and entitlement structures and Section 3 outlines the methodology and data. Section 4 presents and interprets the results and Section 5 presents the discussion and conclusion.
2. Financing and entitlement structures in the Irish health care system
The Irish health system is financed by a mix of public and private expenditure. Public resources have consistently accounted for 70–80% of total health resources. Public expenditure is mainly funded from general taxation, including social insurance contributions. A small amount of taxation is earmarked specifically to health in the form of a 2% health levy.
Private health expenditure is comprised of direct out-of-pocket payments by households (average 14% since the 1980s) and private health insurance (average 8% since the 1980s). Out-of-pocket payments include general practitioner (GP) and other professionals’ fees (e.g. dentists, opticians etc.), medicine costs, hospital charges and other medical goods and services. The initial aim of private health insurance was to provide cover for the wealthiest proportion of the population (approximately 15%) who at the time were required to pay in full for hospital care. Demand for private health insurance was buoyant even when free consultant treatment in public wards of hospitals was later extended to the richest earners in the population. The proportion of the population with supplementary private health insurance grew from 4% in 1960 to 35% by 1987 and has now reached 50% (Nolan, Reference Nolan2006; Insight Statistical Consulting, 2008). The private health insurance market is governed by community rating. All individuals purchasing the same private insurance product pay the same premium regardless of risk status or income.
There are two broad categories of entitlement in the system. Individuals earning below a specified threshold income level are granted a medical card (<30% of the population). The medical card entitles the bearer (and dependents) to free GP care, free prescriptions, free public hospital care and a range of community care services. From 2001 to 2009, medical cards were also granted to all individuals aged 70 and older.Footnote 2 A small number of cards are issued on the basis of ill health.Footnote 3
Non-medical cardholders are required to pay out-of-pocket for primary care services. Prices for GP visits jump from zero to full market price in a shift in the income distribution from below the medical card eligibility threshold to just above the threshold.Footnote 4 For prescription medicines, the situation is more complex. Prices jump from zero to full market price in the shift from medical card to non-medical card status. However, for payments above a monthly threshold, the price falls again to zero under the government Drugs Payment Scheme. Non-medical cardholders are eligible to receive public hospital services, subject to statutory co-payments (currently €75 per in-patient night, up to an annual maximum payment of €750, and €100 per self-referred out-patient and emergency department visit).
3. Methodology and data
3.1 Methodology
The principle that health care is financed according to ability to pay can be measured in terms of vertical and horizontal equity. This paper focuses on vertical equity whereby people of unequal ability to pay (measured by pre-tax income), pay unequal amounts. This captures the idea that rich people should pay more towards health care than the poor. Progressivity assesses how much more the rich are (or could be) paying.Footnote 5
This paper adopts the methodology from Wagstaff et al. (Reference Wagstaff, Van Doorslaer, van der Burg, Calonge, Christiansen, Citoni, Gerdtham, Gerfin, Gross, Hakinnen, Johnson, John, Klavus, Lachaud, Lauritsen, Leu, Nolan, Peran, Pereira, Propper, Puffer, Rochaix, Rodriguez, Schellhorn, Sundberg and Winkilhake1999), where the Kakwani indexFootnote 6 (K) is used to compare progressivity across sources of finance. In their cross-country analysis, progressivity has been measured in four main sources of health care financing in each participant country: taxation, social insurance, private health insurance and out-of-pocket household expenditure (van Doorslaer and Wagstaff, Reference van Doorslaer and Wagstaff1993; Wagstaff et al., Reference Wagstaff, Van Doorslaer, van der Burg, Calonge, Christiansen, Citoni, Gerdtham, Gerfin, Gross, Hakinnen, Johnson, John, Klavus, Lachaud, Lauritsen, Leu, Nolan, Peran, Pereira, Propper, Puffer, Rochaix, Rodriguez, Schellhorn, Sundberg and Winkilhake1999). Results for Ireland are based on data from the 1980s and are discussed in the context of the findings from this paper in Section 4.Footnote 7
The Kakwani index summarises the relationship between the Lorenz curve for income and a concentration curve. A concentration curve for a health-financing source shows the cumulative distribution of health care payments across the population (ranked by income). If health care payments are levied in proportion to income, the two curves coincide. If the average payment rate rises with income, the payment is progressive and the concentration curve lies below the Lorenz curve and vice versa. The Kakwani index (K) is calculated by subtracting the Gini coefficient from the Concentration index (calculated from the concentration curve in the same way as the Gini is calculated from the Lorenz). K ranges from −2 to +1. Positive values indicate progressivity, negative values indicate regressivity, and zero indicates proportionality (i.e. the Concentration and Gini coefficients coincide).Footnote 8
For this analysis, Kakwani indices are computed for each of the four main sources of health care expenditure using the convenient regression approach outlined in O’Donnell et al. (Reference O’Donnell, van Doorslaer, Wagstaff and Lindelow2007).Footnote 9 Gross income and expenditure variables are equivalised to control for differences in size and composition across households.Footnote 10 Dominance tests determine the statistical significance of differences between the observed concentration curves and both the 45° line and the Lorenz.Footnote 11 Where possible, a Kakwani index for total health care financing is calculated from a weighted sum of the indices for each individual source of finance. The weights are provided by the proportions of the four sources of finance in total financing.Footnote 12
3.2 Data
Analysis is conducted on data from 1987/88,Footnote 13 1999/2000 and 2004/05. The Household Budget Survey (HBS) provides micro-data on gross income,Footnote 14 income tax, social insurance contributions and household expenditure on private health insurance premiumsFootnote 15 and other health-related goods and services. The HBS covered a sample of 7705 households in 1987/88 (Central Statistics Office, 1988), 7644 households in 1999/2000 (Central Statistics Office, 1999) and 6884 households in 2004/05 (Central Statistics Office, 2005). Estimates of indirect tax payments are calculated on the basis of HBS data and are available for 1987/88 and 1999/2000.
By including the indirect tax payments, an index for total health care financing can be computed for 1987/88 and 1999/2000. The proportions of each source of finance in the total health resource envelope are used as weights to combine the individual progressivity indices into one index. The proportions are determined from national government statistics.
3.3 Methodological note on social insurance
For the purposes of consistency with previous work, this paper treats social insurance as a separate source of finance. In the Irish context, social insurance contributions refer to employees’ social insurance contributions plus the health levy. However, in practical terms, there is no sense in which these social insurance contributions are managed differently to general tax revenues. The majority of social insurance resources are not tied to specific health expenditures,Footnote 16 and are pooled with other government resources to fund the health system. Thus, social insurance in the Irish context does not operate along the same principles as social health insurance schemes in other European countries.
4. Results and interpretation
4.1 Concentration indices: 1987/88–2004/05
Kakwani indices for 1987/88,Footnote 17 1999/2000 and 2004/05 are presented in Figure 1.
Kakwani indices for Irish health care financing (1987/88, 1999/2000, 2004/05)

For each year, the index for income tax is positive (progressive). There is very little change in the size of the index over the period. The index for indirect tax is negative (regressive) in both 1987/88 and in 1999/2000. Indirect taxation accounts for a large proportion of government revenue and the negative value of the indirect tax index almost fully offsets the positive value of the income tax index. The index for total tax is positive and small in 1987/88 (0.05) and in 1999/2000 (0.04) indicating a marginally progressive pattern.
In all years, the index for social insurance contributions is progressive and the value is lower than for income tax, indicating that social insurance is not as progressive as income tax. The size of the index varies over time but the general pattern indicates a decline in progressivity since 1987/88.
The index for private health insurance is progressive in 1987/88 and 1999/2000, and regressive in 2004/05, although in each year the absolute value of the index is small.
The Kakwani index for out-of-pocket health expenditure is regressive in each year. Over the time period the index has become more regressive.
The weighted index for total financing, available for 1987/88 (0.05) and 1999/2000 (0.04), is positive and small for each year. The results suggest little change in the progressivity of total financing between the 1980s and 1999/2000.
4.2 Concentration curves and dominance tests: 2004/05
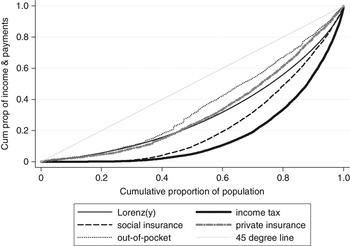
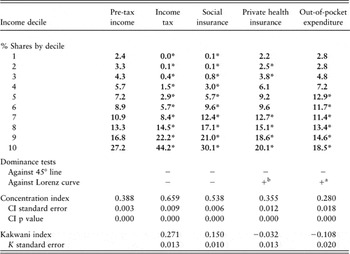
To examine in more detail the distributions underlying the Kakwani indices, the concentration curves for each source of finance for 2004/05, together with the Lorenz curve are shown in Figure 2. Distributional shares by income decile and dominance test results for 2004/05 are presented in Table 1. Table 2 presents the results from dominance tests for differences between the individual concentration curves.
Lorenz and concentration curves for health care financing sources in Ireland (2004/05)

Percentage distribution of health care financing by sources of finance and concentration indices (2004/05)

Shares by decile: Bold values indicate the percentage shares of income/expenditure are significantly different to the population shares (at p < 0.05). Superscript symbol *indicates the percentage shares of expenditure are significantly different to the pre-tax income shares (at p < 0.05).
Dominance tests: − indicates the concentration curve is dominated by the 45° line/Lorenz curve; + indicates the concentration curve dominates the 45° line/Lorenz curve.
Multiple comparison approach is applied. Decision rule makes comparisons at 19 quantiles and rejects the null of no significant difference between the curve if there is at least one significant difference in one direction and no significant difference in the other (at p < 0.05).
aUsing the alternative Intersection Union Principle (stricter decision rule), there is non-dominance between the curves. bUsing the alternative Intersection Union Principle (stricter decision rule), the curves cross each other.
Tests of dominance between concentration curves for health care financing (2004/05)

− Indicates the concentration curve of the row source is dominated by the concentration curve of the column source; + indicates the concentration curve of the row source dominates the concentration curve of the column source.
aUsing the alternative Intersection Union Principle (stricter decision rule), there is non-dominance between the curves.
For the public sources the sign and size of the Kakwani indices are consistent with the shape of the underlying concentration curves. The concentration curves for income tax and for social insurance both lie significantly (p < 0.05) below the Lorenz, indicating progressivity. The curve for income tax lies further below the Lorenz (i.e. more progressive) than the curve for social insurance.
For the private sources of financing, the concentration curves highlight uneven patterns that do not show up in the Kakwani indices. Distributional shares and dominance test results provide important supplementary information for these financing sources.
The concentration curve for private health insurance lies below the Lorenz curve at low incomes and above the Lorenz at higher incomes. Dominance testing rejects the null of no significant difference (p < 0.05) between the concentration curve for private health insurance and the Lorenz. Under the strict decision rule, the dominance test confirms that the curves cross each other. The distribution of payments by income decile highlights the uneven patterns. The shares of private insurance premiums paid by households at the low-income deciles are lower than their shares of total income while the opposite pattern is observed at higher deciles. The pattern changes at the highest income decile. Households in this decile pay 20.1% of total insurance premiums relative to their share of income of 27.2%.
The concentration curve for out-of-pocket expenditure generally lies above the Lorenz curve, indicating regressivity (consistent with the Kakwani index), but at low incomes the curve lies very close to the Lorenz. Dominance tests reject the null of no significant difference (p < 0.05) between these two curves but the result does not hold using the strict decision rule (i.e. there is non-dominance between the curves). The share of total out-of-pocket expenditure for the lower income deciles is not significantly different (p < 0.05) to their share of total income. Households in the lowest income decile pay just under 3% of total out-of-pocket payments relative to their income share of 2.4% (a difference of 0.4%). Households in the middle of the income distribution pay significantly (p < 0.05) higher shares of total payments relative to their shares of total income. Households in the fifth income decile pay almost 13% of total out-of-pocket payments while earning 7.2% of total income (a difference of 5.7%). At the higher end of the income distribution, households pay significantly (p < 0.05) lower shares of total payments relative to their shares of income.
4.3 Additional progressivity results for private health insurance: 2004/05
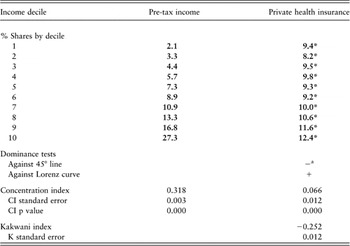
This section examines the distribution of the community-rated private insurance payments within the privately insured ‘community’. Progressivity analysis for private health insurance is undertaken for the privately insured population only for 2004/05 (Table 3). The Kakwani index is negative (−0.25, s.e. 0.01) and more regressive than the index for private health insurance based on the total population. The concentration curve dominates the Lorenz and this is statistically significant (p < 0.05) under the strict decision rule for dominance testing.
Kakwani index for private health insurance (restricted sample) 2004/05

Shares by decile: Bold values indicate the percentage shares of income/expenditure are significantly different to the population shares (at p < 0.05). Superscript symbol *indicates the percentage shares of expenditure are significantly different to the pre-tax income shares (at p < 0.05).
Dominance tests: − indicates the concentration curve is dominated by the 45° line/Lorenz curve; + indicates the concentration curve dominates the 45° line/Lorenz curve.
Multiple comparison approach is applied. Decision rule makes comparisons at 19 quantiles and rejects the null of no significant difference between the curve if there is at least one significant difference in one direction and no significant difference in the other (at p < 0.05).
aUsing the alternative Intersection Union Principle (stricter decision rule), there is non-dominance between the curves.
4.4 Out-of-pocket expenditure by type of expenditure: 2004/05
The analysis of out-of-pocket expenditure in 2004/05 is adjusted to provide individual assessment of doctor,Footnote 18 prescribed and non-prescribed medicines and other medical goods expenditure.
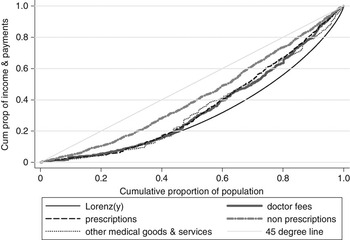
The individual concentration curves are presented in Figure 3. The concentration curve for non-prescription medicines statistically dominates the Lorenz (p < 0.05), while the curves for doctor, prescription medicines and ‘other’ medical costs lie close to the Lorenz at the lower end of the income distribution.
Concentration curves for out-of-pocket payments by type of expenditure (2004/05)

4.5 Interpretation of results
4.5.1 Public sources
Income tax and social insurance contributions were progressive in 1987/88, 1999/2000 and 2004/05. The basic structures of the Irish income tax and social insurance systems are designed to be progressive. Incomes are categorised into different income bands and the marginal rate of payments rises as the income band increases. There is an important distinction between the design of a system and how it is implemented in practice. In practice, these two systems operate a range of allowances, credits and exemptions that alter the degree of progressivity of the resultant payment patterns.Footnote 19
A ceiling on social insurance contributions dampens progressivity and helps explain why these contributions are less progressive than income tax payments. The data on social insurance include revenue from the health levy. In principle a percentage levy is proportional, deducting the same proportion of income regardless of the level of income. This reduces the overall progressivity of total social insurance payments. In practice there are many exemptions and a minimum threshold, which interfere with the proportionality of the levy.
Indirect taxes were regressive in 1987/88 and 1999/2000. Value added tax (VAT) accounts for the largest proportion of indirect taxes collected. In theory, an ad valorem tax like VAT can be proportional or even progressive where the tax is levied on luxury goods and services purchased more often by the rich. The opposite can also be the case. In the period under review, zero VAT rates were applied on a number of goods and services (e.g. education, mortgage repayments, insurance) that were purchased in greater proportions by higher income households (Central Statistics Office, 1987).
Changes in a Kakwani index over time can be influenced by changes in the distribution of the payments and/or the underlying income distribution (Kakwani index = Concentration index − Gini coefficient). For income tax payments, there have been important changes in the structure of the income tax system, since the late 1990s, which are consistent with improvements in progressivity. Tax credits (phased in from 1999 onwards) have replaced allowancesFootnote 20 (Bristow, Reference Bristow2004). A tax credit is a direct reduction from an individual’s tax liability and has a greater relative value to those on lower incomes. Subsequent increases in tax credits were directed at removing all those on the minimum wage from the tax net (Department of Finance, 2004). On the income side, income inequality has increased over time, as indicated by an increase in the Gini coefficient between 1999/2000 (0.36, s.e. 0.002) and 2004/05 (0.39, s.e. 0.003). The relatively static Kakwani index for income tax between 1999/2000 and 2004/05 suggests that improvements in progressivity expected from the structural changes have been offset by increased income inequality over this period.Footnote 21
For social insurance contributions, the results indicate an overall decline in progressivity since 1987/88. Between 1987/88 and 1999/2000, a minimum threshold, below which social insurance was not payable was introduced (progressive) (and the Kakwani index is slightly higher in 1999/2000 than in 1987/88). An allowance system was subsequently implemented to further improve progressivity (Callan and Nolan, Reference Callan and Nolan2000). Within social insurance, the threshold below which the health levy is not payable was increased (Department of Finance, 2004), thereby exempting greater numbers of low-income individuals from the levy. As with income tax payments, progressive changes in the structure of social insurance contributions appear to have been offset by a rise in the index of income inequality.
There have been no radical changes to the implementation of indirect taxes since the late 1980s. There is a growing interest in the distributional impact of these taxes and the time lag in collection of indirect tax data needs to be addressed.
While income and indirect taxes continue to account for the largest share of government tax revenue, there has been strong growth in the importance of other revenue sources. Revenue from corporation tax has increased from less than 5% in the 1980s to more than 13% (Revenue Commissioners, 2007). Stamp duty (e.g. imposed on property and other transactions) has also increased in importance. Future analysis of progressivity in public health financing sources will therefore need to incorporate methods for assessing the distributional burden of these other sources of revenue at the household level (O’Donnell et al., Reference O’Donnell, van Doorslaer, Wagstaff and Lindelow2007).
As outlined earlier, the progressivity of social insurance is treated separately from tax in this paper for reasons of methodological consistency with previous analysis. However, this has to be balanced against the applicability of this separation to the Irish context. In the practical sense, social insurance contributions in Ireland are not managed differently to general government revenues. Given the comparative nature of this type of analysis, the separation in the Irish data risks by confusing social insurance in the Irish context with social health insurance systems of other European countries (e.g. France, the Netherlands etc.).
4.5.2 Private sources
Progressivity assessment of the private sources of financing is complicated by the uneven patterns of payments across the income distributions, as illustrated for 2004/05. These patterns reduce the interpretability of the Kakwani or any other summary index.
In principle, the community-rated structure in private health insurance is expected to be regressive. A flat-rate premium imposes a relatively greater burden on lower income households. It is argued that in terms of health risk profile, the system of community rating ensures that poorer, but sicker, individuals are not burdened by the higher premiums that they would otherwise have to pay in an actuarially priced (i.e. risk-rated) system. Yet without pooling for income as well as health risk, the system fails to prevent a situation whereby poorer, but healthier, individuals subsidise the health costs of richer, but sicker, individuals. However, results for 2004/05 show that the distribution of private insurance payments is marginally progressive at lower incomes, although there are indications of regressivity at higher incomes.
There are similar problems in interpreting the observed distributional pattern for out-of-pocket payments. Out-of-pocket expenditures apply on a wide range of goods and services and there is no single system governing the imposition of these charges. However, it is widely accepted that in the case of flat-rate out-of-pocket charges, the financial burden is relatively greater on lower income households. Although the Kakwani index indicates that out-of-pocket expenditure is regressive, the distribution (shown for 2004/05) is uneven and lies close to proportional for the poorest households. Explanation of the observed expenditure patterns needs to look beyond the hypothesised impact of a flat-rate out-of-pocket fee.
These private sources of finance are directly linked to private consumption. Benefits from consumption of these goods and services are privately enjoyed by those who make the payments. Recognition of these factors helps explain the observed patterns of expenditure. In the analysis of progressivity of public sources, it is assumed that all contributions are pooled to fund the public health system, from which everyone is entitled to receive care. Contributions to the system are not linked to benefits received from the system. Thus, in a progressive distribution, lower or non-payment of public contributions by lower income households does not affect how much health care they receive in turn. These households are contributing on the basis of ability to pay (progressive) and will (or at least should) receive care according to need.Footnote 22 For private sources of finance, this assumption cannot hold.
Payment for private health insurance secures health care for the paying household only. An out-of-pocket payment for medicine benefits the individual making that payment. In private sources of finance, expenditure is a sign of consumption. If households are spending, this indicates that they are receiving health care benefits. If households are not spending, they are not consuming. A progressive distribution for private financing does not have the same equity interpretation as for public sources.
The voluntary nature of private financing sources implies that actual expenditures reflect underlying and unobserved preferences and needs for the products on offer which in turn influence households’ price elasticities of demand. Understanding the demand and pricing structures for health services financed by private resources can shed greater light on the results observed for private payments.
Technically, private health insurance in Ireland is a luxury item, granting access for those who pay the premiums to private health care, to supplement what is already available through the public system. Lower income households are expected to be particularly sensitive to the price. The low proportion of expenditure on private health insurance premiums at lower incomes is likely to be reflecting the non-affordability of private health insurance for these households. This has the effect of making private health insurance look progressive at low incomes. Where the analysis is restricted to only those who purchased private health insurance, thereby controlling for the voluntary element, the regressive impact of community rating shows up more clearly, as illustrated in Section 4.3.Footnote 23
The impact of community rating is interesting here. If the un-insured are relatively healthy, their low risk could secure a lower and more affordable premium in a market governed by actuarially priced rather than community-rated premiums. There is evidence that individuals who are un-insured and who are not eligible for a medical card are relatively poor, but not as poor and sick, as those on medical cards (Watson and Williams, Reference Watson and Williams2001). Thus, the system of community rating may be imposing artificially high premiums on what is a relatively young and healthy population. A reduction in premiums would improve access to private health insurance for this group although this is likely to show up in the concentration analysis as an increase in regressivity (as expenditure increases amongst mid-lower income groups). Conversely, for medical card holders, who are more likely to be at the lowest end of the income distribution and are known to have a relatively worse health profile, community-rated premiums are likely to be lower than what would be offered in a risk-rated system. In practice, private health insurance companies now offer an increasingly differentiated range of products, catering to the needs of different categories of people. The differential pricing of community-rated products introduces elements of actuarial risk-rated pricing which further interferes with the patterns of progressivity in the system.
The analysis of out-of-pocket payments by type of expenditure allows separate investigation of different payment structures. Prices for doctor visits and medicines are influenced by the health care entitlement system. Lower expenditure by poorer income deciles for doctor and prescription medicine costs is consistent with low expenditure by medical cardholders who face zero prices for these services. A similar pattern is observed for ‘other’ expenditure and many of the goods and services included in this category are also provided free of charge to medical cardholders (e.g. dental care, other professionals’ fees etc.). For non-prescription medicines, there is no such price protection for medical cardholders. All individuals are subject to full market prices for non-prescribed medicines, regardless of entitlement status. This is reflected in higher expenditures at lower incomes relative to doctor, prescription medicine and ‘other’ expenditures. Private health insurance status can also alter the structure of out-of-pocket prices paid by households. However, in the case of primary care (accounting for the major share of out-of-pocket payments), until recently, private health insurance coverage for primary care was limited.Footnote 24
It is noted that the curves for doctor and prescription medicine costs only cross (from below) the Lorenz curve at points above the 50th percentile while the medical card income threshold falls much earlier in the distribution.Footnote 25 This may indicate some non-expenditure by individuals who are at the mid-low end of the income distribution due to un-affordability.Footnote 26 Recent survey analysis indicates that individuals are restricting visits to the GP for reasons of un-affordability (O’Reilly et al., Reference O’Reilly, O’Dowd, Galway, Murphy, O’Neill, Shryane, Steele, Bury, Gilliland and Kelly2007).
4.5.3 Summary indices
The standard drawbacks of using index measures to summarise underlying distributional patterns have been observed here. Where curves cross (e.g. for private health insurance), the summary index is un-interpretable. Uneven distributions (e.g. out-of-pocket payments) are not picked up by summary measures. The important points raised in the interpretation of the results are based on assessment of all the available information on the distribution of payments (i.e. concentration curves, expenditure shares by decile, dominance testing). This would not have been possible if the focus had only been on the summary index measures. Moreover, the interpretation problems for private resources stem from the attributes of the financing source per se and not from the choice of index measure.
5 Discussion
Section 4.5.1 discussed evidence for the observed patterns of progressivity in public sources of health care in the Irish system. To understand the results, assessment was needed of both the underlying payment systems, and of how the systems are implemented in practice. Changes in progressivity over time need to take into account changes in how the systems are implemented and the distribution of income across the population.
Section 4.5.2 discussed evidence for the observed distributions of private expenditure. To fully explain the results, the voluntary element associated with private health insurance and out-of-pocket payments has to be taken into account. Further analysis for 2004/05 showed how the observed progressivity patterns change when the analysis focuses either only on those who have volunteered for the payments, or on payments that have been deliberately separated in terms of pricing structures.
Analysis of the results for private payments points to a fundamental problem in using the measurement of progressivity as a way of assessing equity in health care financing. There are important ‘unknowns’ in interpreting the progressivity results for private financing sources. The approach is unable to identify non-expenditure by households who cannot afford the given health service, nor can it indicate the counterfactual as to what would happen if prices were altered. Apparent improvements or otherwise in progressivity are likely to be inconsistent with intuitions about what is or is not equitable. As outlined earlier, an increase in access to private health insurance, by reducing the premium charged to lower-income groups, may actually be reflected as an increase in regressivity (the concentration curve may shift upwards). Similarly, a reduction in the price of GP care may improve access for mid-low income people who were previously unable to afford to see their GP. Yet this might be reflected as a further increase in regressivity of out-of-pocket payments as expenditure by this group rises.Footnote 27
This raises questions about the appropriateness of this methodology vis-à-vis the ultimate objective of assessing equity in a health care financing system. There are limitations to investigating equity in health care financing using this methodology in a mixed public/private financing system. This has recently been raised as an important issue particularly in the context of low-income countries where out-of-pocket payments account for a large proportion of total health care resources (O’Donnell et al., Reference O’Donnell, van Doorslaer, Rannan-Eliya, Somanathan, Adhikari, Akkazieva, Harbianto, Garg, Hanvoravongchai, Herrin, Huq, Ibragimova, Karan, Kwon, Leung, Lu, Ohkusa, Pande, Racelis, Tin, Tisayaticom, Trisnantoro, Wan, Yang and Zhao2008; Leung et al., Reference Leung, Tin and O’Donnell2009). In contrast, in the previous analysis of equity in Ireland and other West European countries (van Doorslaer and Wagstaff, Reference van Doorslaer and Wagstaff1993; Wagstaff et al., Reference Wagstaff, Van Doorslaer, van der Burg, Calonge, Christiansen, Citoni, Gerdtham, Gerfin, Gross, Hakinnen, Johnson, John, Klavus, Lachaud, Lauritsen, Leu, Nolan, Peran, Pereira, Propper, Puffer, Rochaix, Rodriguez, Schellhorn, Sundberg and Winkilhake1999), most of the health systems were considered to be pre-paid (e.g. through general taxation or social insurance) and widely accessible. The problems in interpreting progressivity in private financing sources were not regarded as critical to the overall results on equity in these systems.
However, although private sources do account for a small proportion of total resources in the Irish health system, public and private financing is combined in a complex way. The complications in interpreting progressivity results for private sources of financing are more visible in Ireland than in other West European and high-income countries because of the way in which the health financing system is structured. Two specific observations illustrate this.
The growth in voluntary demand for private health insurance from 4% in 1960 to 50% today indicates that this is not a marginal issue despite its small proportion in total health care resources. Given that half of the adult population deem it necessary to purchase ‘supplementary’ insurance, it is important to pay more attention to the equity implications of this source of finance. Attitudinal surveys indicate that ensuring access to hospital care and avoiding long waiting times for public care are key reasons for obtaining health insurance in Ireland (Nolan and Wiley, Reference Nolan and Wiley2000; Watson and Williams, Reference Watson and Williams2001; Nolan, Reference Nolan2005). The value of private health insurance to such a wide group in the population supports the conclusion that non-payment by lower income groups is due to reasons of un-affordability and as such, is a source of inequity in the system.
Second, out-of-pocket payments play a key role in financing primary care in Ireland. Out-of-pocket expenditure accounts for less than 15% of total health care resources, yet contributes more than 35% of national expenditure on medical goods (i.e. prescriptions, medicines etc.), and over 40% of payments to GPs (Smith, Reference Smith2008). This is a direct result of the entitlement structures in the system whereby only medical cardholders are eligible for free primary care funded from public sources.
These facts reinforce the importance of understanding the underlying patterns of equity in the private sources of financing in the Irish context to arrive at a true account of equity in Irish health care financing. One option would be to drop the practice of combining the progressivity indices for all sources of financing into one index for total finance and to focus only on weighted indices for public and private sources. This would not solve the problems in interpreting private sources but would at least prevent any ‘pollution’ of the results for public sources.
Yet this assumes there is no interaction between public and private sources of finance. In the Irish health system, this assumption does not hold. The public and private health care systems are not independent and a large proportion of private health care shares human and capital resources with the public system (e.g. approximately half of all privately insured hospital care is provided within public hospitals; VHI Healthcare, 2003). Analysing vertical equity in public and private sources of financing separately would fail to see that ultimately some public health resources are used to subsidise privately insured care. Some of the general tax and social insurance contributions that are pooled to fund the public system go towards subsidising the premiums paid by privately insured individuals (via tax relief on insurance premiums) and subsidising the full economic cost of private care in public hospitals, and other cross subsidies. The public sources are overall marginally progressive and richer individuals contribute more as a proportion of their income. Notwithstanding this, the rationale for using funds raised from the whole population to subsidise care for one specific group at the wealthy end of the income distribution, is questioned. Interactions between public and private health care in the Irish system lead to cross subsidies that alter the underlying equity patterns in public sources, and these are not observed through standard analysis.
An alternative option is to more formally incorporate assessment of the inter-linkages between payment and consumption into the measurement of equity in health care financing. This is the approach taken in recent analysis of equity in health financing in Asian countries (O’Donnell et al., Reference O’Donnell, van Doorslaer, Rannan-Eliya, Somanathan, Adhikari, Akkazieva, Harbianto, Garg, Hanvoravongchai, Herrin, Huq, Ibragimova, Karan, Kwon, Leung, Lu, Ohkusa, Pande, Racelis, Tin, Tisayaticom, Trisnantoro, Wan, Yang and Zhao2008; Leung et al., Reference Leung, Tin and O’Donnell2009). Leung et al. (Reference Leung, Tin and O’Donnell2009) focus on the distribution of health care payments alongside the distribution of income, and examine the net redistributive effect of public health spending. In the Irish context, joint analysis of payments and utilisation would also need to specifically examine interactions between public and private sources. It is clear from the above results that different concepts of equity can be operating at different points and for different individuals within one health system. The object of analysis is therefore complex and multi-dimensional. In this context it is inevitable that the analytic results will need to be detailed. To attempt to summarise these results into a single index would risk losing critical and policy-relevant information.
In conclusion, Kakwani indices for public and private sources of Irish health care financing have been updated. Based on 2004/05 data, indices for income tax and social insurance contributions are progressive while indices for private health insurance payments and out-of-pocket payments are regressive. However, there are problems in interpreting these standard measures of equity in private health care resources. These have been acknowledged in the literature particularly in the context of low-income countries with high proportions of private health financing. This paper argues that these problems cannot be overlooked even in a high income setting, as illustrated for the Irish health care financing system. Although private sources account for a relatively small proportion of total resources in Ireland, there is a complex mix of public and private financing. An alternative whole systems approach, whereby health care financing and delivery are analysed within one framework, is more appropriate for further analysis in this context (Smith and Normand, 2009).
Acknowledgements
Many thanks to Prof. Charles Normand and Dr Steve Thomas for expert advice and support and to Jim Dalton (CSO) for data assistance. This research was funded by the Irish Research Council for the Humanities and Social Sciences (IRCHSS).