


Introduction
The United States Geological Survey (USGS) Water Resources Discipline glacier-monitoring program began as a result of the International Geophysical Year (IGY; 1957–58) (Reference Meier, Tangborn, Mayo and PostMeier and others, 1971), and now that the Third International Polar Year (IPY; 2007–08) is approaching, it is fitting to examine the unique records from measurements of seasonal mass balances that clearly document dramatic glacier shrinkage that has occurred over nearly 50 years. The adage that ‘glaciers are an indicator of climate’ generally refers to changes in glacier length, which are difficult to interpret and relate to short-term climate fluctuations because a glacier is continually adjusting (responding) to past changes in mass balance. Reference Arendt, Echelmeyer, Harrison, Lingle and ValentineArendt and others (2002) found little correlation between the rate of length change and the rate of thickness change. However, seasonal measurements of glacier mass balance, winter accumulation and summer ablation directly integrate the annual variations of key climate variables, including precipitation and temperature. Observations from mountain glaciers are particularly valuable because they provide measurements of climatic conditions from remote regions with sparse observations and at higher altitudes than most climate stations.
The three glaciers of the USGS glacier-monitoring program are South Cascade Glacier in the North Cascade Mountains of Washington; Wolverine Glacier near the southern coast of Alaska; and Gulkana Glacier in the interior of Alaska. These glaciers were chosen to represent the large number of glaciers in each region. Each region is subject to a different climate: South Cascade and Wolverine Glaciers are both maritime glaciers, and although separated by 2200 km they consequently receive deep winter snowpacks, as much as 8m, and undergo substantial melting during summer. Gulkana Glacier is a continental glacier shielded from the moisture-bearing storms of the Gulf of Alaska by the east–west-trending Chugach, Wrangell and Talkeetna mountain ranges to the south. Reference Hodge, Trabant, Krimmel, Heinrichs, March and JosbergerHodge and others (1998) fully describe the characteristics of each glacier, while Reference MarchMarch (1998), Reference Mayo, Trabant and MarchMayo and others (2004) and Reference Bidlake, Josberger and SavocaBidlake and others (2005) provide complete details on the measurement program at each glacier. Although glacier mass balances can be estimated by many different techniques, mass-balance records considered in this paper are those assembled from on-glacier measurements begun on each glacier in the late 1950s or mid-1960s.
The net mass balance of a glacier is the net change in mass between successive balance minima (b n), usually summer surfaces, including changes in both ice and snow thickness, averaged over the area of the glacier. The balance year can be divided into two parts, the winter season, dominated by accumulation (b w), and the summer season, dominated by snow- and ice melt (b s). Changes in thicknesses of ice and snow are adjusted by their density, and the balances are reported in meters of water equivalent (mw.e.). The data are typically acquired from changes in surface heights of snow or ice measured on stakes, snow distribution on the glacier is determined from probing the snowpack on the glacier, and the vertical distribution of snow density is obtained from weighing known volumes of snow. For these glaciers the error is usually ±0.1 to ±0.2 m. Reference Mayo, Meier and TangbornMayo and others (1972) describe the mass-balance terminology, and Reference Østrem and BrugmanØstrem and Brugman (1991) describe various data collection techniques, while Reference KrimmelKrimmel (1996) fully describes the techniques used at South Cascade Glacier. The seasonal mass-balance records started in 1959 for South Cascade Glacier and in 1966 for Wolverine and Gulkana Glaciers. The record for South Cascade Glacier is the longest seasonal mass-balance record in North America, and only a few longer records exist worldwide.
Numerous investigators have used these datasets to address key issues of glacier–climate fluctuations, as they represent a major component of the global glacier population. Reference MeierMeier (1984), Reference Dyurgerov and MeierDyurgerov and Meier (1997, Reference Dyurgerov and Meier2000) and Reference Meier, Dyurgerov and McCabeMeier and others (2003) have used these datasets in global studies of the wastage of small mountain glaciers and their impact on global sea level. Reference Rasmussen and ConwayRasmussen and Conway (2001, Reference Rasmussen and Conway2004) combined upper-air meteorological observations with these mass-balance observations to develop regional mass-balance models. New concepts and ways to interpret mass-balance data have resulted from the observations at South Cascade Glacier. Reference Harrison, Elsberg, Echelmeyer and KrimmelHarrison and others (2001, Reference Harrison, Raymond, Echelmeyer and Krimmel2003) characterized the response of a glacier to climate change with a single timescale based on the glacier geometry and mass balance.
These data have also been extensively used to investigate the relationship between glacier mass-balance and climate fluctuations as characterized by various indices, such as the Pacific Decadal Oscillation (PDO) and the Southern Oscillation Index (SOI). There is an extensive body of work on this subject (e.g. Reference Walters, Meier and PatersonWalters and Meier, 1989; Reference Hodge, Trabant, Krimmel, Heinrichs, March and JosbergerHodge and others, 1998; Reference Bitz and BattistiBitz and Battisti, 1999). These studies have shown that there exist strong correlations between fluctuations of climate and glacier mass balance, particularly for the maritime glaciers. In addition, there are significant inter-glacier correlations between the balances that represent patterns in atmospheric circulation. The mass-balance records are now 10–15 years longer since many of these studies took place, and while many correlations remain unchanged, there are new trends and some changes in important correlations. Most importantly, all three glaciers now demonstrate a correlated negative mass balance, as observed globally for mountain glaciers (Reference Dyurgerov and MeierDyurgerov and Meier, 2000).
Changes in Net Balance
The net balance, the total mass lost or gained by a glacier, averaged over the surface of the glacier per year, clearly shows different and distinct long-term periods for all three glaciers (Fig. 1). For South Cascade Glacier, there are four visually distinct periods evident in the record. For the period 1959–70, South Cascade Glacier lost 4.6mw.e., while the period 1970–76 is the only sustained positive period in the entire record, when the glacier gained 2.9mw.e. It then entered an extended period of mass loss that spanned 1977– 95 when it nearly monotonically lost 16.5 mw.e. The last period, 1995–2004, although still negative overall, was interspersed with a few positive years as well as some of the most negative years in the record. This negative trend in mass balance was characteristic of glaciers in the North Cascade Range. Measurements by the US National Park Service and others on as many as 14 glaciers during 1984– 2000 indicated mass balance of those other North Cascade glaciers correlated (r = 0.79–0.95, average r = 0.87) with that of South Cascade Glacier (Reference Pelto and RiedelPelto and Riedel, 2001). Finally, the overall wastage of South Cascade Glacier during 1959–2004 was qualitatively similar to the generalized glacier wastage in much of the Washington North Cascades (1959–98) reported by Reference Granshaw and FountainGranshaw and Fountain (2006).
Cumulative net balance for the entire measurement record for Wolverine, Gulkana and South Cascade Glaciers.

For Wolverine Glacier, there are three distinct periods. The first period spans 1966–76, in which there was a negative mass-balance trend and the cumulative net balance was –7.1mw.e. From 1976 to 1988, Wolverine gained 5.9 mw.e. The gain was not uniform, but the result of several years, 1980, 1981, 1987 and 1988, with large net balances generally in the range 1.5–2.0mw.e. (Fig. 2). After 1988, Wolverine Glacier entered a period of nearly uniform mass loss that continued to 2004, with the glacier losing 14.4mw.e. Gulkana Glacier, in the interior of Alaska, exhibited three different trends. The first was a short period, 1966–73, of almost static net balance. This was followed by a loss of 2.9 mw.e. during 1974–85. Then the trend became more negative, such that by 2004 Gulkana has lost an additional 12.8 mw.e.
The entire time series of measured winter balances (medium gray), summer balances (light gray) and net balances (black) for the three glaciers.

A comparison of the records from all three glaciers (Fig. 1) shows that early in the record the net balance of each glacier behaved independently. In 1977, South Cascade Glacier began a nearly monotonic period of negative balance, which continued through 2004. Wolverine and Gulkana Glaciers followed in 1989 with comparable specific mass losses. The average net balance for South Cascade Glacier for the period 1977–2004 was –0.78mw.e., while the average net balance for Wolverine and Gulkana Glaciers for the period 1989–2004 was –0.90 and –0.80mw.e., respectively. Inspection of the period 2000–04, which is too short for meaningful statistics, suggests that the net balances are becoming more negative, thus following the current global trend in glacier wastage (Reference Meier, Dyurgerov and McCabeMeier and others, 2003).
Glacier Volume
The mass-balance record for a glacier only gives the rate of change of ice surface; ice volume estimates can be used to assess total water storage and for modeling glacier dynamics. Table 1 gives estimates of the ice volume for South Cascade Glacier from 1890 to 2001. Glacier surface extent and altitude in about 1890 were estimated on the basis of dated glacier moraines (Reference MillerMiller, 1968) and trimlines on the valley walls. An oblique photograph of the glacier from 1928 was used to estimate the glacier surface altitude for that year; for the remaining years, the glacier surface was mapped with stereo aerial photography or by optical surveying on the glacier. Regularly spaced glacier surface altitude grids were made from the maps or directly from photogrammetric analysis.
South Cascade Glacier volume and rate-of-volume-change estimates
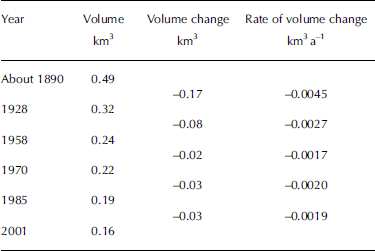
The glacier surface altitude grids, combined with bed topography from an ice-penetrating radar study and USGS 7.50 topographic maps, yielded South Cascade Glacier volumes ranging from 0.49 km3 in about 1890, to 0.16km3 in 2001 (Table 1). Inaccuracies in the bed topography and the photogrammetric analysis are greater than the glacier-average annual changes typically measured with networks of ablation stakes. Hence, the volume changes cannot be used for annual mass-balance determinations, but rather to give estimates of long-term changes and to check the cumulative mass balance for bias errors. From about 1890 to 1928 the glacier lost 35% of its volume, at an average rate of –0.0045km3 a–1, while from 1928 to 2001 the glacier lost 50% of its remaining volume, at an average rate of –0.002 km3 a–1.
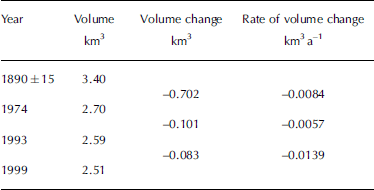
The volume of Gulkana Glacier was estimated using procedures similar to those used for South Cascade Glacier, and is given in Table 2. The area and surface height distribution of Gulkana Glacier in about 1890 were estimated primarily by filling the void between the height of dated trimlines and the current-day ice surface with an imaginary ice mass with the same surface shape as the current glacier. The 1974 volume was estimated by assuming the average ice thickness was 147 m, which is the average of 19 ice radar measurements made in 1976. Other volumes are determined from the estimated 1974 volume and the measured volume changes. Area and surface height distribution in 1974, 1993 and 1999 were measured photogrammetrically using stereo vertical photography (Reference Cox and MarchCox and March, 2004). The volume of Gulkana Glacier in 1890 was an order of magnitude greater than that of South Cascade Glacier (Tables 1 and 2), and the rate of volume loss also has been substantially greater for Gulkana than for South Cascade Glacier. The fraction of volume lost has been much greater for South Cascade than for the larger Gulkana Glacier. South Cascade Glacier lost 67% of its volume during 1890–2001, whereas Gulkana Glacier lost 26% of its volume during 1890–1999.
Gulkana Glacier volume and rate-of-volume-change estimates
Trends in Seasonal Balances
The cumulative net balance clearly shows the overall trends, and the winter, summer and net balance (b w, b s and b n) time series (Fig. 2) provide additional information on glacier fluctuations in response to climate variations. The trends in the seasonal balances, given here as millimeters water equivalent per year (mm a–1), are not as apparent as in the cumulative net balance, and we used a Mann–Kendall test for trend, with statistical significance level stated in terms of percent probability of incorrectly rejecting the null hypothesis that no trend exists. Slopes of statistically significant trends were evaluated using Sen’s non-parametric estimator of slope (Reference GilbertGilbert, 1987).
We carried out the test on the entire period of record for the seasonal balances from each glacier and then for the interval 1989–2004, where 1989 corresponds to the year when cumulative net balance of all three glaciers began the synchronous decline (Fig. 1) and to a moderate shift in the PDO (Reference RodionovRodionov, 2004). Trends were not detected in the winter balance or in the summer balance for the period 1989–2004, except for Wolverine Glacier, where the winter balance trend of 51.0 mma–1 was detected at the 10% significance level. One possible reason for the lack of detection of simple linear trends in winter balance could be confounding effects on precipitation due to low-frequency variations of conditions in the northeast Pacific Ocean. Negative trends in the summer balance for the period of record were detected at the 5% significance level for the two Alaskan glaciers and at the 10% significance level for South Cascade Glacier. The summer balance trends during 1966–2004 were –21.0 and –23.0mma–1 for Wolverine and Gulkana Glaciers, respectively, and the summer balance trend during 1959–2004 for South Cascade Glacier was –18.1mma–1.
That summer climate conditions became progressively more conducive to mass loss, probably due to warming, is also seen in the fact that many of the most negative summer balances at each glacier occurred during later years. Eight of the ten most negative summer balances of the Gulkana Glacier record occurred during 1989–2004, and the corresponding numbers of summer balances for Wolverine and South Cascade Glaciers were seven and five, respectively.
Investigators have found substantial declines in the snow water equivalent in the Pacific Northwest by analyzing observations from the US Natural Resources and Conservation Service (NRCS) snow-course and automated SNOTEL networks (Reference MoteMote, 2003; Reference Mote, Hamlet, Clark and LettenmaierMote and others, 2005). The winter balance of South Cascade Glacier does not exhibit a similar negative trend, which is likely due partly to the glacier’s high altitude. The altitude of South Cascade Glacier ranges from about 1600 to 2100 m, while most NRCS sites are at lower altitude. Reference MoteMote (2003) found that the decline in snow water equivalent has been greatest below 1800 m. The South Cascade Glacier trend analysis results are consistent with the results of a study by Reference Hamlet and LettenmaierHamlet and Lettenmaier (1999) that showed that for future climate scenarios the Cascade Mountains will receive approximately the same amount of precipitation, but less snow because it will be warmer. Thus, the lack to date of a negative trend in the winter balance of South Cascade Glacier is likely at least partly the result of the altitude of the glacier which reduces the impact of increasing winter temperature.
Glacier Turnover
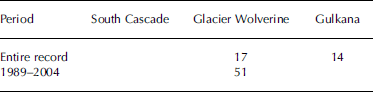
The annual turnover of glacier mass, the average of the absolute values of the winter and summer balance (Reference MeierMeier, 1984; Reference Dyurgerov and MeierDyurgerov and Meier, 2000), is a measure of the flux of water through a glacier system, and it reflects intensity of hydrologic cycling through that system. As expected, annual turnover, expressed in mw.e., of the two maritime glaciers, South Cascade and Wolverine Glaciers, is about twice as great as that of the more continental Gulkana Glacier (Fig. 3). In addition, there appear to be positive trends in annual turnover, particularly from the late 1980s to 2004. To test for trends, we carried out a Mann–Kendall test for the entire period of record of each glacier, and for the period 1989– 2004, and the results are given in Table 3. For the period of record, we found positive trends of annual turnover for Wolverine and Gulkana Glaciers, at a 5% significance level, but no trend for South Cascade Glacier. For the period 1989– 2004, a positive trend was detected for Wolverine Glacier at the 10% significance level. The rate of increase in annual turnover is given in Table 3, and ranges from 14 to 51 mma–1, which is substantially higher than the global average for small glaciers, of 0.9 mma–1 computed by Reference Dyurgerov and MeierDyurgerov and Meier (2000) using data from 1961 through 1997.
The annual turnover for the three glaciers; the lines are 5 year running averages.

Trends in annual turnover (mm a–1) for each glacier for the period of record and for 1989–2004
Inter-Glacier and Glacier–Climate Correlations
The addition of 10 years or more of mass-balance data beyond previous investigations allows us to reassess relationships between the glacier balances and also between the balances and climate indices. We computed the correlations between the winter balances for all three glaciers, first for the period 1966–88 and then for 1989–2004. For the first period we found significant correlation of –0.62 between the South Cascade Glacier and Wolverine Glacier winter balances. For the second period, the correlation changed from –0.62 to –0.26, indicating winter balance of South Cascade Glacier as less strongly but still negatively correlated with winter balance of Wolverine Glacier, which indicates a possible change in the winter accumulation patterns.
It is well known that the atmospheric circulation over the northeast Pacific has a strong impact on the winter accumulation on the maritime glaciers of this study, (Reference Walters, Meier and PatersonWalters and Meier, 1989; Reference Hodge, Trabant, Krimmel, Heinrichs, March and JosbergerHodge and others, 1998; Reference Bitz and BattistiBitz and Battisti, 1999). The fluctuations in climate can be represented by any one of several indices. In this study, we used the PDO (Reference Mantua, Hare, Zhang, Wallace and FrancisMantua and others, 1997) to represent climate conditions in the northeast Pacific. The PDO is defined as the leading principal component of North Pacific monthly sea-surface temperature variability north of 20˚ N, and warm or cold phases of the PDO can persist for 10 years or more. The values are available from the Joint Institute for the Study of the Ocean and the Atmosphere, University of Washington, Seattle, WA, USA (http://jisao.washington.edu/pdo/PDO.latest).
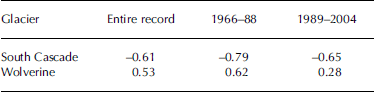
To re-examine the links between glacier mass balance and circulation in the northeast Pacific, we computed correlations between the winter average PDO for December–March and the winter balances for the maritime South Cascade and Wolverine Glaciers. By using three time periods, the period of record, 1966–88 and 1989–2004, we found a significant change in the relationship between the PDO and the winter balances of Wolverine Glacier, but less so for South Cascade Glacier. Table 4 shows that while there are strong correlations for the period of record in all cases, the strength of the correlations is considerably lower for the 1989–2004 period. Note that the sign of the correlation coefficient is negative for South Cascade Glacier and positive for Wolverine, which indicates the well-documented, inverse accumulation pattern driven by changes in storm tracks between warm and cool PDO excursions (Reference Walters, Meier and PatersonWalters and Meier 1989). During cool PDO periods, winter storms are directed towards Washington State, thus increasing the winter balance at South Cascade Glacier. During warm PDO periods, conditions in the northeast Pacific steer the winter storms into Alaska, increasing the winter balance at Wolverine. The correlations for Wolverine Glacier with the PDO for the period 1989–2004 have become very weak, while the correlations for South Cascade Glacier remain strong. The winter balance of continental Gulkana Glacier did not correlate with the PDO, a result of the mountain ranges to the south blocking incoming precipitation
Coefficient of correlation between the winter balances of South Cascade and Wolverine Glaciers and the winter-averaged PDO (December–March), for the entire period of the mass-balance record and the periods 1966–88 and 1989–2004
Previous research has shown that winter balance fluctuations of maritime glaciers dominate the net balance fluctuations (Reference Hodge, Trabant, Krimmel, Heinrichs, March and JosbergerHodge and others, 1998). As summer balances of the benchmark glaciers have become more negative during recent years, a result of warmer, drier summers, summer balance has taken on a greater role in determining glacier net balance. For 1998, 2001, 2003, 2004 and 2005, the entire winter snow accumulation was completely melted from South Cascade Glacier. Furthermore, preliminary results for 2005 show that the 2005 summer balance is likely to be the most negative on record. The combined impact of warmer drier summers and less snow on the lower portion of the glacier has resulted in some of the most negative net balances on record.
Summary
More than 40 years of net and seasonal mass-balance measurements by the USGS for South Cascade, Wolverine and Gulkana Glaciers show annual and interannual fluctuations that reflect the controlling climatic conditions. Overall trends in net balance of all three glaciers since the start of monitoring have been negative, and since 1988 net balance of the three has trended almost exclusively negatively.
Increasingly negative summer balance at all three glaciers, accompanied by increasing annual mass turnover, indicates that the intensity of the hydrologic cycle governing the glaciers has increased in response to climate change (Reference Bosilovich, Schubert and WalkerBosilovich and others 2005). Although trends in winter balance have not yet been detected, summer balances have been responding to warmer melt-season temperatures or increased melt-season duration. Finally, the decrease in correlations between the winter balances at Wolverine Glacier and the PDO suggests that a decoupling of PDO from winter balance may be occurring, which could be a sign that the former is being overwhelmed by general warming.
Acknowledgements
We gratefully acknowledge all of the individuals whose dedication has made this unique and invaluable record possible. We particularly acknowledge R. Krimmel and D. Trabant not only for their dedication, but also for their mentorship on carrying out a mass-balance program. We also thank A. Rasmussen for his stimulating discussions on glacier mass balance and its interpretation.



