


Introduction
Sea ice provides several habitats that support at times rich and varied biological assemblages (reviewed by Reference Palmisano, Garrison and FriedmannPalmisano and Garrison, 1993; Reference Ackley and SullivanAckley and Sullivan, 1994). Since the early 1980s, efforts to investigate the biology of sea ice have intensified, and much of the work has focused on the composition, physiology and ecology of the algae that dominate the sea-ice assemblages. There is also a substantial literature on the heterotrophic activity and composition of the microbial network within sea ice (Reference Helmke and WeylandHelmke and Weyland, 1995; Reference Grossmann, Lochte and ScharekGrossmann and others, 1996; and citations therein). Increasingly, studies have concentrated on the physical and chemical limits constraining the biology and how in turn the organisms influence the nature of the ice matrix in which they are contained. High rates of inorganic nutrient remineralization have been measured, or at least implied from measurements of inorganic nitrogen and phosphorus within closed ice. Several studies have endeavoured to relate bacterial activity to algal standing stocks or more directly to primary production taking place within the ice. However, it is surprising that very few studies have been conducted into the link between these two components by measuring the production and fate of dissolved organic matter (DOM). It has long been speculated that levels of DOM must be high within the ice (Reference Grossmann and DieckmannGrossmann and Dieckmann, 1994; Reference Grossmann, Lochte and ScharekGrossmann and others, 1996; Reference Gunther, Gleitz and DieckmannGunther and others, 1999), although very few measurements have actually been made to qualify this (Reference Melnikov and PavlovMel’nikov and Pavlov, 1978; Reference ApollonioApollonio, 1980; Reference Bunch and HarlandBunch and Harland, 1990; Reference Thomas, Lara, Eicken, Kattner and SkoogThomas and others, 1995, Reference Thomas, Lizotte and Arrigo1998, Reference Thomas, Kennedy, Kattner, Gerdes, Gough and Dieckmann2001; Reference Smith, Gosselin, Kudoh, Robineau and TaguchiSmith and others, 1997). By default even less work has been conducted into the characterization of the DOM, even in the broadest sense. However, recently Reference Amon, Fitznar and BennerAnion and others (2001) have shown a large contribution of neutral sugar and amino acid carbon to total dissolved organic carbon (DOC) in DOM extracted from multi-year Arctic ice. They conclude that this material was freshly produced and of algal origin.
Sources of DOM within sea ice are, as in the open water, excretion of organic matter from all of the biology and release of organic matter on organism death and cell lysis. DOM concentrations can be enhanced by mechanical damage due to the dynamic nature of the brine channel system with changing temperatures (Reference EickenEicken, 1992; Reference Weissenberger, Dieckmann, Gradinger and SpindlerWeissenberger and others, 1992; and citations therein). Of course, during sea-ice formation DOM is also incorporated into the ice matrix from the sea water itself (Reference HaasHaas and others, 1999; Reference Giannelli, Thomas, Kennedy, Kattner, Dieckmann and HaasGiannelli and others, 2001).
C. Krembs and others (unpublished information, 2000) have shown that sea-ice diatoms release substantial quantities of exopolymeric substances (EPSs) that can alter brine pore structure around diatoms and protect them from ice crystal damage during freezing. These substances can also interconnect pores and may significantly affect the hysteresis of brine pore space and the permeability for solutes and microorganisms. Other ice-active organic substances released by ice diatoms that roughen ice surfaces are proposed to promote binding sites for attached species, or increase light scattering (Reference Raymond, Sullivan and DeVriesRaymond and others, 1994).
The magnitude and quality of DOM within the sea-ice matrix is not just of significance to the sea-ice microbial network, but also to the biology at the ice/water interface. Sea ice can act as a source of DOM to the underlying sea water, supporting heterotrophic activity at the ice/water interface and surface waters. Studies by Reference Krembs and EngelKrembs and Engel (2001) have shown that ice-locked EPSs are important for the microbiology at the ice/water interface of melting first-year sea ice in the Arctic. Reference Kahler, Bjornsen, Lochte and AntiaKähler and others (1997) measured variable DOM concentrations in waters underlying sea ice or those influenced by ice melt. They measured at times highly enriched DOC and dissolved organic nitrogen (DON) concentrations, implying that DOM was being released from the ice. This DOM can support bacterial growth, and in experiments Reference Kahler, Bjornsen, Lochte and AntiaKähler and others (1997) measured the highest bacteria growth rates in DOC-rich melted sea ice as compared to growth rates measured in surface or deep-water samples. The labile nature of the DOM released from the sea ice was investigated, with 40−60% of the DOC, in excess of deep-water concentrations, being found to be available for bacteria growth.
Reference Giesenhagen, Detma, de Wall, Weber, Gradinger and JochemGiesenhagen and others (1999) also report that DOM released from ice serves as an important input for bacterio-plankton. They found that much of this DOM was in a form that was directly taken up by bacteria (e.g. sugars and amino acids), and that the additional dissolved degradable material lowered the turnover of the hydrolysable pool. No similar stimulation was noticed for the nano- and microalgae, although Reference Brandini and BaumannBrandini and Baumann (1997) showed that DOM released from sea ice may significantly enhance algal growth in surface waters. Likewise, Reference Kuosa, Norrman, Kivi and BrandiniKuosa and others (1992) conclude that DOC from melting ice may be influential during the seeding of sea-ice microbial communities in the water column.
Here we present a compilation of information about the DOC and DON from sea ice that had lasted at least one summer in the Weddell, Bellingshausen and Amundsen Seas, Antarctica. The porous nature of ice in late austral summer or early autumn, coupled with the non-limiting light conditions, means that this is a time when biological activity within the ice will be at a maximum. Subsequently it can be predicted that the production of DOM within the ice will be high, thus playing an important role in the ice biogeochemical cycles.
Methods
During the ANT 10/3 expedition of RV polarstern (April-May 1992; Fig. 1) samples of sea-ice brine were collected from ice floes in the closed pack ice of the southeastern Weddell Sea (see Reference Gleitz and ThomasGleitz and Thomas, 1993; Reference Gleitz, van der Loeff, Thomas, Dieckmann and MilleroGleitz and others, 1995). Therefore surface snow and short cores (30−40 cm) were removed from the top of the floe. The core holes were covered, and after time-spans of minutes up to about lhour enough brine had accumulated in the "sack hole" for subsequent analysis. Back on board ship the brines were filtered through precombusted (450°C, 4 h) GF/F filters, the filter being retained for chlorophyll a (Chla) analysis, and the filtrate acidified and stored in precombusted glass ampoules for later DOC analyses.
Regions covered on campaigns during which ice samples for dom were taken.

In January-February 1994 (ANT 11/3; Fig. 1) ice cores were sampled in the Bellingshausen and Amundsen Seas in areas of dense pack ice (ice cover 10/10). The second- or multi-year ice floes, 1−4 m thick, were 10−1000 m in diameter (Reference Haas, Rebhan, Thomas, Viehoff, Miller and GrobeHaas and others, 1996).
In January-March 1997 (ANT 14/3; Fig. 1) sea-ice cores were collected within the inner pack ice of the southeastern Weddell Sea during a first sampling campaign. The ice concentration was >9/10 and typical floe sizes were 100−500 m. A second period of sampling took place along a transect across the Weddell Sea to a northwesternmost position (66°08’S, 56°09’W) and back again to the southeast. During this time the floes had diameters of < 100 m, with ice covers <5/10 (Reference Haas, Thomas, Steffens, Bareiss, Jokat and OerterHaas and others, 1998).
During the 1994 and 1997 campaigns 10 and 29 ice cores, respectively, were collected with a titanium ice-corer (9 cm internal diameter). During coring and subsequent handling, care was taken not to contaminate the ice. Immediately after coring, the cores were divided into 10 cm sections with a clean stainless-steel saw, and these were put into 1L opaque PVC containers.
On board ship the ice sections were melted in the containers at 4°C in the dark. This process took no longer than 24 h. Due to the porous nature of the ice, the melting periods were often considerably faster. There has been concern that this melting process may lead to elevated concentrations of nutrients and DOC in the meltwater following osmotic shock to organisms and release of internal pools during the rapid changes in salinity (Reference Garrison and BuckGarrison and Buck, 1986). However, this is not the case in ice samples dominated by diatoms (Reference Thomas, Lizotte and ArrigoThomas and others, 1998), as were the samples presented here, determined after microscopic analyses.
Salinities of melted core sections were measured at room temperature with a conductivity salinometer (WTW, Weilheim, Germany), and then subsamples were filtered through precombusted GF/F filters. Samples for Chla were collected on filters and stored frozen until analysis in the home laboratories. Filtrates were poisoned with HgCl2 and stored at 4°C in 50 mL polyethylene bottles for DON analyses. Additional filtrate was stored frozen below −25°C (unpoisoned) in 50 mL precombusted glass ampoules for DOC determination.
In 1997, before filtration, 20 mL subsamples were taken and fixed (0.4% formaldehyde, final concentration, stored at 4°C). Bacterial cell concentrations were determined using epifluorescence microscopy of DAPI stained samples (Reference Porter and FeigPorter and Feig, 1980).
Chla was determined using aTurner fluorometer (Reference Evans, O’Reilly and ThomasEvans and others, 1987), after extraction overnight in the dark at 4°C. DON was analyzed following persulphate wet oxidation followed by standard autoanalyzer methods (Reference Kattner and BeckerKattner and Becker, 1991), and DOC by high-temperature oxidation using an MQ1001 TOG Analyser (Reference Qian and MopperQian and Mopper, 1996), and for 50% of the 1994 samples a Shimadzu 5000 TOG Analyser.
Total dissolved carbohydrates (TCHO) were measured on some of the 1994 samples using the L-tryptophan/sulphuric acid method on a Technicon Autoanalyser (Reference Eberlein and HammerEberlein and Hammer, 1980). The sum of mono- and hydrolysable oligo- and polysaccharides is determined by this method. All samples were analyzed in duplicate with four glucose and three nitrate standards at the beginning and end of each run.
Results and Discussion
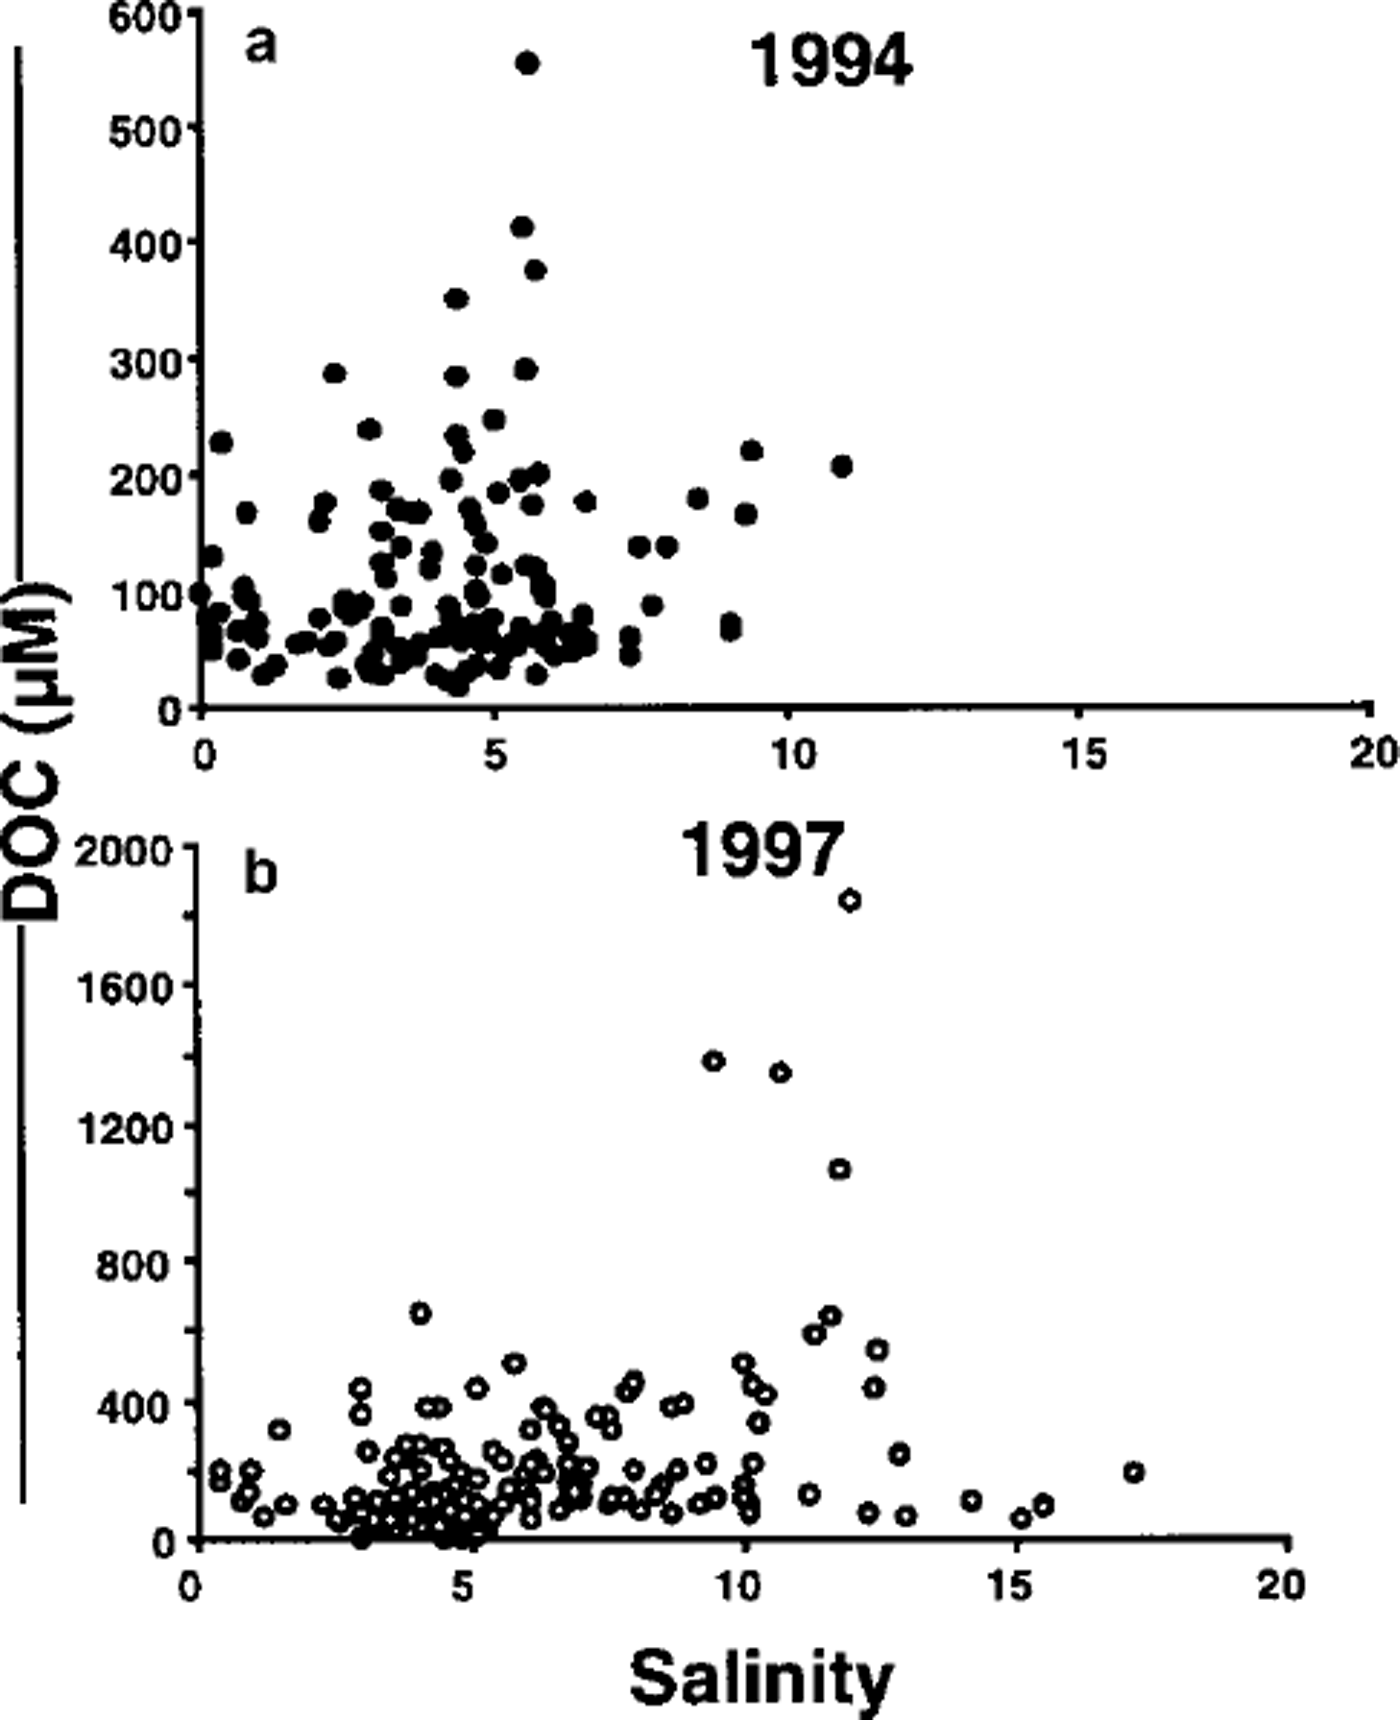
This extensive study of DOM in sea ice included samples from diverse ice types in different regions of the Southern Ocean during summer and early autumn, and levels of DOM in sea ice were clearly enriched (Table 1; Figs 2−4). It should be stressed that the 1992 directly sampled brines were from cold, autumn first-year ice, while the 1994 and 1997 samples were mainly collected from warm second-year ice. Clearly the biological activity within the ice and physicochemical histories of the ice will be quite different for the ice collected in different seasons.
The relationship between doc and the bulk salinity of melted ice-core sections collected (a) in 1994 in the amundsen and bellingshausen seas (n = 132) and (b) in 1997 in the weddell sea (n = 159). note the different scales for doc between 1994 and 1997 datasets.
The relationship between doc and chla in melted ice-core sections collected (a) in 1994 in the amundsen and bellingshausen seas (n = 132) and (b) in 1997 in the weddell sea (n = 159). note the different scales for doc and chla between 1994 and 1997 datasets.

The relationship between doc and dom in melted ice-core sections collected in the weddell sea in 1997 (n = 157). linear regression analysis of the data gives the following relationship^ = 12× −16.7; r2 = 0.44,p < 0.001.

The salinity, chla, doc and dom content of melted sea-ice core sections collected by standard ice-coring techniques and of sea-ice brines collected by sack-hole sampling

The ice in 1997 was generally more porous than in 1994, indicated by the higher ice bulk salinities, up to 17.2 in 1997 compared with 11.4 for 1994 (Fig. 2; Table 1). This is also apparent from the estimated brine volumes which were up to 38% higher in 1997 compared to 1994 (Table 1). It should be stressed that these calculated brine volumes are only estimates since temperatures of individual samples were not measured. They have been calculated assuming that the ice was isothermal at −1.8°C. Equations of Reference Cox and WeeksCox and Weeks (1983) with coefficients given by Leppäranta and Manninen (unpublished) for warm ice were used to calculate the brine volumes. The high brine volumes (up to 487 ppt) clearly indicate the highly porous nature of the late-summer ice sampled in both 1994 and 1997 (mean values 117 and 172 ppt, respectively), and therefore the possibility of dilution of measured brine concentrations of DOM by exchange with sea water.
Concentrations of DOC in ice-core segments sampled in 1994 and 1997 (Fig. 2) were up to 30 times greater than the typical maximum values for Antarctic surface water which are 40−60 ^MC (Reference Kahler, Bjornsen, Lochte and AntiaKähler and others, 1997; Reference Wedborg, Hoppema and SkoogWedborg and others, 1998). At one station values of 180 μM C were recorded in waters associated with sea ice (Reference Kahler, Bjornsen, Lochte and AntiaKähler and others, 1997), and there is a unique report of values up to 700 μ M C in the Polar Front Zone (Reference DafnerDafner, 1992). Likewise the sea-ice samples in 1997 were enriched in DON, with measurements up to 8 times those of typical surface waters values, which are 3−10 μ MN (Reference Lara, Kattner, Senesi and MianoLara and Kattner, 1994; Reference Kahler, Bjornsen, Lochte and AntiaKähler and others, 1997).
The mean and maximum DOC concentrations were considerably higher in the 1997 samples, while minimum concentrations were lowest in 1997 compared to 1994 values. The highest DOC concentrations were found at different salinities in 1994 and 1997. In 1994 the highest DOC was measured at a salinity of 5.6 (calculated brine volume 153 ppt), a less porous ice than in 1997 when the highest DOC concentrations were found at salinities of 9.5−12 (respective calculated brine volumes 262−334 ppt).
Mean Chla concentrations for both the 1994 and 1997 campaigns were similar, whereas the mean DOC concentrations in 1997 were twice those measured in 1994 (Table 1; Fig. 3). In 1997 the highest DOC values were associated with the greater Chla values, although even for these high-biomass samples relatively low DOC values were also recorded. In 1994 the highest DOC values were not associated with the higher Chla ice samples (Fig. 3). An obvious poor correlation between Chla and DOC does caution against concluding that the DOC originates mainly from ice algae, or at least healthy algae. This contrasts with the findings of Reference Smith, Gosselin, Kudoh, Robineau and TaguchiSmith and others (1997) who conclude that DOC in the bottom ice of annual sea ice in northern Japan and the Canadian high Arctic is strongly correlated with Chla, and hence is algal-derived. However, as has been stated before, the sources of DOM within the ice are many and varied. The DOM sampled may have been concentrated by physical rather than biological processes or may be a legacy of previous biological activity where Chla has degraded but DOC has not been affected. This is reflected in samples having DOC values up to 500 μm C with Chla concentrations close to zero (Fig. 3).
The brines collected by sack-hole sampling in 1992 contained high DOC values (Table 1) with a mean value of >320 μm, even though these brine samples had much lower Chla concentrations than the bulk melted ice cores (Table 1). The minimum DOC value in the brines was also >130 μm higher than the minimum in the other ice samples. To further understand the differences between the melted ice-core samples and the limited directly sampled brines, it is useful to consider the estimates of DOC and DON concentrations in the brine, based on the calculated brine volumes for the bulk ice samples (Table 1). It is valid to do this because conservative enrichment of diatom-derived DOM in sea-ice brines similar to that for inorganic nutrients during freezing has been demonstrated by Reference HaasHaas and others (1999) and Reference Giannelli, Thomas, Kennedy, Kattner, Dieckmann and HaasGiannelli and others (2001).
Estimated brine concentrations were mean values of DOC of 1.8 and 1.5 mM for 1994 and 1997 with maximum values reaching 23.3 and 18.5 mM, and mean DON values of 0.15 mM and maximum of 2.2 mM in 1997 (Table 1). These are very much greater than in the directly sampled brines from 1992, a better reflection of the obvious differences in biology. However, it is realized that sack-hole sampling does not realistically sample the particulate phase which is mostly attached to the ice matrix and will be underestimated in the sampled brines.
These calculated concentrations of DOC and DON, together with the directly sampled high DOC concentrations in the sack-hole brines, clearly indicate that sea-ice brines are enriched in DOM to a degree not even speculated before. Such high concentrations of DOM within sea-ice brines have profound implications for future work on the microbiology and biogeochemistry of sea ice, and the interpretation of previous works where estimates of DOM within sea ice have only been speculated. These findings are timely and coincide with the complementary work of C. Krembs and others (unpublished information, 2000) who have combined measurements of organic polymers in sea ice with new microscopic techniques (Reference Junge, Krembs, Deming, Stierle and EickenJunge and others, 2001) to investigate bacteria and algae within sea ice. They have clearly shown that substantial amounts of polymers are released into the brine channel system, and they even speculate that brine viscosity may be increased to such a degree that brine transport within sea ice may be altered.
Although not shown, the relationships between DON and Chla as well as salinity showed similar scattering to DOC, which is the result of a close correlation (p < 0.001) between DOC and DON (Fig. 4). Despite the correlation, there was still a large range of DOC/DON ratios. Especially in the samples with DOC values >800μMC the DOM was highly carbon-enriched, resulting in DOC/DON ratios up to 95 (Table 1). The mean DOC/DON ratio was 11. Reference Thomas, Lara, Eicken, Kattner and SkoogThomas and others (1995) measured similar ratios within winter Arctic ice, with mean values of cores ranging from 17 ± 4 to 54 ± 41 Unlike the present study, a lack of correlation between DOC and DON in that Arctic ice led the authors to conclude that different processes, or an uncoupling of carbon and nitrogen metabolism, were determining the concentrations of DOC and DON. Bulk open-water values usually range between 10 and 25 (Reference Williams and DruffelWilliams and Druffel, 1988), although Reference Kahler, Bjornsen, Lochte and AntiaKähler and others (1997) did measure unusual DOC/DON ratios in Antarctic surface waters between 4 in deep and 8 in surface waters. Accumulation of carbon-rich DOM following algal blooms is discussed by Reference WilliamsWilliams (1995) who attributes accumulation of carbon to inorganic nitrogen limitation. However, in the ice, high algal biomass similar to that reported here is often associated with little or no dissolved inorganic nitrogen depletion (Reference Thomas, Lizotte and ArrigoThomas and others, 1998, and citations therein). In addition, Reference Thomas, Kennedy, Kattner, Gerdes, Gough and DieckmannThomas and others (2001) report DOC/DON ratios of 8 (range 2−20) in platelet ice and 21 in open water (range 15−27) where the ice habitat was more reduced in dissolved inorganic nitrogen than the open water.
In the same way that Chla concentrations were not tightly coupled with DOC and DON concentrations, as might be expected if autotrophic production was a significant source of DOC, bacterial abundance was not correlated with DOC or DON concentrations in the 1997 samples (Fig. 5). The bacterial numbers above 1 × 10¹⁰ cells L−1 are high for sea ice and similar to those recorded by Reference Grossmann, Lochte and ScharekGrossmann and others (1996), which were some of the highest recorded in sea ice. It is reasonable to speculate that these very high bacterial cell concentrations were a result of the high DOM loading in the ice. However, the relationship between DOM and bacteria is not straightforward. The sampling strategy employed only allows for a snapshot of the conditions and does not allow an historical development of the biological and chemical interactions to be deduced. More systematic investigations, similar to those of Reference Kahler, Bjornsen, Lochte and AntiaKähler and others (1997) for open waters, that couple measurements of bacterial activity with characterization of DOM are called for, together with time course measurements within closely defined ice habitats. These rate measurements must be made in conjunction with investigations into autotrophic production if the link between DOM production and heterotrophic activity is to be made (cfReference Grossmann and DieckmannGrossmann and Dieckmann, 1994; Reference Gleitz, Grossmann, Scharek and SmetacekGleitz and others, 1996; Reference Grossmann, Lochte and ScharekGrossmann and others, 1996).
The relationships of dom (a) and doc (b) with bacteria concentration in melted ice-core sections collected in the weddell sea, 1997.

There was a significant correlation (p < 0.001) between the TCHO concentrations and DOC in the 1994 samples (Fig. 6). The mean percentage contribution of TCHO to the DOC carbon pool was 36% ± 23 (range 1−99%). As with DOC, there was no obvious trend of TCHO with either salinity or Chla in the ice. The mean percentage total carbohydrate content of DOC falls well within the range 10−46% measured by Reference Pakulski and BennerPakulski and Benner (1994) in a range of oceanic waters.
Relationship between the total carbohydrate concentration and doc in melted ice-core sections collected in the amundsen and bellingshausen seas, 1994 ( n = 56). linear regression analysis of the data gives the following relationship^ = 0.61× - 21.8; r2 = 0.71,p < 0.001.

The composition of the DOM in the ice should reflect the composition of the dominant organisms, although this will be masked by the release of extracellular products such as polysaccharides and ice-active substances (Reference Raymond, Sullivan and DeVriesRaymond and others, 1994; Krembs and others, 2000). Numerous studies have investigated the chemical composition of sea-ice algae (Reference Thomas and GleitzThomas and Gleitz, 1993, and citations therein), and high allocation of photoassimilated carbon into the lipid (>70%) and polysaccharide (>60%) fractions of cells has been measured. Reference Thomas and GleitzThomas and Gleitz (1993) investigated two common ice algae under various temperature and salinity regimes and found typical distributions of carbon as follows: polysaccharides 11−49%, low molecular weight compounds 30−60%, lipids 7−23% and proteins 12−30%. In particular, as a response to increased salinities in sea ice, enhanced production of intracellular organic osmolytes such as amino acids (e.g. proline) or small carbohydrates (e.g. mannitol) are to be expected. The nature of DOM produced within sea ice is therefore going to be highly variable, and highly dependent on the extremes in the physical and chemical nature of the ice. This is likely to confer on DOM produced within ice a rather different chemistry to that in open waters. This is one reason why simple extrapolation of heterotrophic microbial processes in polar seas to sea ice is flawed since the nature of the DOM in the two systems is dissimilar.
An intriguing question that arises when considering DOM in ice is the extent to which photochemical processes alter the lability of DOM. Photoxidation of high-molecular-weight DOM to form biologically labile organic products in open waters is an important feature of organic matter cycling (Reference Mopper, Zhou, Kieber, Kieber, Sikorski and JonesMopper and others, 1991; Reference Herndl, Muller-Niklas and FrickHerndl and others, 1993). The importance of the different photoreactivities of DOC and DON has been highlighted by Reference Bertilsson, Stepanauskas, Cuadros-Hansson, Graneli, Wikner and TranvikBertilsson and others (1999). Ultraviolet (UV) light does penetrate sea ice (Reference PerovichPerovich, 1993, and citations therein), and reliable evidence of UV-B-induced damage to under-ice algal communities is reported (Reference Prézelin, Moline, Matlick, Lizotte and ArrigoPrézelin and others, 1998). Although UV transmission is greatly attenuated by snow cover, it is likely that at certain times of the year photochemical processes will induce changes in the carbon and nitrogen pools within the ice. This is particularly true in late summer, when snow is thin and superimposed ice may attenuate UV-B only poorly.
The nature of DOM in the ice is clearly highly diverse, as indicated by the large range in DOC/DON ratios and the changing carbohydrate contribution to the DOC pool. This variability points to more systematic studies being called for since our understanding of the nature of the DOM is probably the key to understanding the dynamics of carbon and nitrogen cycling within sea ice, and therefore the role of sea ice in the overall biogeochemical cycling of Polar Oceans. To this end, bacterial growth experiments linked to concurrent analyses of the chemical composition of DOM, such as those of Reference Amon, Fitznar and BennerAmon and others (2001), are called for. If we are to comprehend the complexity of biogeochemical cycles with sea ice, it is imperative that the next generation of investigations are truly multidisciplinary, fully integrating the biology and chemistry together with the physics of sea ice.
Acknowledgements
We would like to thank the captain and crew of RV polarstern and the pilots and crew of the wasserthal helicopter service. We thank M. Stürcken-Rodewald and C. Harms of the Alfred Wegener Institute, Bremerhaven, and C. Castellani, A. Ross and T. Bentley of the University of Wales, Bangor, for excellent technical assistance. The work was partially funded by the Natural Environment Research Council (GT9/2894, GR9/ 3309), British Council/Deutscher Akademischer Austauschdienst (Academic Research Collaboration Programme) and the Nuffield Foundation.



