Cows’ milk contains a number of different phyto-oestrogens (Hoikkala et al. Reference Hoikkala, Mustonen, Saastamoinen, Jokela, Taponen, Saloniemi and Wahala2007; Steinshamn et al. Reference Steinshamn, Purup, Thuen and Hansen-Moller2008; Andersen et al. Reference Andersen, Nielsen, Purup, Kristensen, Eriksen, Søegaard, Sørensen and Fretté2009) but there is a large variability in milk phyto-oestrogen concentration depending on the type and amount of legumes included in the cows’ feed. When fresh or ensiled forage containing especially red clover constitutes a large proportion of the roughage, the isoflavone metabolite equol is by far the most abundant phyto-oestrogen in milk (up to 1000 ng/ml) (Antignac et al. Reference Antignac, Cariou, Bizec and Andre2004; Hoikkala et al. Reference Hoikkala, Mustonen, Saastamoinen, Jokela, Taponen, Saloniemi and Wahala2007; Andersen et al. Reference Andersen, Weisbjerg, Hansen-Møller and Sejrsen2008, Reference Andersen, Nielsen, Purup, Kristensen, Eriksen, Søegaard, Sørensen and Fretté2009; Steinshamn et al. Reference Steinshamn, Purup, Thuen and Hansen-Moller2008; Mustonen et al. Reference Mustonen, Tuori, Saastamoinen, Taponen, Wahala, Saloniemi and Vanhatalo2009; Nielsen et al. Reference Nielsen, Norgaard, Purup, Frette and Bonefeld-Jorgensen2009). This is due to the fact that red clover contains considerable amounts of the isoflavone formononetin (Wu et al. Reference Wu, Wang and Simon2003; Sivesind & Seguin, Reference Sivesind and Seguin2005) that is metabolized by microorganisms in the rumen to produce equol. In contrast, the mammalian lignan enterolactone pre-dominates in milk (96 ng/ml) when maize silage is the major roughage (Andersen et al. Reference Andersen, Weisbjerg, Hansen-Møller and Sejrsen2008), but enterolactone never reaches the level of equol in milk following clover feeding (Steinshamn et al. Reference Steinshamn, Purup, Thuen and Hansen-Moller2008; Andersen et al. Reference Andersen, Nielsen, Purup, Kristensen, Eriksen, Søegaard, Sørensen and Fretté2009; Mustonen et al. Reference Mustonen, Tuori, Saastamoinen, Taponen, Wahala, Saloniemi and Vanhatalo2009).
Through their structural and functional similarities with mammalian oestrogens, phyto-oestrogens have potential to exert oestrogenic and anti-oestrogenic effects partly by interaction with the oestrogen receptors (ERs) of cells (Committee on Toxicity, 2003). It is generally accepted that oestrogens play an important role in the aetiology of both breast- and prostate cancer (Kelsey et al. Reference Kelsey, Gammon and John1993; Prins & Korach, Reference Prins and Korach2008) and therefore the interest in dietary phyto-oestrogens with potential oestrogenic/anti-oestrogenic effects has increased substantially during recent years. Although phyto-oestrogens exhibit much weaker oestrogenic activity compared with endogenous oestradiol, the phyto-oestrogen content in plasma following intake of phyto-oestrogen-rich foods can be considerably higher than that of endogenous oestrogens. Therefore it raises the question whether milk that has been shown to contain up to 1·2 mg phyto-oestrogen per litre (Nielsen et al. Reference Nielsen, Norgaard, Purup, Frette and Bonefeld-Jorgensen2009) may exert biological effects in consumers. A few studies have screened the oestrogenic effects of milk in in-vitro assays that allow for evaluation of the combined effects of the various phyto-oestrogens. Nielsen et al. (Reference Nielsen, Norgaard, Purup, Frette and Bonefeld-Jorgensen2009) found that extracts of milk with a high content of equol showed significant indirect oestrogenic activity by activating the ER in a reporter gene assay with human breast cancer cells (MVLN cells), whereas extracts of commercial milk in another study only resulted in minor activation of the ER in T47D.luc cells (Dip et al. Reference Dip, Lenz, Antignac, Le Bizec, Gmuender and Naegeli2008).
The objective of the present study was to screen milk (whey) from cows fed three different roughages, resulting in different milk phyto-oestrogen contents in proliferative assays with the human cancer cell lines MCF-7 and PC-3. These cell lines represent two hormone sensitive cancers: mammary and prostate cancer, respectively. MCF-7 mammary epithelial cells express both ERα and ERβ (Grunfeld & Bonefeld-Jorgensen, Reference Grunfeld and Bonefeld-Jorgensen2004) and they have been applied in screening oestrogenic activity of single compounds but also complex biological matrices such as human serum samples (Gutendorf & Westendorf, Reference Gutendorf and Westendorf2001; Rasmussen et al. Reference Rasmussen, Nielsen, Andersen, Nielsen, Weihe and Grandjean2003). They proliferate in response to oestrogens or oestrogen-like stimulation and if cultured in the presence of oestradiol, a potential anti-oestrogenic effect of the compound or sample of interest can be tested. PC-3 cells also express both ERs (Lau et al. Reference Lau, LaSpina, Long and Ho2000) and physiologically relevant concentrations of purified equol, genistein and daidzein have been shown to inhibit PC-3 growth (Mitchell et al. Reference Mitchell, Duthie and Collins2000; Hedlund et al. Reference Hedlund, Johannes and Miller2003). Since these phyto-oestrogens are all present in cows’ milk, PC-3 cells were also considered relevant to apply in testing the proliferative effects of milk varying in phyto-oestrogen content.
Materials and Methods
Cow feeding and milk samples
Milk samples were obtained from a feeding trial carried out at The Swedish University of Agricultural Sciences, Umeå. Fifteen multiparous Swedish Red cows (mean initial days in milk, DIM, 130±32) were blocked according to milk yield and DIM and randomly allocated to three dietary treatments in a Latin square cross-over experimental design. All cows were fed silage ad libitum and 6 kg concentrate/d (35% barley, 41·8% rape seed cake, 20% pea, 1% cane molasses and 2·2% vitamin and mineral mix) fed separately in feeders. Cows were kept in a loose-housing barn and were milked twice a day at 6.00 and 16.00. Silage treatments and the botanical composition (% dry matter, DM) of silages were; R1, red clover (41%, Trifolium pratense L.), timothy (26%, Phleum pratense L.) and meadow fescue (23%, Festuca pratensis Huds.); R2, red clover (38%), timothy (27%) and meadow fescue (26%) and B1, birdsfoot trefoil (16%, Lotus corniculatus L.) and timothy (66%). After 3 weeks, milk samples from individual cows were obtained from four consecutive milkings and cows were switched to one of the other feed rations. Milk was kept at −20°C until processed to whey.
Whey preparation and milk analysis
Milk contains large amounts of fat and casein that cause unfavourable culture conditions for cells in vitro and therefore the proliferative activity of milk was assessed using whey from which fat and casein had been removed. Milk was centrifuged at 3500 g at 4°C for 20 min and skim milk aspirated. The skim milk was titrated with 5 m-acetic acid to precipitation at pH 4·2, then centrifuged at 9000 g for 30 min at 4°C. The acidic whey was then neutralized with 3 m-NaOH and 1 m-NaOH to pH 7·4 and centrifuged again at 9000 g for 30 min at 4°C. The neutralized acidified whey was frozen at −20°C for use in the in-vitro assay.
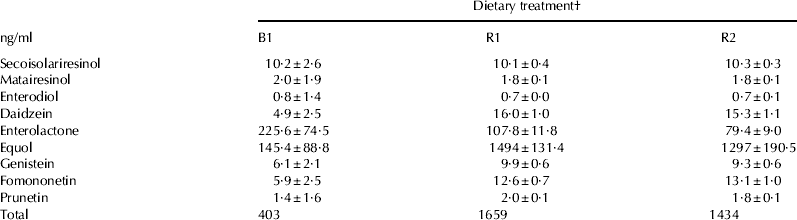
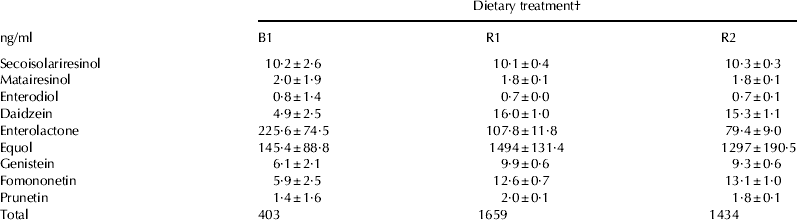
The concentration of various phyto-oestrogens in whole milk samples from individual cows was measured according to the method described in Steinshamn et al. (Reference Steinshamn, Purup, Thuen and Hansen-Moller2008) and is shown in Table 1. Phyto-oestrogens in milk occur almost entirely as biologically inactive glucoronide and sulphate conjugates (King et al. Reference King, Mano and Head1998), which makes them predominantly water soluble and phyto-oestrogens in milk has been reported to be independent of milk fat content (Antignac et al. Reference Antignac, Cariou, Bizec and Andre2004). On this basis we assume that the phyto-oestrogen profile and level in whole milk is well reflected in the whey fraction of milk.
Concentration of phyto-oestrogens (conjugated+free) measured in milk from the three dietary treatments (B1, R1 and R2; see text for details). Results (n=15 per treatment) are means adjusted for the recovery percentages of three independent extractions of milk ±sem
† See text for details
Cell lines, cultivation and treatments
The proliferative effect of whey samples was screened in a human mammary epithelial cancer cell line, MCF-7 BUS, which was a gift from Professor Eva C. Bonefeld-Jørgensen, Aarhus University, and in a human prostate epithelial cancer cell line PC-3 (Deutsche Sammlung von Microorganismen und Zellkulturen GmbH, DSMZ, Braunschweig, Germany).
MCF-7 cells were cultivated in Dulbecco Modified Eagle Medium (DMEM) containing 1000 mg/l d-glucose and 110 mg/l sodium pyruvate and supplemented with 15 mm-HEPES, 4 mm-glutamax (Invitrogen A/S, Tåstrup, Denmark), 6·4 mg/100 ml gentamicin (Sigma-Aldrich, Brøndby, Denmark) and 10% heat-inactivated fetal calf serum (FCS; Invitrogen). Cells were grown in 75-cm3 flasks and incubated at 37°C under a 5% CO2 atmosphere.
For experiments, cells were seeded in 96-well plates at a density of 1500 cells/well in medium containing 10% dextran-coated charcoal treated fetal calf serum (FCS) (DCC-FCS) (VWR-Bie & Berntsen A/S, Herlev, Denmark) (0·1 ml medium/well). After 24 h, 0·1 ml of medium containing twice the desired whey concentration (due to the 1:1 dilution of whey) was added to the wells.
Whey obtained from milk was tested in concentrations of 1·25, 2·5, 5 and 10% of the cell culture media in triplicate wells. A medium with 20% whey was sterile-filtrated (0·2 μm mesh) and used for preparation of the other whey concentrations. The effect of whey was screened in the absence and presence of 17-β oestradiol (E2, Sigma-Aldrich) in the medium in order to test both oestrogenic and anti-oestrogenic properties. A growth curve with E2 ranging from 0·1 pm to 50 μm was performed to determine the concentration of E2 resulting in a growth stimulatory effect of approximately half the maximum response, to allow for detection of both additive and inhibitory effects of whey. E2 was dissolved in ethanol at a concentration of 10 mm before being supplemented with experimental medium. The final concentration of ethanol in the cell culture medium did not exceed 0·01% (v/v) and did not affect cell growth.
PC-3 cells were maintained in F-12K nutrient mixture, Kaighn´s modification (Invitrogen, A/S, Tåstrup, Denmark) supplemented with 10 000 units penicillin and 10 mg streptomycin/100 ml (Sigma, Brøndby, Denmark), 4 mm-glutaMAX and 10% FCS (Invitrogen A/S, Tåstrup, Denmark). For experiments, cells were seeded in 96-well plates at a density of 500 cells/well in maintenance medium (0·2 ml medium/well). After 24 h, the medium was changed to 0·1 ml of medium without FCS to starve cells before the treatment period. After an additional 24 h, 0·1 ml of medium without FCS including twice the desired whey concentration (due to the 1:1 dilution of whey) was added per well.
The effect of E2 (curve ranging from 1 pm to 50 μm) on PC-3 cells was tested in a similar assay set-up to the one in which whey samples were tested. E2 was dissolved in ethanol at a concentration of 10 mm before being supplemented with experimental medium. The response to E2 was calculated relative to the solvent control treatment containing only ethanol (cell proliferation was unaffected by ethanol).
The proliferative response to purified equol was also tested in PC-3 cells. Racemic (±)-equol (Gentaur Molecular Products, Brussels, Belgium) was dissolved in a 20:80 mixture of dimethyl sulphoxide (DMSO):ethanol and assayed in concentrations of 0·25–50 μm corresponding to 61–12 114 ng/ml (for comparison with milk contents of equol see Table 1) in triplicate wells in two independent assays in a similar assay set-up to the one used for whey samples. The response to equol was calculated relative to the solvent control treatment containing only DMSO and ethanol (cell proliferation was unaffected by DMSO:ethanol).
On day 7 for MCF-7 cells and day 5 for PC-3 cells, cell viability was determined by a resazurin metabolism assay (AlamarBlue, BioSource, AH diagnostic, Aarhus, Denmark). AlamarBlue reagents were added to wells according to the manufacturer's instructions and measured on a fluorometer after an incubation time of 6 h. The amount of fluorescence measured is proportional to the number of living cells and thereby indirectly to cell proliferation.
Statistical analysis
Data on the fluorescence (proliferation) of cells exposed to whey at different concentrations and obtained from milk following the three different feedings were analysed by two-way ANOVA with concentration and treatment and their interaction as fixed effects. There was no statistically significant (P>0·05) interaction between concentration and treatment but there was a significant effect of whey concentration added to the cell culture media for both MCF-7and PC-3 cells. However, we were not interested in estimating the concentration effect, and therefore a one-way ANOVA with treatment as fixed effect followed by Fisher's LSD test was performed separately for each of the whey concentrations tested. Effects of equol and E2 on PC-3 cells were analysed by one-way ANOVA with concentration as main effect. Results are expressed as means±sem and significance was judged at P<0·05.
Results
Milk from cows on the R1 and R2 treatments showed a high total phyto-oestrogen content (1659 and 1434 ng/ml, respectively) compared with milk from B1 fed cows (403 ng/ml) (Table 1). Equol was by far the most abundant milk phyto-oestrogen on the R1 and R2 diets constituting 90% of total phyto-oestrogens, whereas enterolactone was the most abundant milk phyto-oestrogen on the B1 diet constituting 56% of total phyto-oestrogens (Table 1).
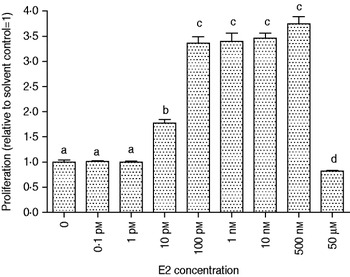
Figure 1 shows the effect of increasing concentrations of E2 on MCF-7 cell proliferation. At 100 pm to 500 nm-E2 cell proliferation was approximately 3·5-times higher than of control cells without E2, whereas 10 pm E2 induced a proliferative response close to half of the maximum E2 response in the cells (Fig. 1). Therefore 10 pm-E2 as background in the culture medium allows for detection of both additive and inhibitory effects of whey.
Proliferative response (relative fluorescence) of MCF-7 cells to increasing concentrations of 17β-oestradiol (E2). Statistically significant differences (P<0·05) are indicated with different letters (a, b, c). Mean values ±sem are shown.

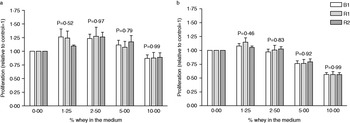
The proliferation of MCF-7 cells was affected by the concentration of whey included in the medium (P<0·001), but it was only at 2·5% whey that cell proliferation was significantly different (higher) from control cells. There was no negative effect on cell proliferation at any of the whey concentrations tested and therefore we conclude that MCF-cells tolerate whey up to 10% in the growth medium. There was no interaction between whey concentration tested and dietary treatment on the proliferation of cells, either without E2 in the media (P=0·95) or with E2 included in the media (P=0·97). There was no significant difference in the proliferative effect of whey from the different dietary treatments at any of the whey concentrations tested (P values from 0·52 to 0·99 (Fig. 2a). Inclusion of 5 and 10% whey in the medium for MCF-7 cells in the presence of 10 pm-E2 resulted in a significant (P<0·05) inhibitory (anti-proliferative) effect on cell growth (Fig. 2b). There was no difference between dietary treatments (P value from 0·46 to 0·99) at any of the whey concentrations tested and the anti-proliferative effect of whey was similar for all three dietary treatments.
Effect of whey from milk following the B1, R1 or R2 dietary treatments on the relative proliferation of MCF-7 cells, (a) without and (b) with a background of 10 pm-oestradiol (E2) in the medium. The control treatments (0% whey) in (a) and (b) cannot be compared since including E2 in the control medium in (b) results in a higher baseline proliferation than when E2 is not included in the medium (a). The P values for the treatment effect within each concentration of whey are presented. Mean values ±sem are shown.

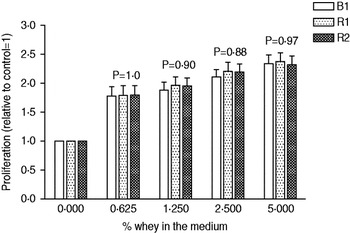
Figure 3 shows the growth of PC-3 cells in response to increasing concentrations of whey relative to control cells not exposed to whey. PC-3 cells tolerated whey well in the range of concentrations tested. There was a significant (P<0·01) stimulatory effect of whey from all dietary treatments at all concentrations tested.
Effect of whey from milk following the B1, R1 or R2 dietary treatments on the relative proliferation of PC-3 cells. P values for the treatment effect within each concentration of whey are presented. Mean values ±sem are shown.

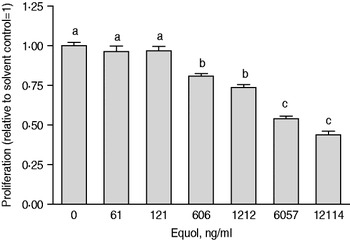
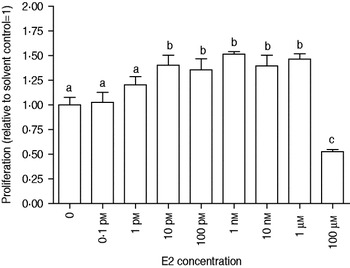
Purified equol showed a dose-dependent inhibitory effect on PC-3 cell growth and 12 114 ng equol/ml resulted in approximately 50% of the cell growth induced by the control medium without equol (Fig. 4). A growth curve for E2 in concentrations of 0·1 pm–100 μm was also performed in PC-3 cells (Fig. 5). There appeared to be a stimulatory effect of 10 pm–1 μm-E2 (approximately 35–50% higher than control) but this effect could not be separated from the solvent (ethanol) effect (data not shown). However, the inhibitory effect of 100 μm-E2 (Fig. 5) was independent of the ethanol concentration.
Proliferative response (relative fluorescence) of PC-3 cells to increasing concentrations of purified racemic equol (±). Equol concentrations are given in ng/ml to allow for comparison with the content of equol in milk (see Table 1). Statistically significant differences (P<0·05) are indicated with different letters (a, b, c). Mean values ±sem are shown.

Proliferative response (relative fluorescence) of PC-3 cells to increasing concentrations of 17β-oestradiol (E2). Statistically significant differences (P<0·05) are indicated with different letters (a, b, c). Mean values ±sem are shown.

Discussion
The content of various phyto-oestrogens in bovine milk has been reported in quite a few publications, including how dietary composition of cows affects the content (King et al. Reference King, Mano and Head1998; Antignac et al. Reference Antignac, Cariou, Le Bizec, Cravedi and Andre2003; Hoikkala et al. Reference Hoikkala, Mustonen, Saastamoinen, Jokela, Taponen, Saloniemi and Wahala2007; Andersen et al. Reference Andersen, Weisbjerg, Hansen-Møller and Sejrsen2008, Reference Andersen, Nielsen, Purup, Kristensen, Eriksen, Søegaard, Sørensen and Fretté2009; Kuhnle et al. Reference Kuhnle, Dell’ Aquila, Aspinall, Runswick, Mulligan and Bingham2008; Steinshamn et al. Reference Steinshamn, Purup, Thuen and Hansen-Moller2008; Nielsen et al. Reference Nielsen, Norgaard, Purup, Frette and Bonefeld-Jorgensen2009). To our knowledge, the 1·7 and 1·5 mg total phyto-oestrogen per litre of milk resulting from the R1 and R2 diets in the present study is the highest total concentrations of milk phyto-oestrogens reported in the literature. These high total phyto-oestrogen contents are mainly due to the high concentrations of equol (1·5 and 1·3 mg/l of milk for R1 and R2 diets, respectively), which in turn is mainly ascribed to the very high proportions of red clover (42·3 and 37·5%) in the silages used in the R1 and R2 diets. Red clover is a rich source of formononetin (0·8–11 mg/kg DM) (Booth et al. Reference Booth, Overk, Yao, Totura, Deng, Hedayat, Bolton, Pauli and Farnsworth2006; Tsao et al. Reference Tsao, Papadopoulos, Yang, Young and McRae2006), which can be converted to equol by microbes in the rumen.
The total levels of phyto-oestrogens that can be achieved in cows’ milk through specific feeding practices are relatively low compared with the 200–6500 mg/l that can be measured in soy milk and other soy-based beverages (Kano et al. Reference Kano, Takayanagi, Harada, Sawada and Ishikawa2006; Dip et al. Reference Dip, Lenz, Antignac, Le Bizec, Gmuender and Naegeli2008). However, the relatively low concentrations of phyto-oestrogens in milk do not rule out any biological effects of milk phyto-oestrogens, as previous in-vitro and in-vivo studies have already shown (Nielsen et al. Reference Nielsen, Norgaard, Purup, Frette and Bonefeld-Jorgensen2009, Reference Nielsen, Purup, Warri, Godschalk and Hilakivi-Clarke2011). Owing to the large differences in milk phyto-oestrogen content following the B1 feeding and the two red clover silage based diets (R1 and R2) in the present study, we hypothesized that there would be differences in the proliferative activity of whey in the assays applied. MCF-7 cells are dependent on oestrogen for their proliferation in culture (Dabre & Daly, Reference Dabre and Daly1989) and various phyto-oestrogens including equol have also been shown to stimulate MCF-7 cell proliferation (Matsumura et al. Reference Matsumura, Ghosh, Pope and Darbre2005) and transactivation of the ER in another human breast cancer cell line (MVLN) (Nielsen et al. Reference Nielsen, Norgaard, Purup, Frette and Bonefeld-Jorgensen2009). We found a stimulatory effect of including 2·5% whey in the medium for MCF-7 cells but saw no differences between dietary treatments, suggesting that the differences in milk phyto-oestrogen concentration could not be detected in our assay using the whey fraction of milk. In contrast, we found an anti-proliferative effect of 5% or higher concentrations of whey in MCF-7 cells since the response to 10 pm-oestradiol in addition to 5% or more whey was significantly lower than the response to the control medium including oestradiol but without whey. Again the effect was independent of the dietary treatment cows were exposed to, and therefore the anti-proliferative effect of whey was due to whey itself and therefore seems independent of the phyto-oestrogen content of milk.
Whey induced a significant proliferative response in PC-3 cells but the stimulatory effect was not affected by the dietary treatment of cows (Fig. 3). Based on the inhibitory effect of purified equol on PC-3 cell growth that we also found in the present study (Fig. 3) and as reported by others (Mitchell et al. Reference Mitchell, Duthie and Collins2000; Hedlund et al. Reference Hedlund, Johannes and Miller2003), we expected that if whey from the R1 and the R2 treatments had any effect on PC cell proliferation, it would be inhibitory. Oestrogen itself appeared to be slightly stimulatory for PC-3 cell proliferation, but the effect was confounded with that of vehicle ethanol in our studies (Fig. 5). Hedlund et al. (Reference Hedlund, Johannes and Miller2003) also reported that PC-3 cell morphology and growth was negatively affected by ethanol in concentrations as low as 0·54% (v/v). Nevertheless, E2 has been shown to inhibit PC-3 cell proliferation (Lau et al. Reference Lau, LaSpina, Long and Ho2000; Kanagaraj et al. Reference Kanagaraj, Vijayababu, Ilangovan, Senthilkumar, Venkataraman, Aruldhas and Arunakaran2007). If there was an effect on PC-3 cell proliferation of the high level of phyto-oestrogens, particularly equol, in the R1 and R2 milk and also of the endogenous oestrogens that are always present in milk, we would expect the effect to be inhibitory and not stimulatory as our results actually show (Fig. 3). Obviously this raises the question as to whether there is something else present in whey independent of dietary treatment that overrules the differences potentially caused by phyto-oestrogens, or whether there are other factors related to the assay protocols that may explain the discrepancies.
One of these factors could be the fact that phyto-oestrogens in milk occur almost entirely as biologically inactive glucuronide and sulphate conjugates (King et al. Reference King, Mano and Head1998), which makes them predominately water soluble—only the free de-conjugated phyto-oestrogens are considered biologically active and can induce effects in cells (Committee on Toxicity, 2003). In order to test any potential difference in the proliferative effect of milk with varying phyto-oestrogen content, all milk phyto-oestrogens have to be de-conjugated (hydrolysed) in the whey-preparing protocol. Under in-vivo conditions milk sulphate and glucuronide conjugates of phyto-oestrogens are expected to be hydrolysed by intestinal and microbial sulphatases and glucoronidases after ingestion before free forms are absorbed and metabolized (Rowland et al. Reference Rowland, Faughnan, Hoey, Wahala, Williamson and Cassidy2003). In the protocol we applied for preparation of whey to be tested in the cell-based models, pH was lowered to 4·2 for precipitation of casein. Whether pH 4·2 is acidic enough to ensure a complete chemical hydrolysis and de-conjugation of all phyto-oestrogens in the milk is not known. If milk phyto-oestrogens were not de-conjugated properly into biologically active free forms during the whey preparation protocol, this could explain why we did not detect any significant differences in the biological response between the milk types despite quite large differences in phyto-oestrogen content.
In summary, we found that whey, irrespective of dietary treatment of the cows from which the milk was obtained, showed an anti-proliferative effect in breast cancer cells and had a stimulatory effect on prostate cancer cell growth. The results also suggest that our assays of proliferative effects of whey in MCF-7 and PC-3 cells are not sufficiently sensitive to discriminate between milk with high or low levels of phyto-oestrogens.
The authors thank Annette K. Nielsen for her excellent technical assistance in performing the cell based assays. The project was funded by the PhytoMilk project under the European Coordination of Transnational Research in Organic Food and Farming (CORE Organic).