
I. INTRODUCTION
Supercapacitors are one of the most promising electrochemical energy-storage systems because of their ability for delivering higher power density than batteries/fuel cells and storing higher energy density than conversional electrostatic capacitors. Reference Wang, Zhang and Zhang1,Reference Huang, Liang and Chen2 Graphene has been widely used as the electrode materials of electrical double-layer capacitors, due to its unique properties such as superior electrical conductivity, excellent mechanical flexibility, larger surface area, and high thermal and chemical stability. Reference Shao, El-Kady, Wang, Zhang, Li, Wang, Mousavi and Kaner3,Reference Patil, Harle, Sathaye and Patil4 However, due to the strong π–π interactions between graphene sheets, 2D structures easily agglomerated and restacking. This drawback hinders potential applications of graphene materials in electrochemical electrodes. One method to solve this problem is to incorporate spacer such as transition metal oxides into graphene sheet to form new nanostructure. Reference Gao and Fang5–Reference Marlinda, Huang, Muhamad, An’amt, Chang, Yusoff, Harrison, Lim, Chia and Kumar9 Many transition metal oxides have been chosen as electrode materials to increase the storage performance of pseudocapacitors, such as RuO2, NiO, Fe2O3, V2O5, MoO3 and SnO2. Reference Liu, Jiao, Zhang, Qu, Umar and Wu10–Reference Wu, Zeng, Gao, Su, Liu and Zhu15 Among these candidates, molybdenum oxides are relatively cheap pseudocapacitor materials with high theoretical capacitance, and have attracted many attentions. Reference Li, Wang, Zheng, Ou and Tong13,Reference Zhou, Song, Li, Feng, Huang, Chen, Ma, Wang and Yan14,Reference Giardi, Porro, Topuria, Thompson, Pirri and Kim16–Reference Feng, Gao, Zhang, Guo and Liu19 MoO2 has been extensively investigated as an electrode material due to high theoretical capacity (838 mA h/g) and excellent electronic conductivity (>1 × 10⁴ S/cm). Reference Hu, Yin, Uchaker, Chen, Zhang, Zhou, Qi, Cao, Qi and Cao17,Reference Palanisamy, Kim, Kim, Kim and Yoon20–Reference Zhou, Liu, Liu, Xie, Wu, Huang, Tian, He, Khalil, Haleem, Xiang, Chu, Zou and Song22 Giardi et al., synthesized polycrystalline nanoparticles of MoO2 on the surface of reduced graphene oxide and improved specific capacitance of 381 F/g at a scan rate of 0.5 mV/s. Reference Giardi, Porro, Topuria, Thompson, Pirri and Kim16 Duan et al., demonstrated a novel hierarchical core–shell structure pseudocapacitor of ZnO nanorod/NiO/MoO2 nanosheet arrays on nickel foam substrate with 983 F/g at 4.16 A/g. Reference Hou, Zhang, Zeng, Zhu, Gong, Li and Duan23 Mai et al., demonstrated hierarchical nanostructured MoO2/Co(OH)2 pseudocapacitor with a high capacitance of 800 F/g at 20 A/g. Reference Hercule, Wei, Khan, Zhao, Tian and Mai24
In this work, we report a simple one-pot hydrothermal method to synthesize 3D porous graphene which were decorated with monoclinic phase MoO2 nanoparticles. For comparision, MoO2–rGO hybrid material with different mass ratio between molybdenum precursor and GO were synthesized and investigated for use as electrode material for supercapacitors. The electrochemical performances of the nanocomposites were investigated in alkaline and neutral electrolyte, respectively.
II. SYNTHESIS OF HYBIRD MATERIALS
The MoO2–rGO hybrid material was prepared by a simple one-step process as follows: typically, a solution of phosphomolybdic acid (H3PMo12O40·xH2O) (30 mL, 15 mM) was slowly added into the magnetically stirred homogeneous suspension containing GO aqueous suspension (50 mL, approximately 2 mg/mL) (the mass ratio of molybdenum precursor:GO tuned to be 10:1, 30:1, 40:1, and 50:1). The mixture were sonicated at 30–40 °C for 30 min. Hydrazine hydrate (1.25 mL) was then added under stirring and the mixture was sonicated for another 3 h. The as-obtained suspension was transferred to a 100 mL Teflon-lined stainless steel autoclave. The autoclave was then sealed and kept at 180 °C for 24 h to allow the growth of MoO2–rGO hybrid materials. As the autoclave cooled to room temperature naturally, the precipitates were separated by centrifugation, washed with H2O and absolute ethanol several times to remove surface ions and molecules, followed by being dried with freeze-drying and subsequently treated at 500 °C (ramp rate: 2 °C/min) in a N2 atmosphere for 2 h. The sample prepared with initial molybdenum precursor:GO molar ratio of 10:1, 30:1, 40:1, and 50:1 is denoted as M10G1, M30G1, M40G1, M50G1, respectively.
A. Characterization
The microscopic morphology of the products were observed with a scanning electron microscopy (SEM; Sirion 200, FEI Company, Amsterdam, The Netherlands) and high-revolution transmission electron microscopy (HRTEM; Tecnai G2TF20 S-TWIN, FEI Company) at a working voltage of 200 kV. The surface chemical properties were determined by x-ray photoelectron spectrometer (XPS; Escalab 250, Thermo Fisher Scientific, Waltham, Massachusetts). X-ray diffraction (XRD) patterns were conducted by using a Brucker D8 Advance diffraction (Bruker Corporation, Karlsruhe, Germany) with Cu Kɑ radiation. Raman spectra were given by a LabRAM HR800 from JY Horiba (Edison, New Jersey). The specific surface area and pore size distributions (PSDs) of the products were measured by nitrogen sorption test using a ASAP 2020 equipment (Micromeritics, Norcross, Georgia). Brunauer–Emmett–Teller (BET) surface area (S BET) was calculated using the N2 adsorption isotherm data within the relative pressure of 0.05–0.25. Total pore volume (V T) was obtained at p/p 0 = 0.995. Microspore volume (V micro) was determined by t-plot method. Mesopore volume (V meso) was calculated by subtracting the micropore volume from the total pore volume. PSDs were determined by applying the nonlocal density functional theory (NLDFT) model on the adsorption isotherms and assuming a slit-shape pore.
B. Electrochemical measurements
Working electrode was prepared by pressing 2 mg of the MoO2/rGO nanohybrids onto nickel foam under 10 MPa. In the electrochemical test, 6 M KOH solutions were used as electrolyte. The CHI660D electrochemical workstation (Chenhua Instruments Co. Ltd., Shanghai, China) was applied to determine the electrochemical capacitive performances of the MoO2/rGO nanohybrids electrode. In a three-electrode system by using MoO2/rGO nanohybrids as working electrode, a platinum film as a counter electrode and a saturated calomel electrode (SCE as a reference electrode), CV, galvanostatic charge–discharge measurement, and electrical impedance spectroscopy (EIS) were performed. The potential window from −1.2 to 0 V versus SCE reference electrode was applied to the electrochemical measurements. For comparison, the M30G1 composite was also tested in 1 M Na2SO4 electrolyte (neutral electrolyte).
The corresponding specific capacitance was calculated using the following equation:
 $${C_{\rm{m}}} = {C \over m} = {{I \times \Delta t} \over {\Delta V \times m}}\quad ,$$
where C m (F/g) is the specific capacitance, I (A) is the discharge current, Δt (s) is the discharge time, ΔV (V) represents the potential drop during the discharge process, and m (g) is the mass of the active material.
III. RESULTS AND DISCUSSION
A. Structural analysis
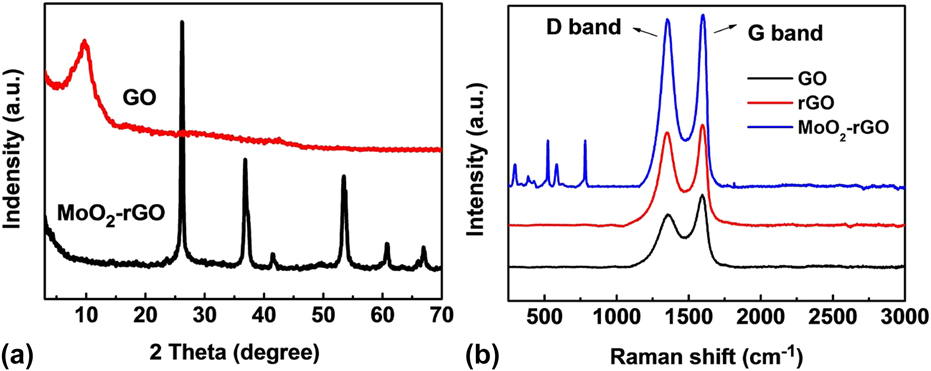
XRD was used to identify the phases for the as-prepared MoO2–rGO nanohybrids and graphite oxide [Fig. 1(a)]. The XRD pattern of graphite oxide has a sharp peak centered at 2θ = 10.5°, corresponding to an interlayer spacing of 7.88 Å (d 002) among stacked GO sheets. This interlay spacing is much larger than graphite powder (approximately 3.4 Å, before oxidative treatments) owing to the incorporation of various oxygen-containing functional groups (C–Ox) in the sp 3 state and intercalated H2O molecules in between GO sheets. The diffraction peaks observed in case of MoO2–rGO nanohybrids are readily indexed to a pure monoclinic phase of MoO2 (JCPDS No. 65–5787; a = 5.6109 Å, b = 4.8562 Å, and c = 5.6285 Å). No characteristic peaks of rGO were observed, due to the strong intensities of the diffraction peaks from crystalline MoO2. No characteristic peaks observed for impurities such as phosphates and MoO3 as well as other molybdenum oxides.
(a) XRD patterns of MoO2/rGO composite, (b) Raman spectra of GO, rGO and MoO2/rGO composite.
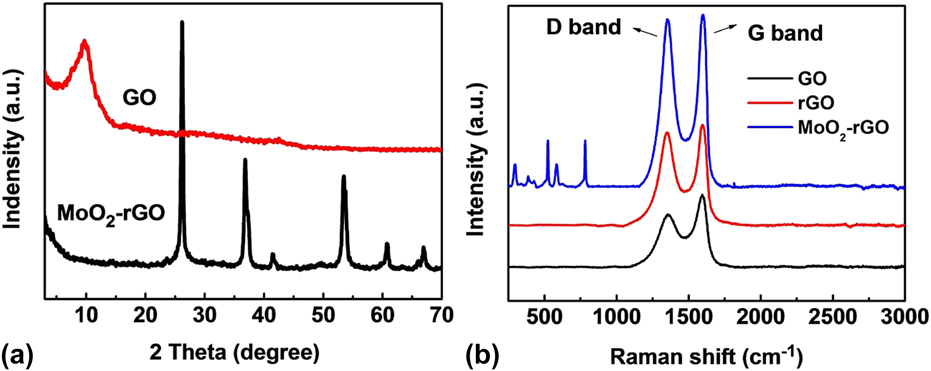
The Raman spectrum of MoO2–rGO is shown in Fig. 1(b). The presence of the D and G bands confirms the presence of rGO. The D band located at 1350 cm−1 is mainly due to the sp 3 hybridized C–C bonds. The G band appears at 1597 cm−1 is due to the sp 2 hybridized C–C bonds in a two-dimensional hexagonal lattice. The I D/I G ratio of rGO in the hybrids is 0.99, slightly higher than 0.84 for pure as-synthesized rGO, which is due to the presence of more defects and interaction between MoO2 nanoparticles and graphene sheets and a decrease in the average size of the sp 2 domains upon the reduction of GO to rGO. The Raman spectrum of the MoO2–rGO hybrid shows three sharp characteristic bands of MoO2 at 750, 588, 497 cm−1.
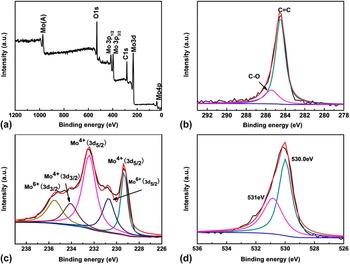
The MoO2–rGO nanohybrids can be further demonstrated by x-ray photoelectron spectroscopy (XPS). The XPS spectrum [Fig. 2(a)] of the MoO2–rGO shows distinct peaks at 232.9 (Mo 3d), 284.5 (C 1s), 398 (Mo 3p 3/2), 415 (Mo 3p 1/2) and 530 (O 1s) eV, indicating the contributions from both graphene and molybdenum dioxide. Reference Bhaskar, Deepa, Rao and Varadaraju25 The C 1s XPS spectrum of the MoO2–rGO is show in Fig. 2(b). It can be divided into two peaks and they are ascribed to C–C bonds at 284.5 eV and C–O groups at 285.6 eV. The Mo 3d peak can be fitted into two doublets [Fig. 2(c)]. Two strong peaks centered at 229.6 and 232.5 eV are attributed to the binding energies of Mo 3d 5/2 of Mo4+. The peak centered at 234.1 eV is the binding energies of Mo 3d 3/2. They are indicate the Mo(IV) oxidation state of MoO2. Additionally, peak at 230.6 and 235.5 eV attributing to Mo(VI) 3d 5/2 and 3d 3/2 of MoO3, respectively, results from the slight surface oxidation of metastable MoO2 in air. Reference Yang, Gao, Tang, Wu and Holze26 The O 1s core level spectrum shows two deconvoluted contributions at 530 and 531 eV, corresponding to oxygen species in MoO2 phase and residual oxygen-containing groups bonded with C atoms in graphene.
XPS spectra for the MoO2–rGO nanohybrids: (a) survey spectrum and high-resolution (b) C 1s, (c) Mo 3d, and (d) O 1s spectra.

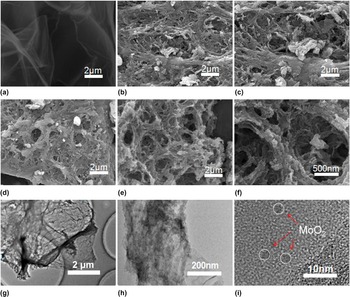
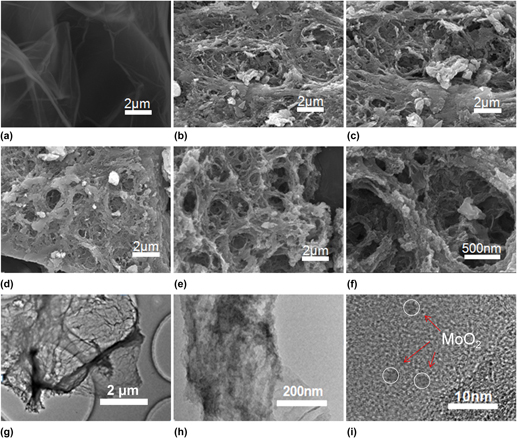
The morphology and structure of the as-prepared MoO2–rGO nanohybrids was characterized by SEM. The GO sheets were gauzy and evenly wrinkled [Fig. 3(a)]. The surface of MoO2–rGO nanohybrids were rough and uneven as shown in Figs. 3(b)–3(f), which was the direct evidence for successful formation of nanohybrids through a one-pot hydrothermal method. The formation of MoO2 nanoparticles on the surface of reduced graphene oxides can avoid the stack from layer of graphene, further forming porous well-defined framework. As shown in Figs. 3(b)–3(f), the 3D porous structure of the composites were randomly oriented, crinkly with continuous mesopores ranging from hundreds of nanometers to several micrometers. As shown in Fig. 3(e), the composite of M30G1 had more clearly channel. The interconnected porous structure not only guarantees increasing the surface active site, but also convenient for ion of embedding and emergence. From Fig. 3(f), it can be seen that the MoO2 nano-particles are well encapsulated by 3D porous structure graphene. The TEM images of Figs. 3(g) and 3(h) clearly illustrate the presence of voids between interconnected particles MoO2–rGO nanohybrids. The high resolution transmission electron microscopy (HRTEM) measurement shows the crystal lattice of MoO2 nanoparticle, as shown in Fig. 3(i). The diameter of MoO2 nanoparticles were about 3–5 nm.
(a–d) SEM images of GO, M10G1, M40G1, M50G1, (e and f) low- and high-magnification SEM images of M30G1, (g–i) low- and high-magnification TEM images of M30G1.

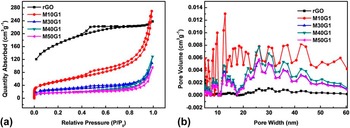
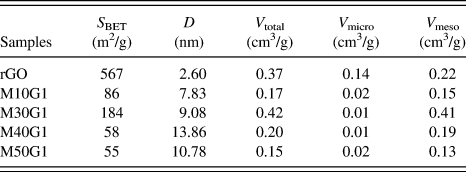
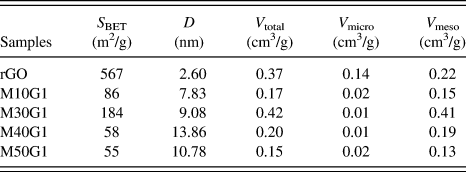
To determine the pore texture and specific surface area, we have performed nitrogen adsorption–desorption analysis. Reference Xu, Liu, Wang, Zhu, Lu, Zhao and Pan27 All of the isotherms show a typical type IV hysteresis loop with a hierarchical pore distribution from mesopores to micropores, further confirming the 3D porous structure as shown in Fig. 4. The pore size distributions [Fig. 4(b)] indicate that as-synthesized composite exhibit wide pore size distributions from 2 to 90 nm, further confirming the existence of mesopores. With the increasing of molybdenum precursor, the specific surface areas were cut down as seen from Table I. The proportion of the micropores is higher in rGO than other as-synthesized samples. That can be explained as following: the remaining oxygen functional groups provide nucleation sites for the metal ions to form MoO2 nanoparticles on graphene. Reference Jana, Saha, Samanta, Murmu, Kim, Kuila and Lee28 With the increasing of molybdenum precursor content, more MoO2 are sandwiched between the graphene layers to serve as “spacers”. It will produce more mesopores and larger specific surface area, due to more graphene are separated. Once MoO2 content exceed an optimum value, excessive MoO2 are exposed on the surface of graphene and blocking the graphene interlayer spacing, resulting in lower specific surface area. Reference Xu, Liu, Wang, Zhu, Lu, Zhao and Pan27
(a) N2 sorption isotherms and (b) pore size distribution plots of M10G1, M30G1, M40G1.

Surface area and pore-structure parameters of samples.
B. Electrochemical performances analysis
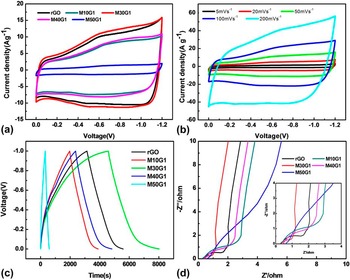
To explore the potential applications of as-synthesized nanohybrids, the samples were fabricated into supercapacitor electrodes and characterized with cyclic voltammograms (CVs) and galvanostatic charge/discharge measurements. CV response of the as-prepared samples carried out at a scan rate of 50 mV/s, in the potential range of 0–1.2 V using 6 M KOH aqueous electrolyte solution is shown in Fig. 5(a). The shapes of CV curve in our experiment are quasi-rectangular along the current–potential axis without obvious redox peaks, indicating that all samples have a good capacitive behavior in supercapacitors. Reference Ratha and Rout29 It is clear that the specific capacitance is proportional to the areas of a CV curve, revealing that the sample M30G1 has the highest specific capacitance. It can be attributed to the synergistic effect of the rGO and MoO2, where the MoO2 contribute high capacitance through a redox reaction process and 3D porous structures rGO can improve the electrical conductivity of the MoO2. This kind of pore structure was very important to improve the rate capability and large current charge/discharge performance, because the interconnected mesopores can facilitate better diffusion and transport of electrolyte. For M30G1 sample [Fig. 5(b)], no obvious distortion is observed in the CV curves as the potential scan rates are increased. The obvious increase of current with scan rates means a desirable rate capability for M30G1. Reference Yu, Wu, Wang, Zhou, Huang, Bai and Li30
(a) Cyclic voltammograms curves of the supercapacitors based on nanohybrids of M10G1, M30G1, M40G1, M50G1 and rGO at scan rates of 50 mV/s, (b) cyclic voltammograms of the M30G1 at scan rates of 5, 20, 50, 100, 200 mV/s. (c) Galvanostatic charge/discharge curves based on nanohybrids of M10G1, M30G1, M40G1, M50G1 and rGO at a charging/discharging current density of at 0.1 A/g, (d) EIS spectra of M10G1, M30G1, M40G1, M50G1 and rGO.

Figure 5(c) shows the galvanostatic charge–discharge curves of the electrode based on the as-obtained hybrids at same current densities within a potential range of 0–1.0 V. The sample M30G1 reached an optimum value with highest specific capacitance (356 F/g), further proved the synergistic effect of the EDLC and pseudocapacitances, where rGO can improve the electrical conductivity to provide the EDLC and the MoO2 contributes high pseudocapacitances through a redox reaction process. In addition to that, the 3D porous structures rGO sheets provide an excellent conductivity and more active sites, whereas the MoO2 nanocrystals with uniform dispersions can be substantially utilized during the electrochemical process. Reference Li, Zhao, Shi, Liu and He8,Reference Qian and Lu31 The 3D interpenetrating porous structure could increase surface area, which promote the electrolyte diffusion and facilitate the efficient propagation of electrons. Thus, the MoO2–rGO with well defined nanostructure can accelerate the electron transport and facilitate the redox reactions in the whole electrode, significantly enhancing the kinetic requirements for an ideal electrode material. The superfluous MoO2 nanocrystals lead to reduce specific capacitance because of lower channel and surface area. Reference Kim, Ramadoss, Saravanakumar, Veerasubramani and Kim32,Reference Deng, Wang, Duan and Liu33 It can be seen that all curves showed a small IR drop, revealing the internal resistance of materials was low. At a low current densities of 0.1 A/g, the specific capacitance of M10G1, M30G1, M40G1, M50G1 and rGO are 192, 356, 248, 27, and 244 F/g, respectively.
Figure 5(d) displays the electrochemical impedance spectra of the M10G1, M30G1, M40G1, M50G1 and rGO electrodes. The impedance curves showed an inclined line in the low frequency region and a compressed semicircle in the high region. Each of the plots consists of two sections, a small semicircle at the high-frequency region that can be ascribed to charge transfer resistance (R ct) at the interface between the electrolyte and electrode and a slope line at the low-frequency region that can be ascribed to mass transfer resistivity of the electrolyte within the pore of the electrode. Reference Zhang, Liu, Cheng and Zhang34,Reference Tao, Zhu, Yang, Zhang and Ni35 The initial semicircle is a characteristics of charge transfer resistance (R ct), which was calculated to be 2.17, 0.56, 1.56, 2.7, 1.31 ohm, respectively, for the M10G1, M30G1, M40G1, M50G1 and rGO. 3D porous structures were provide channel for charge transfer. The M30G1 composites has the lowest R ct values (0.5 Ω), which means the lowest response of the electrode material in particular electrolyte. In Nyquist plots, all of the samples manifest a small real axis intercept (<0.5 Ω), showing a low internal resistance, which benefits from the porosity and the electroconductivity of graphene. It is obvious that sample M30G1 has the lowest internal resistance among them, indicating that it exhibits the highest electrical conductivity. The post-semicircle straight line in the low frequency region reflects the diffusion of the electroactive species, and the line with higher slope signifies lower diffusion resistance. Reference Karthika, Rajalakshmi and Dhathathreyan36 It is observed that the slope of the straight line in the M30G1 is much vertical, represents the dominance of ideal double-layer charge/discharge at low frequencies.
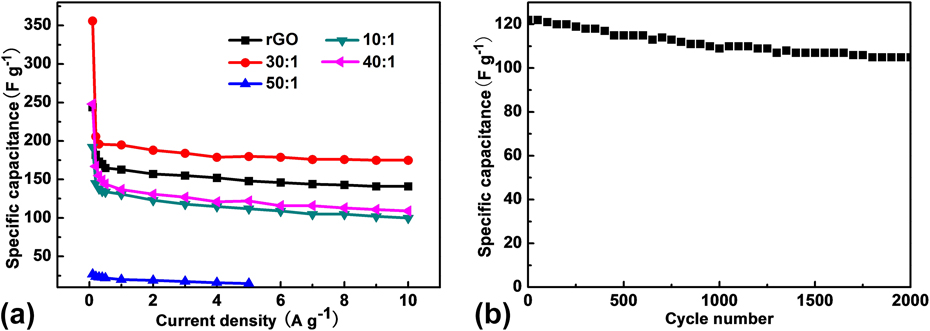
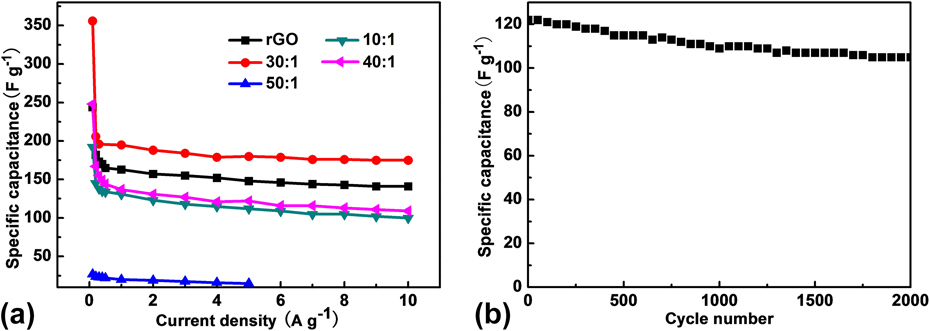
The rate capacity of these composites was also characterized by GCD technique under different current densities [Fig. 6(a)]. The capacitance decrease at higher scan rates for all the sample from 0.1 to 10 A/g. At a high current density, the ions are mainly adsorbed on the outer surface of the electrode and do not have enough time to reach all the surface of composites at high current density. Compared with the other samples, the M30G1 composites showed the highest specific capacitance under all the current densities indicating good rate capacity, which might be a result from the synergistic effect of the rGO (high specific surface and conductivity) and pseudocapacitor. Reference Zhu, Liu, Qian, Han, Duoss, Kuntz, Spadaccini, Worsley and Li37 Cycling stability is an important requirement for supercapacitors. It was characterized using galvanostatic charge–discharge tests up to 2000 cycles at a current density of 1 A/g [Fig. 6(b)]. The cycling stability of M30G1 was characterized. The capacity retention ration is close to 86% after 2000 charge/discharge cycles. The M30G1 shows good stability revealing the good lifetime of the electrodes. Reference Ratha and Rout29,Reference Tao, Zhu, Yang, Zhang and Ni35,Reference Zou, Wang, Xiang, She, Chu, Qiu, Xu, Liu, Tang and Sun38
(a) Specific capacitances of the nanohybrids M10G1, M30G1, M40G1, M50G1 and rGO at a charging/discharging current density of 0.1 to 10 A/g calculated from galvanostatic discharge branches, (b) galvanostatic cycling performance of M30G1 at 1 A/g.
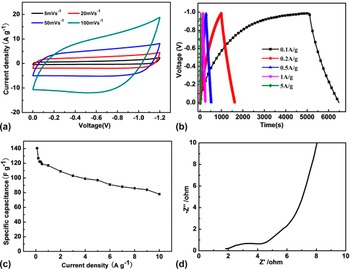
To evaluate the performance of the M30G1 in neutral electrolyte, 1 M Na2SO4 electrolyte was used for comparison. Figure 6(a) shows the CV curses remain unchanged and keep a quasi-rectangular shape at scan rates of 5–100 mV/s, proved the good rate capability and the formation of EDLC with pseudocapacitor. The specific capacitance of M30G1 is 140 F/g [Fig. 6(b)], lower than the specific capacitance in 6 M KOH electrolyte. Figure 7(b) displayed the M30G1 specific capacitance under the current densities from 0.1 to 10 A/g. The internal resistance, R ct, Warburg resistance [Fig. 6(d)] were little higher than that in KOH electrolyte. These may be attributed to the even larger diameter of SO4 2− compared with OH−. The charge transfer and ionic diffusion were harder at the 3D porous structure surface. Therefore KOH was suitable for as electrolyte for the M30G1 nanohybrids.
Electrochemical performance of M30G1 in 1 M Na2SO4 electrolyte. (a) Cyclic voltammograms curves of M30G1 at different scan rates, (b) galvanostatic charge/discharge curves of M30G1 at various current density, (c) specific capacitances of the M30G1 at a charging/discharging current density of 0.1 to 10 A/g calculated from galvanostatic discharge branches, (d) Nyquist plots of M30G1 in 1 M Na2SO4 electrolyte.

IV. CONCLUSIONS
The MoO2–rGO composite electrode material has successfully synthesized via a hydrothermal route, involving the in situ reduction the molybdenum precursor and embedding of MoO2 nanoparticles on graphene sheets in a one-pot hydrothermal method. 3D porous structures were formatted in this process. The resultant supercapacitor exhibits both double-layer and pseudocapacitance. The composite of M30G1 demonstrated the best supercapacitor performance. The maximum specific capacitance for M30G1 was 356 F/g at a current density of 0.1 A/g in 6 M KOH electrolyte. It also exhibits excellent cyclic stability of 86% retention for up to 2000 cycles. Therefore, we can determine that M30G1, with a good rate capacity and high cyclic stability, is an excellent material for high performance supercapacitors. The specific capacitance of M30G1 in 1 M Na2SO4 electrolyte is 140 F/g, which is lower than that in 6 M KOH. It may be attributed to the even larger ionic diameter of SO4 2− compared with OH-, which is unfavorable for the ionic diffusion at 3D porous structure surface. Therefore KOH was more suitable to be the electrolyte for the M30G1 nanohybrids electrode.
ACKNOWLEDGMENT
This work was supported by the National Natural Science Foundation of China (No. 21403130, 21373239), Natural Science Foundation of Shandong Province (ZR2014BQ028).