Implications
A better knowledge of vitamin A tissue accumulation in fattening pigs is an interesting issue that may allow improving productive efficiency and, consequently, has to be taken into consideration in pig feed formulation. On the other hand, its increase in diet formulation could induce lower levels of other vitamins such as α-tocopherol with known positive effects on meat quality characteristics. Consequently, dietary strategies aimed at having a more accurate control of dietary vitamin A concentration could be useful for increasing vitamin E tissue deposition; hence, it is an interesting alternative which is not as expensive as the addition of high dietary vitamin E.
Introduction
A growing trend in research emphasizes the importance of vitamins A and E in swine nutrition (Miller et al., Reference Miller, Waters and Ntambi1997; Siebert et al., Reference Siebert, Kruck, Davis, Pitchford, Harper and Bottema2006). Minimum nutritional requirements have been set in growing-finishing pigs at 1300 and 11 IU/kg for vitamin A and vitamin E, respectively (National Research Council (NRC), 1998). However, in common practice, the amount of vitamin A and vitamin E added to diets exceeds the current NRC recommendations due to a number of benefits found with health status and meat quality (Buckley et al., Reference Buckley, Morrissey and Gray1995; D’Souza et al., Reference D’Souza, Pethick, Dunshea, Pluske and Mullan2003; Siebert et al., Reference Siebert, Kruck, Davis, Pitchford, Harper and Bottema2006). Thus, growing-finishing pig diets in the European Union and the USA contain vitamin A concentrations approximately six- to ten-fold higher than NRC recommendation, and up to 20 times in the case of vitamin E (Fraga and Villamide, Reference Fraga and Villamide2000; Morrissey et al., Reference Morrissey, Buckley and Galvin2000).
On the other hand, there is evidence that high dietary vitamin A (dVitA) levels may affect vitamin E absorption and accumulation in chicks (Abawi and Sullivan, Reference Abawi and Sullivan1989; Blakely et al., Reference Blakely, Mitchell, Jenkins, Grundele and Whittaker1991), young humans (Drott et al., Reference Drott, Ewald and Meurling1993) and weanling pigs (Ching et al., Reference Ching, Mahan, Wiseman and Fastinger2002). However, no consistent information exists in growing-finishing pigs. In pigs, from weaning to slaughter (105 kg body weight), Hoppe et al. (Reference Hoppe, Schoner and Frigg1992) found an effect of dVitA level up to 10 000 IU in α-tocopherol concentration in heart muscle, while Anderson et al. (Reference Anderson, Myer, Brendemuhl and Mcdowel1995) did not find any interference of 20 000 IU dVitA.
Moreover, α-tocopherol retention in pig tissues can also be affected by dietary fat source (Rey et al., Reference Rey, Lopez-Bote, Kerry, Lynch, Buckley and Morrissey2001) and fat unsaturation (Villaverde et al., Reference Villaverde, Baucells, Manzanilla and Barroeta2008), but there is no information on the effect of dietary fat either on retinol accumulation or in the interaction between both liposoluble vitamins. Hosotani and Kitagawa (Reference Hosotani and Kitagawa2005) did not find any effect of dietary fat on retinol concentration in rats, but Abawi et al. (Reference Abawi, Sullivan and Scheideler1985) found that high dietary fat levels lead to increased liver vitamin A in chicks.
In addition, there are some studies on the recommended administration time of dietary α-tocopherol in order to achieve optimal tissue concentration (Morrissey et al., Reference Morrissey, Buckley and Galvin2000); but little information is available on the dose–response and administration time effects of dVitA on retinol accumulation, and its effects on vitamin E status. Some experiments have been carried out on children (Raghuramulu et al., Reference Raghuramulu, Underwood, Bhaskaram, Arunjyothi, Chennaiah and Reddy1998), rats (Alarcón-Corredor and Alfonso, Reference Alarcón-Corredor and Alfonso2007) and weanling piglets (Surles et al., Reference Surles, Mills, Valentine and Tanumihardjo2007), but there is no information on growing pigs.
The objectives of the present study were to study the possible interactions between dietary vitamins A and E in the presence of dietary saturated or unsaturated fats in growing-finishing pigs, and to study the vitamin A and vitamin E retention at different withdrawal times before slaughter.
Material and methods
Chemicals
All chemicals used were ‘HPLC’ grade and were supplied by Panreac (Panreac Química S.A., Montcada i Reixac, Barcelona, Spain). The retinyl palmitate, retinol-all trans, β-carotene and all-rac-α-tocopheryl acetate, as pure standards, were provided by Sigma Chemicals (Sigma Aldrich Química S.A., Alcobendas, Madrid, Spain).
Husbandry and experiment design
The protocol for animal care and experiment procedures used in this experiment were approved by the Complutense University of Madrid. The trial was conducted at the Centro de Pruebas de Porcino ITACYL (Hontalbilla, Segovia, Spain). The trial consisted of three experiments.
Experiment 1
A total of 192 castrated male (Large White × Landrace) pigs with a live weight of 56.4 ± 1.5 kg were used. The pigs were randomly distributed and located in pens in groups of four, and were given experimental diets which were formulated to contain either a saturated (palm oil) or a polyunsaturated fat source (full fat soya) – SAT and POLY diets, respectively – and two dVitA levels added in the pre-mix (0 IU v. 100 000 IU). The feeding experiment lasted for 72 days. Before the beginning of the experiment, all pigs were subjected to the same feeding and management. During the experimental period, the pigs were fed ad libitum and then slaughtered at 114.9 ± 2.2 kg live weight.
Experiment 2
A total of 128 castrated male (Large White × Landrace) pigs with a live weight of 52.1 ± 1.3 kg were randomly distributed and located in pens in groups of four, and were given experimental diets that contained either a high (100 000 IU/kg diet) or a zero (0 IU/kg diet) level of vitamin A in the vitamin–mineral mix. After 10 weeks of feeding, the group fed the high vitamin A level was divided into two groups: one of them continued with the same diet (HH-VitA), and the other was fed with a diet containing no vitamin A (H0-VitA). The group that was fed the 0 IU dVitA for the previous 10 weeks was also split into two groups, receiving high or zero vitamin A (0H-VitA or 00-VitA, respectively). Pigs were fed with these latter diets for 2 weeks and then were slaughtered at 124.4 ± 2.4 kg live weight.
Experiment 3
A total of 108 castrated male (Large White × Landrace) pigs with 56.8 ± 1.2 kg live weight were used. Nine replicates (four pigs per pen) were randomly distributed and assigned to each of the following treatments: 1300 IU/kg feed (NRC-VitA) and 13 000 IU/kg feed (10× NRC-VitA) for 11 weeks. The third group was fed with 13 000 IU/kg feed for 6 weeks, and then a diet with 0 IU/kg feed for 5 weeks (10× NRC/0-VitA). During the experimental period, the pigs were fed ad libitum and then slaughtered at 126.3 ± 2.5 kg live weight.
In all the experiments, the concentration of all-rac-α-tocopheryl-acetate was 100 IU/kg feed.
Diets
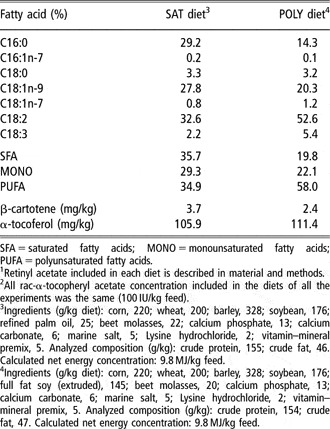
Ingredients, chemical composition and main fatty acids of experimental diets are shown in Table 1. In experiment 1, POLY and SAT diets were used (containing either 0 or 100 000 IU in the pre-mix/kg diet), while in experiments 2 and 3, pigs were fed exclusively the POLY diet containing different amounts of vitamin A in the mix (0 v. 100 000 in experiment 2, and 0, 1300 and 13 000 IU/kg feed in experiment 3). Determination of the compositional analysis of feeds (by triplicate) was carried out according to the Association of Official Analytical Chemists (2005). Concentrations of α-tocopherol in the experimental diets were quantified by a modification of the method described by Butriss and Diplock (Reference Butriss and Diplock1984). Carotenoids, as natural precursors of vitamin A, in the feed were measured by a modification of the procedure described by Akhtar and Bryan (Reference Akhtar and Bryan2008). Feed samples were ground, mixed and added to an amber Erlenmeyer flask containing 0.5 ml of BHT (butylhydroxytoluene; 30 mg/ml ethanol). Hot (60°C) 0.1 N HCl (10 ml) and chloroform were added (15 ml), and the mixture was vortexed and centrifuged at 3220 × g for 50 min. The organic phase containing the carotenoids was removed and diluted with 1 ml 50 : 50 (v/v) MeOH : isopropanol 0.05% BHT for HPLC analysis. Separation was carried out on a HPLC provided with a diode array detector and a Develosil 5 μm RP-Aqueous C30 column (Phenomenex, Torrance, CA, USA) at a flow rate of 1 ml/min (MeOH : isopropanol, 40 : 60). The absorbance was measured at 325 nm.
Fatty acid composition, ingredients and analyzed composition of experimental dietsFootnote 1,Footnote 2

SFA = saturated fatty acids; MONO = monounsaturated fatty acids; PUFA = polyunsaturated fatty acids.
1 Retinyl acetate included in each diet is described in material and methods.
2 All rac-α-tocopheryl acetate concentration included in the diets of all the experiments was the same (100 IU/kg feed).
3 Ingredients (g/kg diet): corn, 220; wheat, 200; barley, 328; soybean, 176; refined palm oil, 25; beet molasses, 22; calcium phosphate, 13; calcium carbonate, 6; marine salt, 5; Lysine hydrochloride, 2; vitamin–mineral premix, 5. Analyzed composition (g/kg): crude protein, 155; crude fat, 46. Calculated net energy concentration: 9.8 MJ/kg feed.
4 Ingredients (g/kg diet): corn, 220; wheat, 200; barley, 328; soybean, 176; full fat soy (extruded), 145; beet molasses, 20; calcium phosphate, 13; calcium carbonate, 6; marine salt, 5; Lysine hydrochloride, 2; vitamin–mineral premix, 5. Analyzed composition (g/kg): crude protein, 154; crude fat, 47. Calculated net energy concentration: 9.8 MJ/kg feed.
Fatty acid of diets were extracted and quantified by the one-step procedure of Sukhija and Palmquist (Reference Sukhija and Palmquist1988) from lyophilized samples. Fatty acid methyl esters were analyzed by gas chromatography using a Hewlett Packard HP-6890 (Avondale, PA, USA) gas chromatograph equipped with a flame ionization detector and a capillary column HP-Innowax (30 m × 0.32 mm inner diameter and 0.25 μm polyethylene glycol-film thickness) (Agilent Technologies Gmbh, Las Rozas, Madrid, Spain) (Lopez-Bote et al., Reference Lopez-Bote, Isabel, Ruiz and Daza2003).
Sample collection and chemical analysis
Back fat biopsy samples were taken at the beginning and after 70 days of feeding with the experimental diets in experiment 2. Biopsy samples were taken at 6 cm from the midline at the last rib using a metal cylinder (diameter 0.25 cm) with a sharpened edge. All necessary precautions were taken to prevent animal discomfort during and after the in vivo sampling processes. This included tranquilization with 40 mg of azaperon (Stressnill; Labopica, Madrid, Spain) 1 h before the biopsy, and local anesthesia with 2% lidocaine-HCL immediately prior to the sample collection. Afterwards, animals received a 2 ml penicillin intramuscular injection (300 000 IU/ml; Labopica).
At slaughter, samples of liver, adipose tissue (outer back fat layer) and the longissimus dorsi muscle at the level of the last rib were taken, weighed, vacuum-packed in low-oxygen permeable film and kept frozen at −20°C until analysis. Analyses were carried out within 3 weeks of slaughter. Concentrations of retinol, retinyl palmitate and α-tocopherol in liver, and retinol and α-tocopherol in longissimus dorsi muscle samples were quantified according to the method described by Rey and Lopez-Bote (Reference Rey and Lopez-Bote2001). Samples were homogenized in a 0.054 M dibasic sodium phosphate buffer adjusted to pH 7.0 with HCl. Absolute ethanol (3 ml) and hexane (2 ml) were added and mixed for 1 min and the upper layer containing retinol, and tocopherol was evaporated and dissolved in ethanol prior to analyses by reverse phase HPLC (HP 1100, provided with a diodo array detector; Hewlett Packard, Waldbronn, Germany). Separation was performed on a LiCrospher 100 RP-18 column (Agilent Technologies GmbH); the mobile phase was methanol : water (97 : 3 v/v) at a flow rate of 2 ml/min, and the detector was fixed at 325 nm for the retinol and retinyl palmitate measurement and at 292 nm for the detection of α-tocopherol (López-Bote et al., Reference López-Bote, Rey, Ruiz, Isabel and Sanz-Arias1997).
Retinol and α-tocopherol in adipose tissue, were analyzed using a method described by Rey et al. (Reference Rey, Daza, López-Carrasco and López-Bote2006). Samples (0.05 g) were saponified in the presence of KOH (50%), KCl (1.15%) and pyrogallol (3% in ethanol) at 70°C for 30 min. Vitamins were extracted in hexane, concentrated in ethanol and analyzed by means of a HPLC (HP 1100, with a diodo array detector; Hewlett Packard), as previously described.
The susceptibility of muscle tissue homogenates to iron-induced lipid oxidation was determined by a modification of the Kornbrust and Mavis method (Reference Kornbrust and Mavis1980), in which 1 mM FeSO4 was used as a lipid oxidation catalyst. Homogenates (approximately 1 mg/ml buffer) were incubated at 37°C in 40 mM Tris-malate buffer (pH 7.4) with 1 mM FeSO4 in a total volume of 10 ml. At fixed time intervals, 1 ml aliquots were removed for measurement of thiobarbituric acid-reactive substances (TBARS). TBARS were expressed as nM malondialdehyde/mg protein. Protein content was measured by the Bradford procedure (Reference Bradford1976).
Statistical analysis
The data was analyzed as a completely randomized design using the general linear model (GLM) procedure contained in the SAS version 8 (1999). The comparative analysis between averages was carried out using the LSD test. Data were presented as the average of each group and the root of the average square error (RMSE) together with the significance levels. The pen was the experimental unit for all data analysis.
Results and discussion
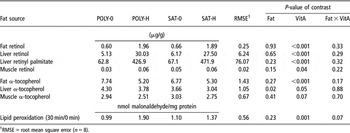
The concentrations of retinol, retinyl palmitate and α-tocopherol in longissimus dorsi muscle, liver and adipose tissue from pigs fed either a saturated or an unsaturated fat source are shown in Table 2 (experiment 1). In general, the retinol and retinyl palmitate contents reflected the retinyl acetate concentration of the diets. The α-tocopherol content was higher in the adipose tissue, followed by the liver and the muscle samples, in accordance with earlier findings (Chung et al., Reference Chung, Mahan and Lepine1992; Buckley et al., Reference Buckley, Morrissey and Gray1995). The retinol and retinyl palmitate concentration significantly increased with a high dVitA in all tissues. It was higher in liver tissue followed by adipose tissue and muscle, which is in accordance with earlier reports in chickens (Surai and Kuklenko, Reference Surai and Kuklenko2000). However, in pigs, other authors (Anderson et al., Reference Anderson, Myer, Brendemuhl and Mcdowel1995) found a higher retinol concentration in adipose tissue than in liver, and Hogberg et al. (Reference Hogberg, Pickova, Babol, Andersson and Dutta2002) reported higher retinol concentration in muscle than in adipose tissue. The main reserve of retinol is the liver (Tiftik, Reference Tiftik1992), and this regulates the output of retinol to tissues bound to retinol-binding protein (Muhilal and Glover, Reference Muhilal and Glover1974). The supplementation of 100 000 IU of dVitA used in this first experiment induced a range of 5.13 to 30.03 μg retinol/g liver, 62.78 to 426.88 μg retinyl palmitate/g liver and 0.60 to 1.96 μg retinol/g fat. Abawi and Sullivan (Reference Abawi and Sullivan1989) used the same dVitA concentration in chicks, but accumulation was studied in plasma, and the study of Surles et al. (Reference Surles, Mills, Valentine and Tanumihardjo2007) was developed in piglets with vitamin deficiency. Olivares et al. (Reference Olivares, Daza, Rey and Lopez-Bote2009) found similar retinol concentration in adipose tissue from pigs fed 100 000 IU dVitA. On the other hand, dietary fat (unsaturated v. saturated) did not affect retinol or retinyl palmitate deposition in pigs. On this subject, there is not much information in the literature. Likewise, Hosotani and Kitagawa (Reference Hosotani and Kitagawa2005) found no effect of dietary fat saturation on tissue retinol concentration in rats. However, in the present study, liver α-tocopherol concentration was higher (P = 0.02) in pigs fed a polyunsaturated than in those receiving a saturated-enriched diet. This effect could be explained because α-tocopherol absorption and/or deposition is lower in the presence of saturated fatty acids than in polyunsaturated (Villaverde et al., Reference Villaverde, Cortinas, Barroeta, Martin-Orue and Baucells2004). Moreover, the high concentration of dVitA (100 000 IU) produced lower adipose tissue and liver α-tocopherol concentration (P < 0.05), and a tendency was observed in muscle α-tocopherol (P = 0.07). This effect has also been reported in the plasma of broiler chicks (Abawi and Sullivan, Reference Abawi and Sullivan1989) when a similar concentration of dVitA (100 000 IU) was used.
Retinol, retinyl palmitate and α-tocopherol concentration in pig tissues and muscle lipid peroxidation from pigs fed the diets containing a polyunsaturated (POLY) or saturated (SAT) fat source with zero (0) (0 IU/kg diet) or high (H) (100 000 IU/kg diet) level of vitamin A (VitA) in the premix (experiment 1)

1RMSE = root mean square error (n = 8).
In order to assess the effect of negative interaction between both vitamins on oxidative stability of pig tissues, TBARS concentration was measured in induced-oxidation incubation for 30 min (Table 2). Pigs fed the diets with a high dose of vitamin A, and consequently with lower α-tocopherol concentration in tissues, showed a higher increase in oxidation between 0 and 30 min of incubation (P = 0.001). To our knowledge, there is no study on the effect of high dVitA on lipid oxidation in pig. In chickens, Pieszka (Reference Pieszka2003) found an increase in TBARS values of meat with high dose of dVitA (18 750 v. 6750 IU/kg feed). However, Bartov et al. (Reference Bartov, Sklan and Friedman1997), using lower doses of dVitA (4 v. 40 IU/kg feed), did not find any effect on lipid oxidation in broiler meat.
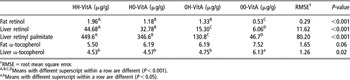
In order to study the retinol and α-tocopherol retention at different administration and withdrawal times of dVitA prior to slaughter, a second experiment was carried out (experiment 2). As expected, the highest contents of retinol and retinyl palmitate were found in the group fed 100 000 IU during the whole experimental period (HH-VitA), followed by the group that initially received 100 000 IU for 10 weeks (H0-VitA), the group that was fed 100 000 IU for the last 2 weeks prior to slaughter (0H-VitA) and finally by the group that did not receive vitamin A in the mix throughout fattening (00-VitA)(Table 3). Moreover, in this experiment, it is rather remarkable that the ranges of 15.3–44.6 μg/g of liver retinol and 130.8–449.6 μg/g of liver retinyl palmitate (treatments HH-VitA, H0-VitA, 0H-VitA) induced a significantly lower (P = 0.02) concentration of liver α-tocopherol that was not different among them. The liver α-tocopherol concentration was approximately 26.25% and 22% lower for the groups HH-VitA, H0-VitA and 0H-VitA, respectively, when compared with the group not supplemented with retinyl acetate (00-VitA) in its diet. Consequently, a high dose of 100 000 IU vitamin A during a short 2-week period is enough to induce α-tocopherol depletion in liver to a similar extent as when 100 000 IU is administered during the whole of 10-week fattening period. Alarcón-Corredor and Alfonso (Reference Alarcón-Corredor and Alfonso2007) reported in rats that the short-term administration of high doses of dVitA produced a significant increase in the content of liver vitamin A and a notable alteration in the activity of liver enzymes. The present work is the first study in pigs in which the withdrawal time of vitamin A and its possible antagonism with α-tocopherol concentration is studied. It is interesting to note that liver α-tocopherol concentration in groups HH, HO and OH were very similar even though notable differences in liver retinol and retinyl palmitate concentrations were found; thus suggesting that the differences in liver α-tocopherol concentration are not due to antagonism between these two liposoluble vitamins at tissue level, but rather at the digestion or transport level.
Retinol, retinyl palmitate and α-tocopherol in liver, and retinol and α-tocopherol in adipose tissue from fattening pigs fed diets containing 0 (0) or 100 000 (H) IU vitamin A (VitA) in the vitamin mix/kg diet during two consecutive periods of 10 and 2 weeks before slaughter (experiment 2)

1RMSE = root mean square error.
A,B,C,DMeans with different superscript within a row are different (P < 0.001).
a,bMeans with different superscript within a row are different (P < 0.05).
A similar response was observed for retinol and α-tocopherol concentrations in adipose tissue at slaughter (Table 3). Fat retinol concentration was the highest in the group fed 100 000 IU and the lowest in the group fed a diet containing 0 IU dVitA in the mix throughout the experimental period (groups HH and 00, respectively). The other two groups (0H and H0) reached intermediate concentrations that were not different among themselves. Furthermore, in this case, α-tocopherol concentration at slaughter mirrored retinol concentration, thus confirming the antagonistic effect of these two liposoluble vitamins in adipose tissue (Table 3) also.
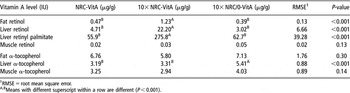
In order to explore the possible antagonistic effect of dVitA administration on tissue α-tocopherol accumulation under current commercial concentrations, a third experiment was carried out. Two groups of fattening pigs were fed diets containing either 1300 (NRC-VitA) or 13 000 IU retinyl acetate/kg (10× NRC-VitA), which is within the range of commercial utilization in swine nutrition. As expected, adipose tissue retinol, liver retinol and liver retinyl palmitate in the group fed the 10× NRC-VitA diet were significantly higher (P < 0.001) than those fed the NRC-VitA diet, and no differences were detected in the muscle retinol or α-tocopherol concentration in liver, adipose tissue or muscle tissues (Table 4). A ten-fold increase in supplemental vitamin A from 1300 to 13 000 IU resulted in a five-fold increase in liver retinol. The liver retinol content was in accordance with the values reported by Ching et al. (Reference Ching, Mahan, Wiseman and Fastinger2002) in weaning pigs fed a 13 200 IU of vitamin A/kg diet for 35 days. Total liver retinol (retinol + retinyl palmitate) of the group fed the 10× NRC-VitA diet reached a concentration of 298 μg/g, which is an intermediate value when compared with those observed in the liver of the H0-VitA (379.4 μg/g) and 0H-VitA (146.1 μg/g) groups in experiment 2.
Retinol, retinyl palmitate and α-tocopherol in liver, and retinol and α-tocopherol in adipose tissue and muscle from pigs fed either diets containing 1300 (NRC-VitA) or 13 000 IU vitamin A (10× NRC-VitA) in the vitamin mix/kg diet during the whole fattening period (11 weeks), or 13 000 IU/kg diet during 6 weeks and then 0 IU for 5 weeks prior to slaughter (10× NRC/0-VitA) (experiment 3)

1RMSE = root mean square error.
A,BMeans with different superscript within a row are different (P < 0.001).
In this experiment, a third experimental group (10× NRC/0-VitA) was also included in order to study the effect of dVitA withdrawal on retinol, retinyl palmitate and α-tocopherol concentration in pig tissues. Vitamin A (13 000 IU/kg diet) was provided for 6 weeks, and then a diet without vitamin A in the mix was provided for five more weeks until slaughter, thus avoiding antagonistic effects in the late fattening period. The concentrations of adipose tissue retinol, and liver retinol and retinyl palmitate were similar to those reported for pigs fed the NRC-VitA diet. However, the concentration of liver α-tocopherol was 23% higher in pigs fed 10× NRC/0-VitA than in the 10× NRC-VitA group (P < 0.001). It is interesting to note that the group fed 0 IU dVitA for 5 weeks prior to slaughter (10× NRC/0-VitA) had a similar concentration of liver retinol and retinyl palmitate than the group fed 1300 IU throughout the fattening period, but the concentration of α-tocopherol was higher. According to these results, vitamin A (retinol or retinyl palmitate) deposition does not interfere with α-tocopherol accumulation in pig liver, but it negatively affects its digestive process even at low dietary concentrations (1300 IU/kg). This observation was also found by Pudelkiewicz et al. (Reference Pudelkiewicz, Webster and Matterson1964) in chicks.
The antagonistic effect of dVitA on α-tocopherol accumulation is controversial. Pudelkiewicz et al. (Reference Pudelkiewicz, Webster and Matterson1964) found a decline in liver α-tocopherol when dVitA exceeded 16 IU in depleted chicks, but Anderson et al. (Reference Anderson, Myer, Brendemuhl and Mcdowel1995) did not find any interference using 20 000 IU in growing-finishing pigs. On the other hand, Hoppe et al. (Reference Hoppe, Schoner and Frigg1992) reported a depletion of α-tocopherol in liver from pigs fed 20 000 and 40 000 IU of dVitA, but no effect was detected when diets contained 10 000 IU/kg. Moreover, Ching et al. (Reference Ching, Mahan, Wiseman and Fastinger2002) found depletion of vitamin E by 13 200 IU of dVitA in weaning pigs when compared with a group fed 2200 IU/kg.
Muscle and adipose tissue α-tocopherol concentrations were also higher in pigs fed 10× NRC/0-VitA than in those fed a 10× NRC-VitA diet (37% and 23%, respectively), but differences were not significant. This is in agreement with Hoppe et al. (Reference Hoppe, Schoner and Frigg1992) and Anderson et al. (Reference Anderson, Myer, Brendemuhl and Mcdowel1995). This is important because dietary strategies aimed at increasing the tissue concentration of α-tocopherol are common practice in swine production due to their positive effect on meat quality characteristics (Morrissey et al., Reference Morrissey, Buckley and Galvin2000; Rey et al., Reference Rey, Lopez-Bote, Kerry, Lynch, Buckley and Morrissey2001). However, a plateau in tissue storage exists at high dietary vitamin E concentration (Hoppe et al., Reference Hoppe, Schoner and Frigg1992) and therefore, it becomes increasingly inefficient and expensive to enhance α-tocopherol concentration in pig tissues exclusively by increasing the vitamin E concentration in the diets.
In conclusion, in fattening pigs, retinol and retinyl palmitate accumulation is affected by dVitA concentration in a quantitative way. Feeding very high levels (such as 100 000 IU/kg diet) negatively affects α-tocopherol concentration in pig tissues and increases susceptibility of muscle tissue to oxidation. Liver α-tocopherol concentration is negatively affected if such a dose is provided for only 2 weeks prior to slaughter. Muscle, adipose tissue and liver α-tocopherol concentration is not affected by dVitA in the range 1300 to 13 000 IU/kg, but liver α-tocopherol concentration is higher if vitamin A is removed from the vitamin mix 5 weeks prior to slaughter. This suggests an interesting alternative to enhancing α-tocopherol in pig tissues. Future research is needed to establish the most adequate time/dose combination of dietary vitamin A and E in order to ensure meat quality characteristics in pigs.
Acknowledgements
The authors are grateful to the Centro de Pruebas Porcino (ITA-CyL, Hontalbillas, Segovia) and COBADU (Zamora). Technical support by R. Prieto and P. Ciria is also acknowledged. This research was supported by Comisión Interministerial de Ciencia y Tecnología (AGL2004-06958 and AGL2007-63655).