INTRODUCTION
Agricultural intensification is a prerequisite for development and economic growth (Mellor, Reference Mellor1976). Such intensification of agriculture is achieved by increasing productivity, cropping intensity and switching to high value crops (Boserup, Reference Boserup1965; Pretty et al., Reference Pretty, Toulmin and Williams2001). While Senegal enjoyed several agricultural growth phases since its independence in 1960, the average production and productivity trend remained stationary (Kelly et al., Reference Kelly, Diagana, Reardon, Gaye and Crawford1996). As a result, Senegal relies heavily on imports to face the local food demand. For instance, because rice domestic production represents only 15% of the demand, Senegal has imported on average 880 thousand tons of rice annually since 2000 (Lancon and Benz, Reference Lancon and Benz2002). This places Senegal as the second largest importer of rice in Sub-Saharan Africa. The heavy reliance of Senegal on imports for food supply leaves local population vulnerable to increased prices and volatility from international markets during crises. To address the food security issue, different policies have been implemented to promote national food production growth. In 2008, the government of Senegal launched the great push forward for agriculture, food and abundance (GOANA), which targets food self-sufficiency by 2015. This policy further supports a 2005 policy, the national program of self-sufficiency in rice (PNAR), aiming to achieve a domestic paddy rice production of 1.5 million tons by 2012. However, Senegal is still far from achieving its goal of a 250% rice production increase per year (Diagne et al., Reference Diagne, Demont, Abdoulaye Seck and Diaw2013). In this regard, understanding the determinants of family farm crop yield and profits is essential in improving their viability and ultimately the Senegalese agricultural sector as a whole. This is the focus of the current paper.
Numerous studies have investigated the issue of farm productivity. Most of these studies consider agricultural productivity (e.g. Battese et al., Reference Battese, Malik and Gill1996; Cabas et al., Reference Cabas, Weersink and Olale2010; Cornia, Reference Cornia1985; Dorward, Reference Dorward1999; Sherlund et al., Reference Sherlund, Barrett and Adesina2002). When considering Sub-Saharan Africa, agricultural productivity improvement has been the object of particular interest in the literature on economic development and poverty alleviation (Abdulai and Huffman, Reference Abdulai and Huffman2000). Such studies have considered the effect on crop yields of weather (Blanc, Reference Blanc2012; Schlenker and Lobell, Reference Schlenker and Lobell2010), farm size (Byiringiro and Reardon, Reference Byiringiro and Reardon1996; Cornia, Reference Cornia1985), gender and plot ownership (Goetghebuer, Reference Goetghebuer2011; Guirkinger and Platteau, Reference Guirkinger and Platteau2011; Kanzianga and Wahhaj, Reference Kanzianga and Wahhaj2010), environmental conditions (Sherlund et al., Reference Sherlund, Barrett and Adesina2002), irrigation (Connor et al., Reference Connor, Comas, Macpherson and Mateos2008) or management practices (Kihanda et al., Reference Kihanda, Warren, Micheni, Bationo, Waswa, Kihara and Kimetu2007; Poussin et al., Reference Poussin, Wopereis, Debouzie and Maeght2003; Subbarao et al., Reference Subbarao, Renard, Payne and Bationo2000). Studies focusing on crop productivity along the Senegal river found that weed and N fertilizer management are major determinants of rice variability (Poussin et al., Reference Poussin, Wopereis, Debouzie and Maeght2003) and that N fertilizer application also influences rice quality (Wopereis-Pura et al., Reference Wopereis-Pura, Watanabe, Moreira and Wopereis2002). Cisse and Diallo (Reference Cisse, Diallo, Bationo, Waswa, Kihara and Kimetu2007) found that groundnuts yields are impacted by environmental stress.
The sole analysis of productivity to investigate the determinants of the performance of farms is restrictive, however, as it does not account for their financial health. An analysis of farm profits addresses this shortcoming by examining the effect of price of agricultural inputs and outputs on profits across farms. In Sub-Saharan Africa, farm profits, driving agricultural growth, have gained more recent attention due to the implementation of agricultural and economic reforms. In a study of Nigeria, Ugwumba et al. (Reference Ugwumba, Okoh, Ike, Nnabuife and Orji2010) found that farm cash income is influenced by household size, farmers’ age, education, experience, type of integration and gender and input costs. Reardon et al. (Reference Reardon, Kelly, Crawford, Jayne, Savadogo and Clay1997)'s synthesis of four case studies in Burkina Faso, Rwanda, Zimbabwe and Senegal, emphasizes the need for increased inputs, region specific strategies, off-farm employment opportunities and cash cropping programs. However, Abdulai and Huffman (Reference Abdulai and Huffman2000) argue that studies considering the effect of market indicators and household characteristics on farm efficiency are scarcer.
This study focuses on the Saint Louis region, which plays an essential role in the Senegalese agricultural production. For instance, in 2008 it produced 59% of national production (Agence Nationale de la Statistiques et de la Demographie, 2009). The population of the Saint Louis region relies traditionally on the production of one or two cash crops for income and several food crops for subsistence. This study considers the determinants of productivity and profit of all crops, and a detailed analysis of the three most cultivated crops: tomato, rice and onion. The objective is ultimately to identify constraints to agricultural improvement which would require attention in development programs in order to improve the well-being of the populations.
We describe material and methods in Section 2. The results of the analysis are presented in Section 3 and a discussion of these results is provided in Section 4. Section 5 concludes.
MATERIAL AND METHODS
Farm survey
Survey area
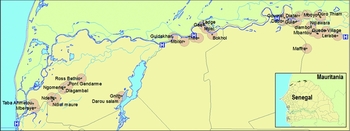
The ‘Senegalese rural household survey’ was conducted by Lépine (Reference Lépine2009) during May and June 2009 in the northern part of Senegal. This farm survey was carried out over 39 villages in three rural communities of the Saint Louis region in Senegal: Ross Béthio, Gaë and Guédé (see Figure 1). These regions are located along the Senegal river, which forms the border between Senegal and Mauritania. This river is essential to agricultural production in these regions as it allows the practice of irrigation. Most of the 110,000 inhabitants of the three rural communities considered in the survey derive their livelihoods from farming. They generally cultivate rice, tomato and onion for income, and to a small extent for their own consumption, which is complemented with several other food crops (sweet potato, bereff, corn, mango, millet, watermelon, groundnut, capsicum, eggplant, cabbage, gumbo, bean and niebe). Some of them also have cattle.
Map of the survey area. Notes: the green points represent the villages surveyed (overlapping labels for some villages are not shown). The light red circles represent the 3 km radius around villages used to estimate weather data averages. The hospitals signs respresent the location of hospitals and health centres used as proxy for urban centres.

Survey collection methods
The survey was based on interviews conducted by sixteen professional interviewers hired through the National Bureau of Statistics. Interviews were conducted in the local language (either Fula or Wolof)Footnote 1 .
The survey targeted 504 rural householdsFootnote 2 selected for their dependence on agriculture for livelihood and their membership to a farmer organization. These organizations represent important social structures in Senegal as they allow farmers to access and manage collective loans in order to finance their agricultural inputs. Their development may be attributable to market failures, rent-seeking and the presence of leadership (Arcan, Reference Arcan2002). An exhaustive survey of farmer organizations located in the three rural communities was conducted and reported 482 farmer organizations with an average size of 79 members. Based on the size of each farmer organization, the probability-proportional-to-size (PPS) method was used to sample 89 farmer organizations in the first stage, followed by the random selection of households in each farmer organization in the second stage.
All households surveyed are member of a famer organization and most of them (69%) have received a collective agricultural loan from the Senegalese agricultural development bank (CNCAS). Usually, the farmer organization will apply for a collective loan from the bank. The organization's president will then purchase the inputs depending on the needs of the members and redistribute them to every member. The farmer organization is collectively responsible for the loan and has to cover any individual default. The presence of the bank, which is necessary for most farmers, nevertheless generates negative externalities by reducing farmers’ leeway. Indeed, farmers chose to produce tomatoes, as they are more likely to obtain a loan thanks to the presence of the marketing company Senegalese Canned Food Company (SOCAS), which ensures a stable and easily accessible outlet of production. This company collects the harvest and pays the farmer's organization at a fixed price of 55 FCFA per kilo (0.11 USD). This price is, however, well below the market price of 150 FCFA. Additionally, this company has been criticized of deliberately collecting the harvest late so that the tomatoes have started losing water and weight – the appearance of the tomatoes being less of an issue for canning purposes. Farmers would therefore prefer to cultivate other crops, such as onion, which would be easier to grow, require less inputs and are easier to store than tomatoes. However, as there is no guaranteed outlet for other produces, farmers not supplying the SOCAS would not be eligible for loans from the CNCAS bank.
From the 504 farms surveyed, the cropping information was obtained over three seasons: the rainy season, the warm and dry season and the cold and dry season. The rainy season is characterized by large rainfall and spans from June to October. The dry season, from October to March, is the coldest and has very low rainfall. The warm season, from March to June, is the warmest and also has very low rainfall. 35% of the crops are cultivated during the rainy season, 21% during the dry season and 44% during the warm season.
Crop-specific data regarding inputs, such as the quantity of seed used and their origin, the amount of weeding, the quantity of fertilizer applied and its type, the quantity of insecticide, the benching technique and soil preparation technique employed are collected for each plot and season. When households did not know the exact quantity of input used, the information was sourced from the farmer organization's head that is in charge of purchasing all inputs and redistributing them to farmers. The survey also provided information on labour required and its origin (family versus employed) to tend the fields and the output obtained (number of kilograms produced). Information on the retail price of the production and the cost of the inputs are used to calculate profit generated by farmers.
In Senegal, agricultural crops are cultivated on collective or private fields. Whether the plot was collective or private (variable priv) was assessed by the number of workers working on it. While the work is mainly conducted by men, women participate in the production of cash crops on collective fields. They also cultivate separate fields, which are usually very small and consist mainly of sweet potato and onion.
Prices paid to farmers were reported by each household in FCFA per kilogram (Kg) of production for each crop cultivated and each cropping season. The price of inputs was also provided in FCFA per Kg. When this information was unknown by the farmer, the interviewer collected total costs of inputs and unit cost was subsequently estimated using information on input use.
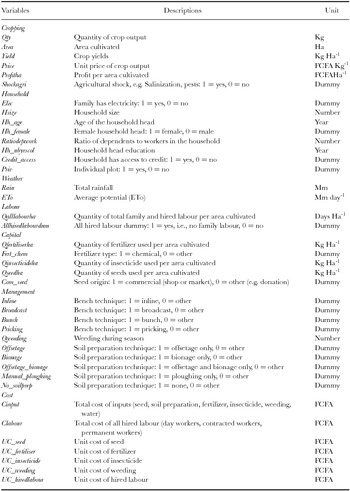
The list of variables of interest for this study is presented in Table 1.
Variables description.

>100 no decimal, >10 1 dec, V10 2 dec.
Weather data
Daily rainfall data were extracted from the RFE (version 2.0) dataset implemented by the National Oceanic and Atmospheric Administration (NOAA) – Climate Prediction Center (CPC). These data, which were generated from a combination of rain gauges and satellite observations, were available at FEWS NET Africa Data Portal at the 0.1 degree resolution (~10 km)Footnote 3 .
Daily reference evapotranspiration (ETo)Footnote 4 data at the 1 degree resolution were extracted from the National Oceanic and Atmospheric Administration's Global Data Assimilation System (GDAS). Daily ETo represents the evaporative demand of the air and was calculated using the Penman–Monteith equation following the FAO methodology (Allen et al., Reference Allen, Pereira, Raes and Smith1998).
To obtain village specific weather data, we calculated the seasonal mean of gridded ET and rain within a radius of 3km around each village.
Methodology
Crop yield determinants are investigated by estimating a production function. We assume that crop yields depend on a number of potential factors as follows:
 \begin{equation}
{\rm Yield}_c = f({\rm Weather}_c ,\,{\rm Labor}_c ,\,{\rm Capital}_c ,\,{\rm Management}_c ,\,{\rm Household}_c ),\end{equation}
where for each crop c, the dependent variable Yield is measured as the production per area cultivated. Weather includes a measure of rainfall and ETo, Labour refers to the number of workers per hectare while Capital inputs include other agricultural inputs (land, the quantity of seed, fertilizer and insecticide) as well as the place where seed were bought and the type of fertilizer used. Management includes the type of benching technique and soil preparation technique employed as well as the number of weeding conducted. To account for household specificities, we introduced the Household control variables such as the composition of labour in the household (ratiodepwork), size (hsize), access to electricity (elec), household head age (hh_age), gender (hh_female) and education (hh_nbyrscol) and whether the household has access to credit facilities (credit_access).
In order to increase the sample size, we pooled our data across all crops, but standardized crop yields of individual crops, st_yield. The function is specified as:
 \begin{equation}
{\rm st\_yield} = f({\rm Weather},\,{\rm Labor},\,{\rm Capital},\,{\rm Management},\,{\rm Household}),\end{equation}
where the explanatory variables are identical to the crop-specific regressions.
Using a profit function, we estimate the determinants of farm profitability. The profit function is specified as:
 \begin{equation}
{\rm profitha}_c = f(Y{\rm ield}_c ,\,{\rm Price}_c ,\,{\rm Cost}_c ,\,{\rm Household}_c ),\end{equation}
where for each crop c, profitha is measured as the total sale revenues minus all costs per area cultivated, Yield is the production per area cultivated, Price is the unit price of the output at the time of the sale and Cost is the unit cost of inputs and Household is the vector of control variables described above.
Similar to the production function, we estimate the profit function for all crops using the standardized yield instead of yield for each crop:
 \begin{equation}
{\rm profitha} = f({\rm st}\_{\rm yield},\,{\rm Price},\,{\rm Cost},\,{\rm Household}).\end{equation}
In addition to the control variables listed above, the type of crop produced is included in the two equations. To account for time varying fixed effects (FE), we use cropping season dummies: the rainy season (wintering), the warm and dry season (warm_season) and the cold and dry season (cold_season). We include rural district (area) dummies in order to control for time invariant unobserved characteristics of the location. The results including those FE are presented under the headers A1 and B1. For the full crop sample, we also include crop specific FE.
The statistical analysis is performed with the statistical package Stata (StataCorp, 2011). We estimate the regressions using the ordinary least squares technique. Since there are several households per village, the error term might not be independently and identically distributed. We thus cluster observation by village in order to obtain cluster-robust standard errors.
To estimate the production and profit function, we follow the specific-to-general modelling strategy, where the first specifications (with the column header ‘A’) consider detailed explanatory variables (e.g. the quantity of fertilizer employed and the type of fertilizer). The second specifications (with the column header ‘B’) reduce the set of explanatory variable to limit the specification to general factors (e.g. instead of detailing the source fertilizer, we include the quantity of fertilizer employed only).
The high correlation between explanatory variables could entail potential issues of multicollinearity. To investigate this possibility, we calculate the variance inflation factor for each model and estimate alternative specifications in the event of high collinearity (specifications A2 and B2).
RESULTS
Summary statistics
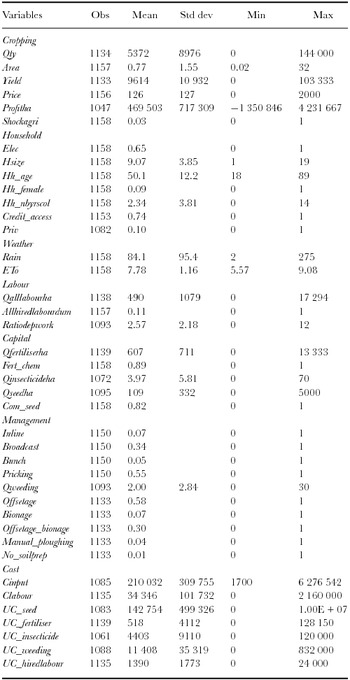
Summary statistics for the surveyed households producing rice tomato and onion are detailed in Table 2. On average, a household consists of nine individuals and there are about 2.3 dependent members per worker in the household. The household head are mainly male (91%) and received an average of 2.3 of education. 65% of the households have access to electricity.
Summary statistics for all crops.

In the sample, each household cultivates 2.3 different plots. On each plot they can produce a single crop during different seasons and/or intercrop different crops during the same season. Some households may produce up to three different crops during the three different seasons and thus have nine observations for each plot. Overall, 99% of the sampled households produce at least one crop, 66% produce two crops, and 40% produce three crops or more. The main cultivated crops are rice, tomato and onion, which are respectively produced by 88%, 50% and 42% of the households. 10% of the rice and tomato plots and 12% of the onion plots are cultivated privately, i.e., there is only one household member working on these fields. In the sample, we find that 10% of crops are private and 90% are collective fields. Among those cultivated privately, only 9% of rice plots, 4% of onion plots and 8% of tomato plots are cultivated by women.
On average, three male and two female household members work on each cultivated crop and work on average 40 and 12 days, respectively. Family workforce represents about 80% of total labour. In contrast, permanent workers, who are hired for the whole year or the whole season and who live in the household, are not very common as they work on only 9% of the sections. Contracted workers, who are hired to carry out a specific task, such as ploughing, work on 11% of the sections. However, most of the sections require day workers, which are employed on 57% of the sections. In each section, there are on average three day workers who each work on average three days, mainly during the harvest.
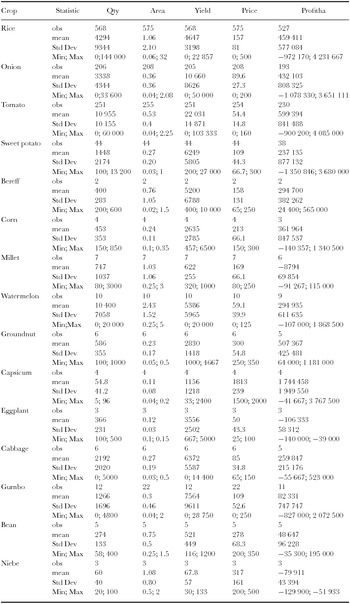
Crop statistics presented in Table 3 show that rice has the largest number of observations in the sample. It also occupied the largest crop plots with an average of 1.6 Ha, compared to 0.36 Ha for tomato and 0.5 Ha for onion. In terms of yields, the average for rice in the sample is 4,647 Kg/Ha. In comparison, the national average of rice yields reported in 2009 by FAOSTAT (2013) is 3,600 Kg/HaFootnote 5 . Yields of onion and tomato, which have a higher water content, average 10,660 Kg/Ha and 22,031 Kg/Ha respectively. These yields are lower than the national average of 25,000 Kg/Ha and 27,272 Kg/Ha (FAOSTAT 2013). Only 4% of the rice plots and 2% of onion and tomato plots are on average affected by a natural disaster (e.g. salinization, pests). Rice benefits from the largest rainfall (146 mm per season on average) essentially because rice is grown during the wet season. The largest rate of ETo is however observed on tomato plots, which are mainly grown in the semi-desert region of Fouta (76% of the tomato plots are located in the Gaë and 23% in Guédé areas). The ETo is also representative of the fact that 94% of the tomato plots were cultivated during the warm season. Tomato plots require the largest amount of labour (545 days of work). Only a small number of plots are cultivated by hired workers (12% for onion and 11% for tomato and rice on average). Tomato receives the largest amount of fertilizer and insecticide per area cultivated (998 Kg and 7 Kg respectively on average). The fertilizers used are mainly chemical (92% for rice, 91% for onion and 90% for tomato). Rice, however, has the highest seed density with 147 Kg/Ha. The majority of the seeds are purchased (94% for onion, 91% for tomato and 76% for rice). Mechanized planting is only used on 2% of the rice plots, 4% of the tomato plots and 5% of the onion plots. Tomato plots require the largest amount of weeding (three times during the warm and dry season). In terms of soil preparation, 96% of the rice fields are offsetedFootnote 6 and only 1% are bionedFootnote 7 , offseted and bioned or ploughed. Onion and tomato plots are mainly offseted and bioned (43% and 83% respectively).
Crop-specific summary statistics.

Note: Information for melon, lemon and mango are not reported in this table as there is only a single observation for each of these crops.
When considering prices, famers sell rice for 157 FCFA/Kg on average, while they only get 90 FCFA/Kg for onions and 54 FCFA/Kg for tomatoes. However, profits per hectare are on average the largest for tomatoes with 599,394 FCFA. Average profits per hectare for rice and onion are respectively 459,411 FCFA and 432,103 FCFA. The larger profit per hectare obtained for tomato is mostly explained by a selection issue as the best farmers are more likely to obtain a loan, which is mainly available to produce tomato due to the presence of a marketing company. The less performing and less risky farmers are those who did not obtain a loan to produce onion, which can explain their low profit per hectare for onion crops.
When considering the average cost of agricultural inputs per hectare (water, seed, weeding, fertilizer, insecticide and soil preparation), i.e., the total cost of inputs divided by the area of land cultivated, the highest expenses are for tomato (281,759 FCFA) and the smallest for onion (132,834 FCFA). The cost of hired labour is also on average the highest for tomatoes (50,246 FCFA) and the smallest for onion (24,010 FCFA).
Production function
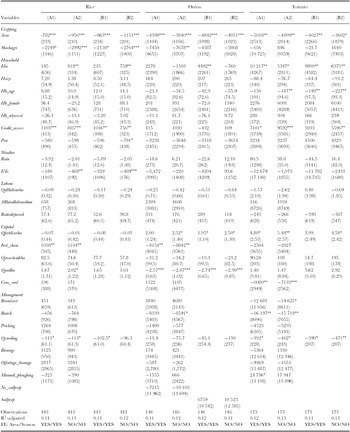
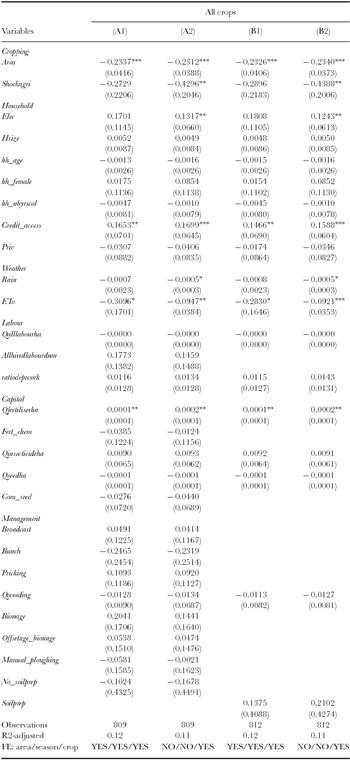
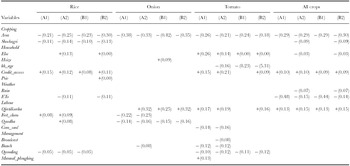
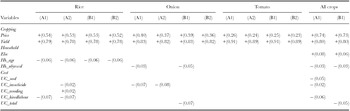
Results for the estimation of the production function are presented in Table 4 for the three main crops produced in the region and in Table 5 for all crops. In order to simultaneously provide an indication of the importance of the specified coefficients and their relative economic significance, we provide a summary of the sign of the significant explanatory variables and the associated standardized coefficients in Table 6. One should note in this regard that the figures should be interpreted as the change in the dependent variable per standard deviation increase of the explanatory variable in question.
Production function (1) results using OLS (dependent variable: yield).

Notes: robust standard errors in parentheses; ***p < 0.01, **p < 0.05, *p < 0.1; reference variable planting: inline; reference variable for soil preparation: offsetage; reference variable for season FE: wintering; reference variable for area FE: ross bethio; constant included but not reported.
Production function results (2) using OLS (dependent variable: st_yield).
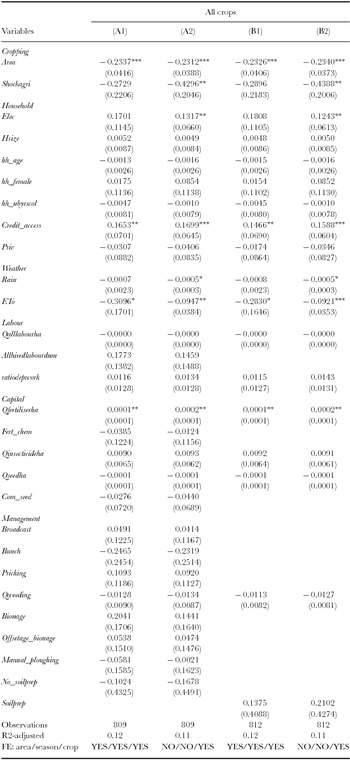
Notes: robust standard errors in parentheses; *** p < 0.01, ** p < 0.05, *p < 0.1; Reference variable for planting technique: inline; reference variable for soil preparation: offsetage; reference variable for season FE: wintering; reference variable for area FE: Ross Bethio; reference variable for crop FE: rice; constant included but not reported.
Summary of effects and standardized coefficients of significant explanatory variables from production function (1) and (2) results.

Note: The − and + signs represent the effect of coefficients for the significant variables only; standardized coefficients are provided in parenthesis in absolute value.
The first thing one may notice is that none of the ETo coefficients are significant determinants of the production functions of the three crops when including the area and season FE (specifications A1 and B1). When considering collinearity amongst explanatory variables, the variance inflation factors indicate high collinearity for the area and season FE. After removing these (specifications A2 and B2), the ETo coefficients becomes significant and negative. When considering the full crop sample (Table 5), the ETo coefficients are always significant.
On the other hand, rain is not significant in any of the regressions for the specifications A1 and A2. After removal of the season and area FE in specifications A2 and B2, the rain factor becomes significant for the full crop sample regressions.
A number of other determinants have a significant effect on the production of crops. We find that the amount of land cultivated is negatively associated with agricultural yields. Looking at the size of the impact one finds that an increase in one standard deviation of the land area reduces yields by between 0.21 (rice) and 0.42 (onion) standard deviations.
Our results also show that the number of seeds used positively and significantly impacts rice yields in specification A2. In contrast, seed quantity appears to play a detrimental role for onion production. Whether these seeds are bought on the market affects tomato yields only. Over all crops, the effect of seed quantity is not significant.
Regarding fertilizer, the use of the chemical type increases rice yields by around 0.1 standard deviations but reduces onion yields by around 0.2 standard deviations. The quantity of fertilizer is however beneficial to onion and tomato. When considering all crops, in contrast, only the quantity of fertilizer matters, resulting in an increase in yields of less than 0.15 standard deviations.
In terms of planting techniques, it appears that relative to the inline method, broadcast and bunch techniques have a lower effect for tomato productivity, reducing yields by 0.08 and 0.12 standard deviations respectively. For onion, the bunch technique reduced yields by 0.08 standard deviations compared to inline. No significant effect is found for the full sample. The soil preparation technique is important for tomato: relative to offstage, manual ploughing reduces yields by 0.13 standard deviations. We additionally find that the amount of weeding during the season has a negative impact for rice and tomato.
The event of an agricultural shock explains decreasing rice yields only without FE. In the sample considering all crops, the shockagri is significant only in specifications A2 and B2. The effect of the elec variable is also picked up by the FE for rice and the full crop sample. It is significant in all specifications for tomato yields, although the effect is relatively small. The age of the household head is significant and negative for tomato only. The size of the household is only significant for onion. Other household characteristics, such as the gender and education of the head, the size and composition of the household, have no significant effect on farm yields. The fact that a plot is private has a positive effect on productivity for rice only, although the effect is very small. Finally the access to credit is beneficial for the productivity of rice and tomato as well as for the full crop sample.
Profit function
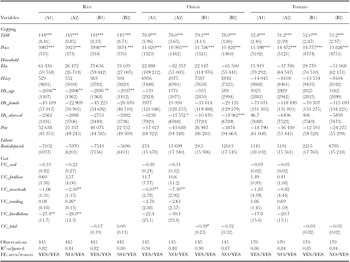
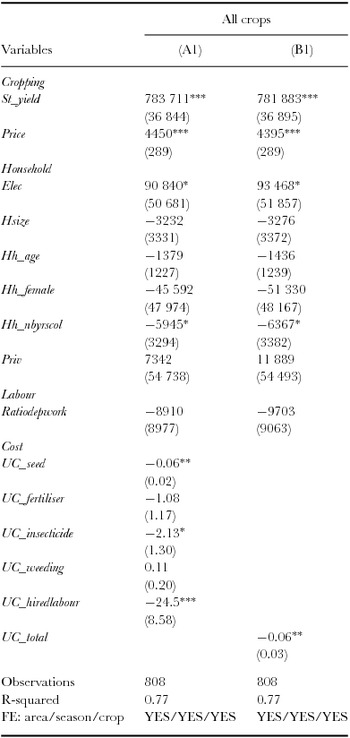
Results for the profit function regressions are presented for the detailed and reduced specifications in Table 7 for the crop-specific samples and Table 8 for the full sample. After analysis of the variance inflation factor, the area FE is excluded in specifications A2 and B2 for the crop-specific regression only. For the full sample, the variance inflation factor analysis did not detect any problem of collinearity, and therefore only the regressions A1 and B1 are presentedFootnote 8 . The corresponding standardized coefficients are provided in Table 9. As can be seen from these tables, for all three crops, price and crop yields are significant and are the most important determinants of profits per hectare. As a matter of fact, depending on the crop type, a one standard deviation change in crop yields increases profits by between 0.79 standard deviations (for rice) and 0.91 (for tomato).The effect across all crop is 0.8. While the effect of prices is substantially lower, a one standard deviation increase in price still increases per hectare profits by between 0.24 (tomato) and 0.54 (rice) standard deviations.
Profit function (1) results using OLS (dependent variable: profitha).

Notes: robust standard errors in parentheses; ***p < 0.01, **p < 0.05, *p < 0.1; reference variable for season FE: wintering; reference variable for area FE: Ross Bethio; constant included but not reported.
Profit function (2) results using OLS (dependent variable: profitha).

Notes: robust standard errors in parentheses; *** p < 0.01, ** p < 0.05, * p < 0.1; reference variable for season FE: wintering; Reference variable for area FE: Ross Bethio; reference variable for crop FE: rice; constant included but not reported.
Summary of effects and standardized coefficients of significant explanatory variables from profit function (1) and (2) results.

Note: The − and + signs represent the effect of coefficients for the significant variables only; standardized coefficients are provided in parenthesis in absolute value.
In terms of costs, we find that the unit cost of seeds only matters when considering the full sample, where a one standard deviation increase reduces profits by 0.05 standard deviations. The cost of insecticide is significant for all crops except tomato, although not to any great quantitative extent. The cost of hired labour is important for rice and the full sample. For onions, the unit cost of seeds and insecticides both reduce profits, where their impact is not too different from each. In contrast, the cost of weeding appears to enhance profitability of rice. Surprisingly, the cost of fertilizer does not influence profits.
The household specific variables show an effect similar to the production function for elec in the full sample. However, the age of the household head appears to be detrimental only for rice when considering profits. In this analysis, the number of years of education is also negative, indicating that the longer the household member attends school, the lower the agricultural profit, which can be explained by a diversion of human assets’ focus onto other activities.
The results from the reduced specifications B (considering total unit costs instead of detailed unit costs) indicate that unit cost increases entail, as expected, a decrease in profit per hectare. However, this summary variable is only significant for onion and the full sample. The adjusted R2 is also slightly higher for the detailed specification than for the reduced from. For this analysis, the availability of detailed information is important.
DISCUSSIONS
Out of all the determinants of crop yields considered, the standardized coefficients show that cultivated area is the most important factor. The negative relationship between the amount of land cultivated and agricultural yields may be due to the fact that family farms, contrary to agribusinesses, experience diseconomies of scale when cultivated area increases. Households may experience management issues when cultivating larger plots. This result is consistent with the findings of Cornia (Reference Cornia1985) and may be explained by the fact that the share of fixed in total cost of family farms is determined by the low use of equipment.
The regression results show that a better utilization of inputs, such as fertilizers, can help increase productivity. Intensification of agricultural production is necessary in a country such as Senegal to ensure sufficient food availability for local populations. However, intensification entails sustainability issues such as soil degradation, water overuse, fertilizer and pesticide pollution.
Households’ access to credit, which is used to purchase fertilizers and other inputs, are also relatively important factors for onion, tomato and the overall sample. Access to credit has a substantial importance for tomato production in particular, for which household are eligible for loans through the farmer organization. Surprisingly, a relatively more important effect of the same factor is estimated for rice despite the fact that this crop does not qualify its growers for loans. However, this effect can be explained by the fact that tomato growers use part of the inputs for other crops. This finding shows that the presence of a cooperative has incidental beneficial effects on crops other than the targeted ones.
Regarding weeding, the negative influence of the amount of weeding on crop yields is surprising and could indicate omitted variable bias as plots prone to weed invasions would require a greater amount of weeding and, in case where the care is not commensurate with the weed invasion, could result in lower yields.
The weather variables are important determinants of crop yields. The ETo coefficient is significant and negative indicating that as the ETo increases, yields are decreased. The effect of rain is negative, which may not be surprising given that crops in the study area are all irrigated, so that additional rainfall may be detrimental to crops due to root water logging or fruit damage.
By considering household characteristics (other than credit access) as control variables, the analysis shows that the age of the household head in tomato and growers is important, but the effect is negative, implying that the older the household head, the lower the yields of tomato and the lower the profit of rice. One would have expected age to be positively related to experience, but this result could be explained by better business acumen in younger household heads.
As expected, the profit function shows that price and crop yields are significant and are the most important determinants of profits per hectare for all three crops. Unit costs are slightly less important and differ widely depending on the crop type considered.
Irrigation schemes in the Senegal river valley also play an important role for crop yields and the economic prosperity of the villages (Borgia et al., Reference Borgia, García-Bolaños, Li, Gómez-Macpherson, Comas, Connor and Mateos2013; Comas et al., Reference Comas, Connor, El Moctar Isselmou, Mateos and Gómez-Macpherson2012; Connor et al., Reference Connor, Comas, Macpherson and Mateos2008; García-Ponce et al., Reference García-Ponce2013; Mateos et al., Reference Mateos, Lozano, Baba Ould Baghil, Abdoul Diallo, Gómez-Macpherson, Comas and Connor2010). In the sample surveyed, all farmers had access to irrigation for their crops, so this determinant is not included in the regression analysis.
To tests the sensitivity of our results to alternative specifications, we added additional regressions (specifications B) considering a simpler set of determinants for inputs and management practices and costs (e.g. we included soilprep combining all types of soil preparation into a single category; we removed the com_seed and fert_chem variables). The results showed similar levels of significance and quantitative effects of the explanatory variables. The availability of detailed cropping practices appears not be important in the analysis of productivity and in hindsight could have warranted a greater investment in the size of the sample surveyed rather than the detail of the questionnaires. In contrast, for the profit function, the estimations are improved when considering details regarding the cost of the different inputs. However, as no cost information specific to the detailed types of inputs (as used in the production function) were available, it is not possible to determine the importance of further refined data.
CONCLUSIONS AND POLICY IMPLICATIONS
Using a sample of 504 family farms for 2009, we have examined the determinants of crop yields and profits produced in the Saint Louis region in Senegal. Our regression analysis has unearthed a number of findings that could help development of the agricultural sector in this region. In this regard, there are a number of factors that are consistently important determinants of yields of all crops. For instance, we find that the size of the cultivated area acts to reduce yields, suggesting potential diseconomies of scale. Further improvements in management and organization might therefore allow farmers to be more productive when they are managing large areas. We also find that the development of commercialization sectors and loans could boost agricultural inputs. Our findings additionally suggest that information on planting techniques, soil preparation and management of lands could improve crop yields. However, the main agricultural inputs (insecticide, fertilizer, labour) are found to have a low effect on crop yields. This is probably explained by the fact that farms extensively using these inputs may be self-selected in the sense that they may have lower yields than the average farm. Despite these general patterns, we also found that many factors appear not to be important, or if they are, their effects are heterogeneous across crop types. For instance, while access to credit seems to matter for rice and tomato production, it has no effect on onion yields. Thus our results suggest that while eradicating imperfections in the credit system can aid some crops, for others this may not be part of the solution to greater production.
In terms of profitability, our results show that yields and prices play significant and important roles for all crops. Thus, as demonstrated earlier, while it is important to understand the main determinants of yields, it is also important to increase the bargaining power of farmers in order to increase the price of the sale.
The availability of detailed data regarding inputs does not appear to provide greater insight into the analysis of the production function, suggesting that the emphasis of later surveys be put on the size of the sample rather than the depth of the questionnaires. The profit function results, however, show that the detailed cost of each type of input is important.
More generally, several policies could be effective in order to reach self-sufficiency in Senegal. First, market imperfections such as the weakness of the credit system and the breakdown of agricultural inputs supply act as barriers to self-sufficiency (de Mey et al., 2012). In fact, policies allowing increased access to loans to buy agricultural inputs will have a positive effect on yields. Additionally, the monopoly of the commercialization sector for tomato (SOCAS) distorts incentives and prevents farms from reaching pareto-optimality regarding the type of crop that should be produced. More importantly, the absence of several commercialization sector results in a very low bargaining power of farmers who are price takers. Farmers should also try to sell off their output on other markets, such as on the Saint Louis, Podor Richard toll and Dakar markets. This may require a better organization of farmers but could be possible thanks to the use of information and communication technologies (ICT). ICT are needed in the current context of asymmetric information in order to prevent traders to exploit farmers’ ignorance of market price (Courtois and Subervie, Reference Courtois and Subervie2013; Munyua et al., Reference Munyua, Adera and Jensen2009). Finally, the salinization of agricultural lands is an issue for many villages, such as the Ross Béthio rural community. Other covariant risks affecting the area, such as bird damages, have a strong negative effect on plots yields and profit. Insurance schemes should be developed in order to protect households experiencing a loss of production. Further research is also needed to investigate the effectiveness of the introduction of agricultural insurance.