Whole genome sequencing (WGS) has been used to inform relatedness of bacterial isolates in a number of outbreaks, including tuberculosisReference Gardy, Johnston and Ho Sui 1 and Escherichia coli O104:H4.Reference Rasko, Webster and Sahl 2 Retrospective studies used the same technology to assess outbreaks of methicillin-resistant Staphylococcus aureus Reference Koser, Holden and Ellington 3 and multiresistant Klebsiella pneumoniae Reference Stoesser, Giess and Batty 4 in neonatal units. The potential for this technology is great in real-time management of ward-based outbreaks. For organisms such as Pseudomonas aeruginosa, which are ubiquitous in the environment, it can be difficult to determine the source of an outbreak using traditional methods. However, WGS has been used to describe long-term outbreaks of P. aeruginosa Reference Snyder, Loman and Faraj 5 , Reference Witney, Gould and Pope 6 and can show evolution in the organism over time.
There is particular concern about transmission of P. aeruginosa on a neonatal unit because infants who develop invasive infection with this organism have high mortality rates.Reference Stoll, Hansen and Fanaroff 7 , Reference Gordon and Isaacs 8 The neonatal unit cares for newborns who are often very premature, have low birthweight, and are unwell. In these infants, P. aeruginosa can cause a wide range of illness, including eye infections, skin infections such as ecythema gangrenosum, bloodstream infections, meningitis, pneumonia, and necrotizing enterocolitis.Reference Foca, Jakob and Whittier 9 It is difficult to determine what proportion of colonized infants will become infected with P. aeruginosa, but 2 studies describing paired surveillance blood cultures and swabs in neonatal units in Estonia and Bangladesh both showed rates of bacteremia of 14% in babies who were colonized with P. aeruginosa.Reference Choi, Saha and Ahmed 10 , Reference Parm, Metsvaht and Sepp 11
P. aeruginosa outbreaks in the literature are commonly associated with an environmental source, particularly sinks and other wet areas.Reference Crivaro, Di Popolo and Caprio 12 – Reference Walker, Jhutty and Parks 14 A variety of contaminated equipment has been associated with outbreaks, but healthcare workers have also been reservoirs of Pseudomonas.Reference Foca, Jakob and Whittier 9 , Reference Widmer, Wenzel, Trilla, Bale, Jones and Doebbeling 15 Because of the potential for mortality associated with outbreaks of P. aeruginosa on a neonatal unit, a rapid response is required to stem transmission of the organism to further infants. When an outbreak of P. aeruginosa occurred on our neonatal unit, we used WGS to understand the likely origin of the outbreak and to guide infection control interventions.
METHODS
The study was initiated when an increase in the number of babies colonized with P. aeruginosa was noted on the neonatal unit of Royal Prince Alfred Hospital, a major obstetric tertiary referral center for Sydney, Australia. The hospital currently averages approximately 5,500 deliveries per year and covers an inner-city, multicultural population. It accepts in-utero and ex-utero transfers from around the state and overseas. It provides a level 5 neonatal intensive care unit service 16 with an average of approximately 900 admissions to the nursery each year. The unit consists of 34 beds, comprising 10 level 3 beds (ventilation, or “neonatal intensive care unit”) and 24 level 2 beds (divided into 2 sections, high-dependency unit and special care nursery).
An incident case was defined when P. aeruginosa was isolated in cultures of samples obtained from any body site, including cases detected by active surveillance in March and April 2014. The incidence rate per 1,000 patient-days was calculated.
Infants cared for on the neonatal unit who received respiratory support were routinely screened with a weekly culture from a nasal swab if receiving noninvasive ventilation or by means of endotracheal aspirate if intubated. This has been a long-standing practice of the unit aimed at identifying any pathogens colonizing an infant’s nasopharynx, to help guide subsequent antibiotic therapy if that infant becomes septic. If antibiotic-resistant organisms, such as methicillin-resistant S. aureus, are detected, colonized infants are nursed with contact precautions. Swabs were plated onto horse blood agar (Thermo Fisher Scientific) that was incubated for 24 hours. Likely pathogens were identified by matrix-assisted laser desorption/ionization–time-of-flight mass spectrometer (Microflex, Bruker Daltonics) and susceptibility testing was performed using the Vitek 2 system (bioMérieux). In early March 2014 a marked increase in the number of babies colonized with P. aeruginosa was recognized. On review, it was noted that one baby had developed respiratory infection with P. aeruginosa in January. The strain isolated in January was not available for typing, but a subsequent isolate from the same infant was available, along with isolates from other infants as detailed below.
Surveillance Cultures
Enhanced screening of babies was then introduced; all babies on the unit were screened weekly with a nasal swab as above. Over the course of the outbreak, 18 babies were found to be colonized with P. aeruginosa.
Environmental Swabbing
Swab samples were taken from areas of concern in the unit, including the following areas at all sinks: drains, ends of faucets (aerators), splashbacks at point of meeting sink, damp areas of floor under the sink, soap dispensers on wall above sinks. The patient areas of colonized babies were also swabbed, including doors of the crib/isolette, keyboard, bench, and phone. An ultrasound machine, including probes and ultrasound gel bottle, that was used and stored on the unit was also swabbed.
Specimens were inoculated onto horse blood agar and Chromogenic UTI agar (Thermo Fisher Scientific), incubated at 35°C, and examined for growth at 24 and 48 hours. Isolates of P. aeruginosa were tested as described above.
Whole Genome Sequencing
Sequenced isolates were given sequential numbers with the prefix Pa (P. aeruginosa). Genomic DNA from all initial isolates were sequenced (n=19) using the Ion Torrent Personal Genome Machine (Thermo Fisher Scientific) per manufacturer’s instructions. Subsequent reads were aligned against P. aeruginosa reference genome PA01 (GenBank no. AE004091) in CLC Genomics Workbench, version 7.0.4 (Qiagen). Single nucleotide variants were identified using a quality-based algorithm filtering for homopolymers and manually curated to ensure accuracy. Unmapped reads were blasted (nucleotide-nucleotide basic local alignment search tool [BLASTn]) against the National Center for Biotechnology Information nonredundant database to ensure that accessory genomes were similar in closely related isolates. In silico multilocus sequence typing (MLST) was performed on all isolates using the mapped allele regions against the P. aeruginosa MLST database (http://pubmlst.org/paeruginosa/). Phylogenetic relationships were established using a core single-nucleotide polymorphism (SNP) tree, which was constructed and visualized using kSNP, version 2.1,Reference Gardner and Hall 17 and FigTree, version 1.4 (http://tree.bio.ed.ac.uk/software/figtree/), respectively. Enterobacterial repetitive intergenic consensus (ERIC) polymerase chain reaction (PCR) typing was performed on subsequent environmental isolates (n=32, all after the outbreak) to confirm indicated biodiversity (from WGS) and determine whether the outbreak strain was still detectable in the neonatal unit environment.
Factors associated with colonization were evaluated using the Fisher exact test.
RESULTS
Incident Cases
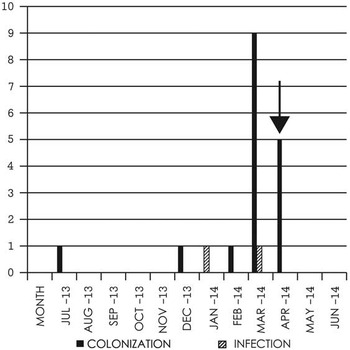
Between March 2013 and February 2014 the monthly incidence of P. aeruginosa colonization ranged between zero and 2.3/1,000 patient-days. In March it rose to 11.4/1,000 patient-days. A total of 18 babies were included in the outbreak investigation, with incident colonization occurring between January and April 2014 (see Figure 1 for incident cases). P. aeruginosa was isolated from the eyes of 4 babies and respiratory specimens (nasal swab samples) in all 18 babies colonized. One of the 18 babies (the presumed index case) was diagnosed with P. aeruginosa pneumonia based on chest radiograph abnormalities, increased requirements for respiratory support, raised C-reactive protein, and culture of P. aeruginosa from an endotracheal aspirate. During the outbreak, babies colonized with P. aeruginosa were more likely to have received some sort of respiratory support (89% vs 62%, P =.042) and to have lower birthweights (birthweight <1,500 g, 56% vs 26%; P =.021). Birth weights of colonized babies ranged from 756 to 3,281 grams. Overall 28% of colonized babies had P. aeruginosa isolated from clinical cultures of eye swab samples and an endotracheal aspirate collected owing to symptoms of eye discharge and pneumonia, respectively. P. aeruginosa was isolated from surveillance swabs only in 72% of the infants. All isolates were susceptible to routine anti-pseudomonal antibiotics.
Incident cases of Pseudomonas aeruginosa colonization or infection on the neonatal unit July 2013 to June 2014. The arrow indicates timing of interventions around the sink.

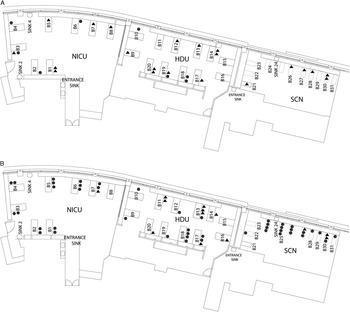
Infants who became colonized had been cared for in each section of the unit (neonatal intensive care unit, high-dependency unit, and special care nursery). The initial 7 babies were colonized whilst in the neonatal intensive care unit, requiring the highest level of care, although several moved rapidly to other areas of the unit owing to changing care needs. Figure 2 shows the placement of colonized infants in the unit.
Distribution of patients throughout the ward. A, From February 25, 2014, to March 17, 2014 (3-week period), showing each infected/colonized patient as a circle versus the non–infected/colonized patients as triangles. For example, bed 3 had 2 patients from February 25, 2014, to March 17, 2014, one infected/colonized patient shown by a circle and one not infected/colonized shown by a triangle. B, From March 18, 2014, to April 29, 2014 (6-week period), highlighting the increase in infected/colonized patients shown in circles and the spread throughout all 3 units during this time frame as opposed to Fig. 2A. HDU, high-dependency unit; NICU, neonatal intensive care unit; SCN, special care nursery.

Environmental Swabbing
P. aeruginosa was isolated from 8 sinks, including 4 sink drains and 5 sink splashbacks; no other environmental swabs grew P. aeruginosa. The majority of isolates were susceptible to routine anti-pseudomonal antibiotics.
WGS and Typing of Isolates
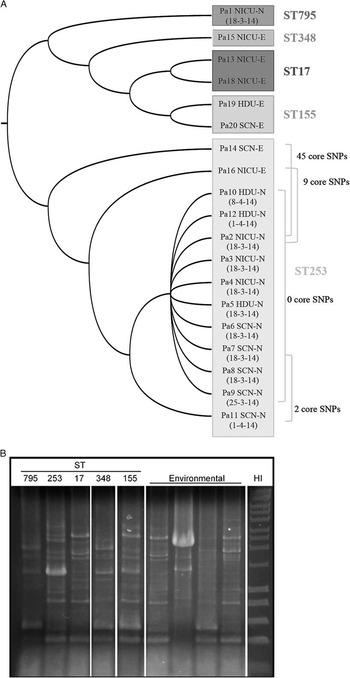
Isolates from 12 babies and 7 environmental isolates from different sources were typed using WGS. There was no isolate available from January, before the outbreak was recognized, and 6 infants who developed colonization later in the outbreak did not have their isolates typed. An average coverage of 33-fold was obtained for isolates that underwent WGS with 95% mapped to the P. aeruginosa PA01 reference genome. Except for Pa1, all clinical isolates clustered in ST253 (Figure 3a), and no differences were detected between unmapped reads. In this regard, 2 environmental isolates (obtained from 2 separate sinks) also clustered within ST253 (Pa16 and Pa14 in Figure 3a), but they differed from the outbreak strains by 9 and 45 SNPs, respectively. In general, however, environmental isolates revealed several MLST types (Figure 3a), indicating a large diverse bioburden within the unit. This was subsequently supported by ERIC-PCR typing of 32 additional post-outbreak environmental isolates (from different sources) because a number of different banding patterns were observed (Figure 3b); note that since no further ST253 environmental isolates were identified via this rapid screen, additional WGS was not performed.
Phylogenetic relationships and typing of nasal (N) and environmental (E) isolates. Sequenced isolates are given sequential numbers with the prefix Pa (Pseudomonas aeruginosa). A, P. aeruginosa sequence types (STs) are grouped and relationships are derived from core single-nucleotide polymorphism (SNP) differences, which are shown to the right of the Maximum Likelihood tree where relevant. Pa numbering reflects the isolate number and location in the special care nursery (SCN), neonatal intensive care unit (NICU), or high-dependency unit (HDU). Isolation dates are shown in brackets. B, Example enterobacterial repetitive intergenic consensus–polymerase chain reaction profiles of STs defined via whole genome sequencing (for both nasal and environmental isolates) and additional environmental isolates. Note that all nasal ST253 isolates displayed identical profiles. HI, Hyperladder I (Bioline).

Infection Control Measures
Further infection control measures were initiated in mid-March, including assessment of compliance with hand hygiene for all healthcare workers, cohorting of babies colonized with Pseudomonas, changing of the faucet ends (aerators) of all taps, replacement of all hand hygiene (handwash solution, alcohol-based handrub, hand moisturizer) dispensers, daily bleach cleaning of all sinks, and ongoing prevalence screening with weekly nasal swabs from all babies on the unit. Parents were informed about the outbreak and reminded about infection control measures such as hand washing. Hand hygiene compliance was consistently very high as judged by audit against the World Health Organization “5 Moments.” 18
The outbreak abated by mid-April 2014 (see Figure 1). No further P. aeruginosa colonization was detected on the unit in the following 4 months.
DISCUSSION
An increased rate of P. aeruginosa colonization in the neonatal unit was recognized on the basis of clinical microbiological testing and surveillance swabs. Although the presumed index case had pneumonia, there was no mortality associated with this outbreak. On the basis of WGS, we were able to show that most of the available clinical isolates were identical, but, importantly we were also able to demonstrate that the strain carried by 1 infant was not part of the outbreak. This would not have been otherwise recognized because the isolates shared the same antibiotic susceptibility pattern. For infection control purposes, the ability to quickly exclude a patient from an outbreak is as important as the recognition of isolates that are related. Transmission events can be evaluated to prevent further transmission, and infection control measures can be appropriately targeted.
The tight clustering of most of the clinical isolates was consistent with an outbreak of P. aeruginosa colonization with a common source. WGS data suggested that the outbreak strain arose from a common ancestor to isolate Pa16. Previous reports suggest a molecular clock rate for P. aeruginosa of one SNP every 3-4 months,Reference Snyder, Loman and Faraj 5 , Reference Quick, Cumley and Wearn 19 which would suggest that the outbreak isolate arose from the common ancestor approximately 2–3 years previously. However, there is some variability in the estimates of mutations rates, and we were unable to determine mutation rates over time in our unit because older isolates were unavailable for comparison. The source of the outbreak strain was likely the sink drain from which Pa16 was isolated. Further attempts were made to isolate the outbreak strain but despite more intensive sampling of the faucet no identical isolates were obtained (data not shown). We would expect a diversity of genotypes to have arisen from the common ancestor over time and this may explain our inability to identify the outbreak strain from amongst the multiple strains isolated from the sink. An alternative explanation is that the outbreak isolate was introduced into the unit by staff or family members; however, this seems unlikely given the phylogenetic relationships. Also, the outbreak was only terminated following closure of the sink isolating Pa16.
ERIC-PCR was performed on post-outbreak environmental isolates in order to rapidly (and cost-effectively) confirm the unit’s bioburden, as indicated by WGS. However, while ERIC typing has been shown to correlate with MLSTReference Kidd, Grimwood, Ramsay, Rainey and Bell 20 and is thus useful for such screening, it does not have the same capacity (as WGS) to resolve isolate relationships. In this regard, WGS allowed us to distinguish between isolates that would have otherwise been considered part of the outbreak by other methods (ie, ERIC-PCR, MLST). Environmental isolate Pa14 was ST253, and so by MLST would have been considered a likely source for the clinical isolates. It differed from these isolates by 45 SNPs and so we excluded it as a probable source.
The ability of WGS to distinguish between the high number of P. aeruginosa strains on the unit and the one causing an outbreak helped us target infection prevention interventions to control the outbreak whilst limiting both cost and interruption of the function of the unit. In general, PCR-based screening/typing schemes provide limited information on defined targets and often require Sanger sequencing, which can subsequently increase turn-around times (especially if outsourced). In this study, by using the Personal Genome Machine (Ion Torrent), WGS data was generated (in-house) within 2 days at a cost of approximately AUD250 per isolate. Although this is currently more expensive (per isolate) than traditional typing methods, WGS provides superior resolution and additional genetic information (eg, antibiotic resistance genes/mutations, virulence genes) that is clinically important when managing an outbreak.
The absolute discriminatory power of WGS is one of its advantages, along with the reproducibility and digital nature of the sequence data that allow information to be shared at a local, national, or international level, and the potential to identify antibiotic resistance genes/mutations (especially ones that do not fit local trends).Reference Relman 21 , Reference Espedido, Steen and Ziochos 22 The ability to use the same technique for any organism makes WGS a broadly applicable technique compared with other molecular testing methods. Considering the falling costs of obtaining sequences, it is likely that WGS will become an important tool in infection prevention and control.
Many others have shown sinks, taps, and drains to be sources of Pseudomonas outbreaks.Reference Crivaro, Di Popolo and Caprio 12 – Reference Walker, Jhutty and Parks 14 , Reference Hota, Hirji and Stockton 23 – Reference Loveday, Wilson, Kerr, Pitchers, Walker and Browne 25 Frequently, replacement of sinks and plumbing has been necessary to eradicate Pseudomonas.Reference Loveday, Wilson, Kerr, Pitchers, Walker and Browne 25 Splashing of contaminated water from sinks to equipment and work surfaces in the unit or potentially to the hands of healthcare workers was felt to be the likely mechanism of spread to babies. Hota et alReference Hota, Hirji and Stockton 23 have shown spread of drain contents to at least a meter around hand hygiene sinks, albeit sinks with a design different from ours. We were particularly concerned that the design of the sink splashback, with tile and grouting that were difficult to clean effectively, encouraged contamination of the area with Pseudomonas. The sinks were replaced along with splashbacks that were in one piece and easier to clean. In the following 6 months, only 2 infants were found to be colonized with P. aeruginosa, and one of these had an organism that differed phenotypically from the outbreak isolate.
A limitation of this study is the lack of isolates from early in the outbreak available for typing. Earlier clinical and environmental isolates may have provided more information to link, or to refute a connection between, clinical and environmental isolates.
Previously, P. aeruginosa outbreaks have been followed retrospectively over time with WGS.Reference Snyder, Loman and Faraj 5 , Reference Witney, Gould and Pope 6 There have been reports of the use of WGS to retrospectively analyze an outbreak of methicillin-resistant S. aureus in a neonatal unitReference Koser, Holden and Ellington 3 and to investigate clusters of methicillin-resistant S. aureus and Clostridium difficile in adult wards in real time.Reference Eyre, Golubchik and Gordon 26 However, we were able to show that WGS can be used in real time to make a meaningful contribution to the management of an outbreak of P. aeruginosa.
WGS allowed us to demonstrate that there was a true outbreak of ST253 P. aeruginosa, though not all colonized babies were part of the outbreak. WGS suggested that a sink was a likely source and allowed us to focus infection control activities on the sinks. We were able to access WGS in a clinically relevant time frame to be useful during the outbreak. As WGS becomes more available in clinical laboratories, the superior discriminatory power of this method makes it a powerful tool in infection control.
Acknowledgments
Financial support. None reported.
Potential conflicts of interest. All authors report no conflicts of interest relevant to this article.