Introduction
Models suggest that animals actively choose between habitats so that they live in the habitat offering the greatest possible fitness rewards (Fretwell and Lucas Reference Fretwell and Lucas1969; Rosenzweig Reference Rosenzweig1981; Morris Reference Morris1988, Reference Morris2011). An understanding of habitat selection allows for effective conservation and management planning (Morris Reference Morris2003). The most famous and most often used model in habitat selection is the ideal free distribution (Fretwell and Lucas Reference Fretwell and Lucas1969). Under an ideal free distribution, fitness in a habitat declines with density, and individuals select the habitat offering the greatest fitness rewards, such that mean fitness of all individuals is equal in each habitat at equilibrium. The ideal free distribution assumes that individuals have equal competitive abilities, have an ideal knowledge of the quality and distribution of habitats and of the distribution of competitors between those habitats, and are free to move between all habitats. These assumptions are often unrealistic (Kennedy and Gray Reference Kennedy and Gray1993), and later models relaxed many of these assumptions (reviewed in Tregenza Reference Tregenza1995), yet the ideal free distribution has been demonstrated to hold in many animals, including Insecta (Krasnov et al. Reference Krasnov, Khokhlova and Shenbrot2003, Reference Krasnov, Khokhlova, Burdelova, Mirzoyan and Degen2004; Lerner et al. Reference Lerner, Sapir, Erlick, Meltser, Broza and Shashar2011), Actinopterygii (Rodríguez Reference Rodríguez1995; Haugen et al. Reference Haugen, Winfield, Vøllestad, Fletcher, James and Stenseth2006; Knight et al. Reference Knight, Morris and Haedrich2008; Falcy Reference Falcy2015), Squamata (Calsbeek and Sinervo Reference Calsbeek and Sinervo2002; Paterson and Blouin-Demers Reference Paterson and Blouin-Demers2018), Aves (Fretwell Reference Fretwell1969; Fretwell and Calver Reference Fretwell and Calver1969; Jensen and Cully Reference Jensen and Cully2005; Zimmerman et al. Reference Zimmerman, Gutiérrez, Thogmartin and Banerjee2009), and Mammalia (Rosenzweig and Abramsky Reference Rosenzweig and Abramsky1986; Morris Reference Morris1988; Morris et al. Reference Morris, Dupuch and Halliday2012). Insects that rely heavily on particular food sources, such as phytophagous insects that choose host plants for both foraging and oviposition (Mayhew Reference Mayhew2001; Scheirs and de Bruyn Reference Scheir and de Bruyn2002; Knolhoff and Heckel Reference Knolhoff and Heckel2014), may be ideal organisms for studying the ideal free distribution. The ideal free distribution is also the theoretical backbone for recent advances in habitat selection models (Krivan Reference Krivan2014; Cressman and Tran Reference Cressman, Tran, Cojocaru, Kotsireas, Makarov, Melnik and Shodiev2015; Matthiopoulos et al. Reference Matthiopoulos, Fieberg, Aarts, Beyer, Morales and Haydon2015).
Density-dependent habitat selection is an extension of the ideal free distribution that takes changes in population density into account (Fretwell and Lucas Reference Fretwell and Lucas1969; Rosenzweig Reference Rosenzweig1981; Morris Reference Morris1988). Density-dependent habitat selection inherently relies on the negative density dependence of fitness in each habitat (Rosenzweig Reference Rosenzweig1981; Morris Reference Morris1988). Researchers can use habitat isodars to compare population densities of a species in two habitats (Morris Reference Morris1988). Isodars compare the density of individuals in pairs of habitats using geometric mean regression to examine preference between two habitats. Geometric mean regression is used rather than ordinary least squares regression because both x and y are dependent on one another. Isodars start from the assumption that fitness in a habitat decreases as population density increases, and individuals in a population are attempting to meet an ideal free distribution through their habitat selection (Morris Reference Morris1988, Reference Morris1989; Moses et al. Reference Moses, Morris and Qin2013). Systems that allow for the collection of fitness data and habitat selection data can provide a unique test of habitat selection models by allowing the construction of predictive isodars with fitness data, and then testing the predictions with habitat selection data (Morris Reference Morris1989; Moses et al. Reference Moses, Morris and Qin2013). Isodars have been used to examine habitat selection in field tests with small Mammalia (Morris Reference Morris1989; Morris et al. Reference Morris, Dupuch and Halliday2012), large Mammalia (Vijayan et al. Reference Vijayan, Morris and McLaren2012), Actinopterygii (Rodríguez Reference Rodríguez1995; Knight et al. Reference Knight, Morris and Haedrich2008), Aves (Tarjuelo et al. Reference Tarjuelo, Traba, Morales and Morris2017), Squamata (Halliday and Blouin-Demers Reference Halliday and Blouin-Demers2016a; Paterson and Blouin-Demers Reference Paterson and Blouin-Demers2018), and in laboratory tests with Insecta (Halliday and Blouin-Demers Reference Halliday and Blouin-Demers2014) and Diatoms (Moses et al. Reference Moses, Morris and Qin2013).
Habitat quality can be affected by many factors, including quantity and quality of food, quantity and quality of sites for nesting, basking, or refuge, as well as the abundance of competitors or predators. All of these factors can affect fitness in different ways. For example, habitats with more cover allow for higher fitness in prairie voles (Microtus ochrogaster (Wagner) (Rodentia: Cricetidae)), and voles show a strong density-dependent preference for high-cover habitats (Lin and Batzli Reference Lin and Batzli2002). Similarly, ornate tree lizards (Urosaurus ornatus (Baird and Girard) (Squamata: Phrynosomatidae)) show a strong density-dependent preference for habitats with higher thermal quality and higher prey abundance, which are intimately linked to individual fitness (Paterson and Blouin-Demers Reference Paterson and Blouin-Demers2018).
Red flour beetles (Tribolium castaneum (Herbst) (Coleoptera: Tenebrionidae)) also show strong density-dependent preferences for certain habitats. Differences in temperature between habitats lead to higher fitness in the thermally superior habitat for red flour beetles (Halliday and Blouin-Demers Reference Halliday and Blouin-Demers2014, Reference Halliday and Blouin-Demers2015, Reference Halliday and Blouin-Demers2018; Halliday et al. Reference Halliday, Thomas and Blouin-Demers2015), which then lead to a significant preference for the high-thermal-quality habitat (Halliday and Blouin-Demers Reference Halliday and Blouin-Demers2014). In this study, we examine the effect of food quality on fitness and habitat selection by red flour beetles to test the hypothesis that patterns in habitat selection are based on density-dependent patterns in fitness in each habitat. More specifically, we predict that habitats made of different flour types will lead to differences in fitness, and that density-dependent patterns in fitness will dictate density-dependent patterns in habitat selection. While this hypothesis has been assessed in a variety of systems, this is the first test with red flour beetles using isodars. Red flour beetles, as well as their sister-species-confused flour beetles (T. confusum Jaquelin du Val), have been studied in the laboratory for over 80 years (Chapman Reference Chapman1928; Holdaway Reference Holdaway1932; Park Reference Park1932). Tribolium MacLeay species make ideal study species because they are very easily reared under laboratory conditions and have short generation times (4–5 weeks). For instance, Tribolium have been used for laboratory experiments on demography (Holdaway Reference Holdaway1932; Park Reference Park1932), habitat selection (King and Dawson Reference King and Dawson1973; Korona Reference Korona1990), interspecific competition (King and Dawson Reference King and Dawson1973), egg cannibalism (Flinn and Campbell Reference Flinn and Campbell2012), oviposition behaviour (Campbell and Runnion Reference Campbell and Runnion2003), and anti-predator behaviour (Miyatake et al. Reference Miyatake, Katayama, Takeda, Nakashima, Sugita and Mizumoto2004). Flour beetles use flour as both a substrate for burrowing and as food at all life stages (Good Reference Good1936). Female beetles lay eggs in patches of flour, and these eggs hatch into larvae. At optimal temperature and humidity, the larval stage lasts four weeks (W.D.H., unpublished data). The larvae then transform into pupae and stay in the pupal stage for about one week. Adult beetles can live for long periods in the laboratory (more than 24 weeks in one study; Halliday and Blouin-Demers Reference Halliday and Blouin-Demers2017), but reproductive senescence occurs around 15 weeks (Halliday and Blouin-Demers Reference Halliday and Blouin-Demers2017).
Methods
Study system
We started our colony of red flour beetles (Tribolium castaneum) from 200 individuals that we obtained from Carolina Biological Supply Company (Burlington, North Carolina, United States of America) two years before our experiment. We maintained the beetles in large cultures containing 95% all-purpose wheat flour and 5% brewer’s yeast. Brewer’s yeast was added to the flour as a source of protein. We maintained the cultures at 30°C and 70% humidity, with a 12:12-hour light–dark cycle. In all our experiments, we compared three types of flour: wheat (Triticum Linnaeus (Poaceae)) flour, corn (Zea mays Linnaeus (Poaceae)) flour, and soy (Glycine max (Linnaeus) Merrill (Fabaceae)) flour. We mixed all flour with 5% brewer’s yeast to maintain consistency with the wheat flour and yeast mixture that the beetles were reared on. Wheat flour is the standard food source for experiments with red flour beetles (Chapman Reference Chapman1928; Holdaway Reference Holdaway1932; Park Reference Park1932; Howe Reference Howe1956; Korona Reference Korona1990; Halliday and Blouin-Demers Reference Halliday and Blouin-Demers2014). Corn flour is a lower-quality food source for flour beetles, although they still use it (King and Dawson Reference King and Dawson1973). Red flour beetles have higher reproductive rates in wheat than in corn flour, and are more often found in wheat flour when both flour types are available (King and Dawson Reference King and Dawson1973). Soy flour is a very poor food source for flour beetles (Mickel and Standish Reference Mickel and Standish1947), but can be used as a substrate for tunnelling and hiding, so may still provide fitness benefits. These three types of flour should therefore provide varying levels of fitness benefits and, thus, the beetles are expected to display a clear hierarchy of preference: wheat > corn > soy.
Fecundity experiment
We examined the fecundity of beetles in three types of flour (wheat, corn, and soy). We randomly selected beetles from our large culture, assuming a 1:1 sex ratio (W.D.H., unpublished data), and placed them in a petri dish (10 cm diameter) with 2.5 mL of the appropriate flour that had been pre-sifted through a 250-μm sieve to aid in egg detection. We used volumetric measurements of the different flours because it is the most efficient way to measure large quantities of flour, and does not lead to large variations in mass. For example, we measured the mass of 2.5 mL of wheat flour 10 times and found that the mass was 1.36 ± 0.01 g (mean ± standard error). We assumed that variations for corn and soy flour mass would be similar. We repeated this process for three density treatments (10, 30, and 50 beetles) for each food treatment to examine negative density dependence of fitness in each food type. We replicated each treatment 10 times. We then placed the petri dishes in an environmental chamber set to 30 °C because it is the optimal temperature for egg-laying in red flour beetles (Halliday and Blouin-Demers Reference Halliday and Blouin-Demers2014, Reference Halliday and Blouin-Demers2015, Reference Halliday and Blouin-Demers2017). After 48 hours, we sifted the flour through a 250-μm sieve and counted the number of eggs that had been laid. The 48-hour period allowed the beetles time to acclimate to their treatment containers and for more than 10 eggs to be laid in each treatment container (W.D.H., unpublished data).
Although our assumption of a 1:1 sex ratio should hold, on average, in all density treatments, individual replicates would be more likely biased towards one sex or the other in the lowest density treatment than in the highest density treatment. This bias in sex ratio would introduce variation into our fecundity results, and variation would be larger at lower densities. However, based on pilot trials where we controlled sex ratio (W.D.H., unpublished data), we do not think this variation in sex ratio would introduce significant variation into our experiment.
We analysed per-capita fecundity (number of eggs laid/density) using multiple linear regression in R (package: stats; function: lm; R Core Team 2014) with food treatment, density, and their interaction as independent variables. We compared models with and without the interaction term, and with different combinations of the main effects, and used the Akaike Information Criteria corrected for small sample size to compare models (package: qpcR; function: AICc; Spiess Reference Spiess2014), and selected the model with the lowest Akaike Information Criteria corrected for small sample size as the best model. When models were within two units of each other, and were therefore competing, we used model averaging to determine the final parameter values (Burnham and Anderson Reference Burnham and Anderson2002).
Population growth experiment
We followed up the fecundity experiment with an experiment examining the population growth of beetles in each food source, which is a more ultimate metric of fitness than fecundity. We placed five replicates of three starting densities (10, 30, and 50) of beetles in petri dishes with 15.0 mL of each flour type in a fully factorial design, and then placed these petri dishes in an environmental chamber set to 30 °C. After six weeks, we counted the number of living adults, pupae, and larvae in each dish. We chose six weeks because this is one week longer than the typical generation time for this species under optimal conditions (Halliday et al. Reference Halliday, Thomas and Blouin-Demers2015).
We analysed population growth in two ways. First, we analysed the difference between the number of adults at the beginning and at the end of the experiment using multiple linear regression, with starting density, food treatment, and their interaction as independent variables. Second, we examined the total population size after six weeks (sum of the number of adults, pupae, and larvae) with the same independent variables as in the first analysis. We used two analyses because the total number of adults provides information about the number of new individuals in reproductive condition, and the total number of all individuals provides information on the potential of the population to continue growing into the future that may not be captured by the total number of adults. In addition, the total number of adults is a useful metric because it provides information on generation time in each type of flour that is not provided by the total number of all individuals. We used Akaike Information Criteria corrected for small sample size to select the best model with the same suite of competing models as in the fecundity analysis.
We did not analyse the total number of adults and the total number of individuals as per-capita metrics (unlike in the fecundity experiment) because the six-week period of this experiment could mean that up to three generations of beetles are represented in the data. Adult beetles can emerge in just five weeks (Halliday et al. Reference Halliday, Thomas and Blouin-Demers2015), which means that some of the larvae that we counted could be offspring of these new adults. Per-capita metrics of reproduction imply that all individuals that are included in the metric are the offspring of a single parent, but this may not be the case for the data from this experiment.
Habitat selection experiment
We examined the habitat selection of red flour beetles between pairs of flour patches (2.5 mL of flour) that were wheat, corn, or soy flour; we examined all three combinations of flour types in binary comparisons. We only used female red flour beetles for this experiment because males produce an aggregation pheromone (Suzuki Reference Suzuki1980), which has the potential to obscure habitat selection patterns (Halliday and Blouin-Demers Reference Halliday and Blouin-Demers2016b). We sexed beetles at the pupal stage according to the presence of ovipositors (Good Reference Good1936), separated female pupae into a separate container with ad libitum wheat flour, and used females for experiments at least one week after eclosion.
We introduced three densities (10, 30, and 50 beetles) of female red flour beetles to the middle of a clear plastic container (31 × 17 × 10 cm) with sand as a substrate. We used sand as a substrate because it provides traction for the beetles and it makes it easier to collect the beetles at the end of the experiment. Each container had two habitats consisting of 2.5 mL of flour placed on glass slides at opposite ends of the container. We replicated each density treatment of each binary comparison 10 times. After 24 hours, we counted the number of beetles in each half of the container. We again maintained ambient temperature at 30 °C.
We analysed the habitat selection data using geometric mean regression in R (package: lmodel2; function: lmodel2; Legendre Reference Legendre2014) with the number of beetles in one habitat as X and the number of beetles in the other habitat as Y, which allowed us to build isodars. We built an isodar for each habitat comparison, and compared the confidence interval around the intercept and slope to zero and one, respectively. Isodars with an intercept of zero and a slope of one show equal selection of both habitats; an intercept significantly different than zero demonstrates preference for one habitat at low density, and a slope significantly different than one demonstrates increased selection of one habitat over the other as density increases (Morris Reference Morris1988).
Results
Fecundity experiment
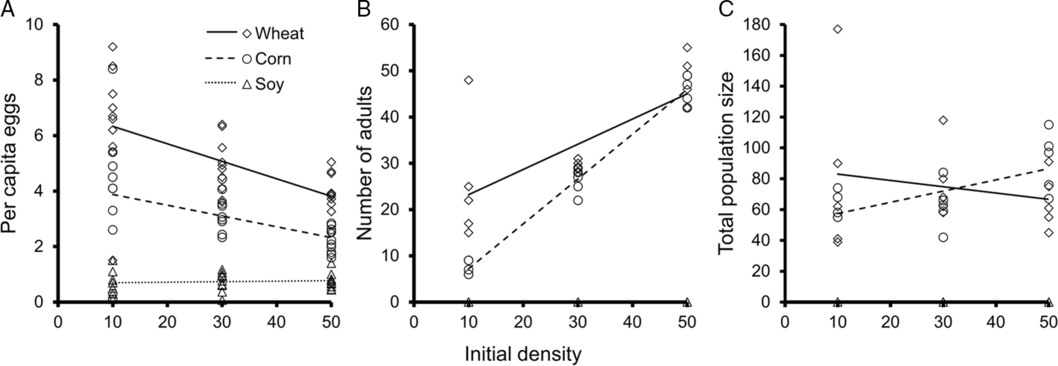
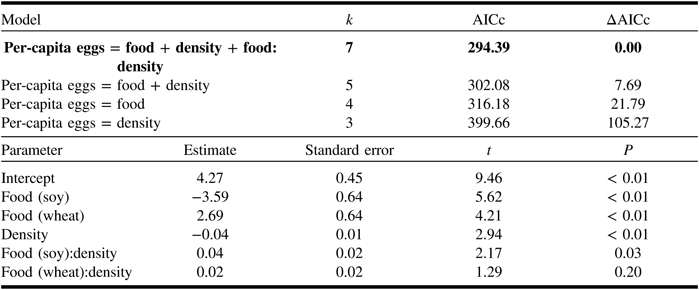
The fecundity of beetles decreased as density increased in wheat and corn flour (slope = −0.04 ± 0.01; t 84 = 2.94, P < 0.01), but not in soy flour (slope = 0.00 ± 0.02; t 84 = 2.17, P = 0.03). Beetles tended to lay 1.5 times more eggs in wheat than in corn flour (mean difference [wheat – corn] = 2.69 ± 0.64; t 84 = 4.21, P < 0.01), and three to four times more eggs in corn than in soy flour (mean difference [soy – corn] = −3.59 ± 0.64; t 84 = 5.62, P < 0.01; full model R 2 adj. = 0.72, P < 0.01; Fig. 1, Table 1).
Fitness of red flour beetles (Tribolium castaneum) in wheat, corn, and soy flour. A, As measured by their per-capita egg output at three starting density treatments; B, as measured by the number of adults in a population after six weeks at three starting density treatments; C, as measured by the total population size (adults, larvae, and pupae) after six weeks at three starting density treatments.

Model selection and final model output for a linear regression examining the fecundity of red flour beetles (Tribolium castaneum) in different foods (corn, soy, and wheat flour) and different densities (10, 30, and 50 beetles).

k is the number of parameters in the model; AICc is the Akaike Information Criteria score corrected for small sample size; and ΔAICc is the difference between AICc and the model with the lowest AICc (bolded).
Population growth experiment
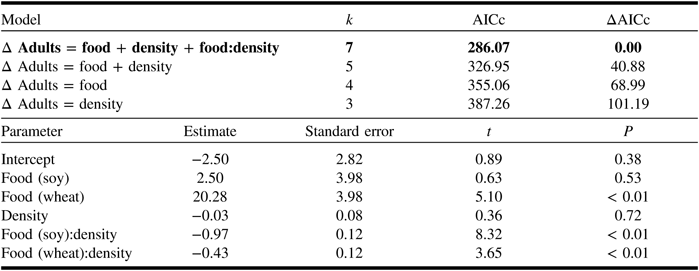
The number of adult beetles doubled in the low-density treatment in wheat flour (t 39 = 5.10, P < 0.01; full model R 2 adj. = 0.92, P < 0.01; Fig. 1, Table 2), but the number of adults remained the same in all other density treatments for wheat and corn (t 39 = 0.888, P = 0.38), and all beetles in soy flour died (t 39 = 8.32, P < 0.01).
Model selection and final model output for a linear regression examining the change in the number of adult red flour beetles (Tribolium castaneum) over six weeks when living in different foods (corn, soy, and wheat flour) and starting at different densities (10, 30, and 50 beetles).
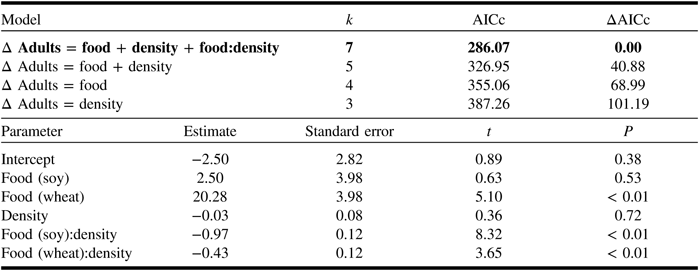
k is the number of parameters in the model; AICc is the Akaike Information Criteria score corrected for small sample sizes; and ΔAICc is the difference between AICc and the model with the lowest AICc (bolded).
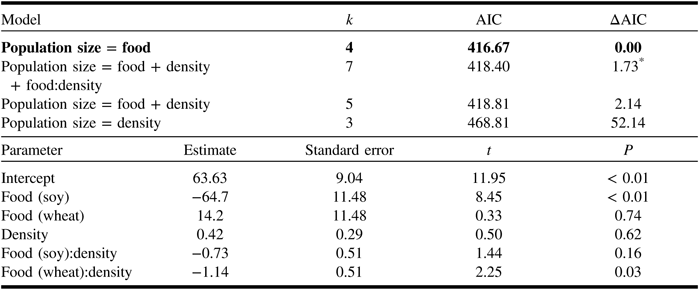
Total population size of beetles (adults + pupae + larvae) was 25% greater in wheat than in corn flour at low densities (t 39 = 2.14, p = 0.04; full model R 2 adj. = 0.71, P < 0.01; Fig. 1, Table 3), but equal at higher densities (t 39 = 2.25, P = 0.03). No individuals were alive in soy flour (t 39 = 2.89, P < 0.01).
Model selection and final model output for a linear regression examining the population size of red flour beetles (Tribolium castaneum) living in different foods (corn, soy, and wheat flour) and at different starting densities (10, 30, and 50 beetles) for six weeks.
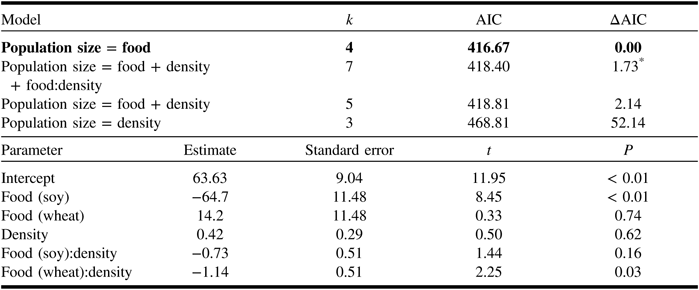
k is the number of parameters in the model; AICc is the Akaike Information Criteria score corrected for small sample sizes; and ΔAICc is the difference between AICc and the model with the lowest AICc (bolded).
* Models within two units of the AICc are considered competing. The estimates in the model output were calculated via model averaging among competing models.
Habitat selection experiment
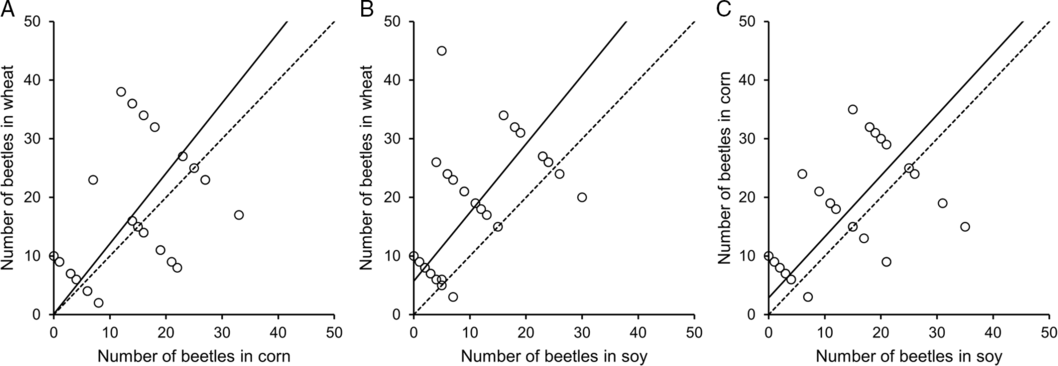
Red flour beetles only showed a strong preference for the wheat flour habitat over the soy flour habitat (intercept (95% confidence interval): 5.72 (0.66–9.35); slope: 1.17 (0.84–1.62); P < 0.01, R 2 = 0.24; Fig. 2). Beetles showed no significant preferences for wheat over corn flour (intercept: 0.09 (−6.62 to 4.84); slope: 1.20 (0.85–1.70); P = 0.02, R 2 = 0.18), or for corn over soy flour (intercept: 2.89 (−2.43 to 6.72); slope: 1.04 (0.75–1.44); P < 0.01, R 2 = 0.27), although in both of these comparisons the mean intercept was greater than zero, which suggests a weak (but nonsignificant) preference for wheat over corn flour and for corn over soy flour.
Isodars (calculated via geometric mean regression) for habitat selection by red flour beetles (Tribolium castaneum). A, Isodar for habitat selection between wheat flour and corn flour; B, isodar for habitat selection between wheat flour and soy flour; C, isodar for habitat selection between corn flour and soy flour. Each data point represents a single replicate indicating the number of beetles found in each habitat. Solid lines indicates the habitat selection isodar and the dashed lines represents the equality between habitats (a one-for-one selection between both habitats). Only the isodar in B was statistically significant.

Discussion
Habitat selection patterns should be based on the fitness rewards available in each habitat. Our fitness data indicated that wheat flour is the best habitat, corn flour is intermediate, and soy flour is very poor. From these data, we would expect a strong habitat preference for wheat over soy flour, and an intermediate preference for wheat over corn flour, and for corn over soy flour. Yet our habitat selection data only support the prediction that wheat flour is preferred over soy flour. All other comparisons showed no significant preference. We offer two possible explanations for why the fitness predictions mismatched habitat preference: (1) the short-term habitat preference trials represent selection for habitat as protective shelter rather than habitat as a food source or oviposition site; (2) this system actually represents a source-sink system (Pulliam Reference Pulliam1988), where beetles select low-quality habitat despite the negative fitness achieved in that habitat. Testing both explanations require long-term experiments to determine if beetles continue selecting soy despite the negative fitness achieved in that habitat or if they start showing a preference for the other habitats once they settle in and begin to forage and reproduce. For example, early experiments by King and Dawson (Reference King and Dawson1973) did show a preference for wheat over corn with long-term experiments. This mismatch between reproductive success and habitat choice is also not unique in phytophagous insects, where parents may choose habitats that benefit them in the short term rather than habitats that would benefit their offspring later on (e.g., Mayhew Reference Mayhew2001).
Our three metrics of fitness produced slightly different predictions. Fecundity demonstrated strong negative density dependence with a clear hierarchy of food quality: wheat > corn > soy flour. The number of adult beetles after six weeks demonstrated similar trends at low density, but showed no difference between wheat and corn flour at high density, and all individuals died in soy flour. Finally, total population size, which included all life stages, showed that wheat is better than corn flour at low density, but corn is better than wheat flour at high density, with zero fitness in soy flour. It is possible that these different metrics of fitness actually balance one another out and lead to no preference for wheat or corn flour, as seen in our habitat selection data.
The results we present in this study may be specific to laboratory stocks of red flour beetles that have become adapted to living exclusively in wheat flour for decades. Wild stocks of this species typically live in stored grain warehouses (Good Reference Good1936), and although they show a preference for living in wheat flour, wild beetles may also use other grains that are readily available. Wild stocks may, therefore, be less specialised on wheat and may show different preference patterns between flour types than the ones we documented in this study. Future work could test the habitat preferences of wild stocks of red flour beetles and other stored grain pests to determine if trials on laboratory stocks are indicative of the preferences of wild stocks.
In conclusion, food quality has a large impact on the fitness of red flour beetles, but short-term habitat selection data only matched the predictions from the fitness data in the most extreme comparison (wheat versus soy flour). This mismatch between fitness and habitat selection could be caused by incomplete fitness data or by habitat selection experiments that were too short. These results confirm the importance of food quality in habitat selection, but also highlight that food quality may not be the only aspect of habitat suitability, especially for species such as flour beetles that live in their food.
Acknowledgements
Funding for this project was provided by the University of Ottawa, a Natural Sciences and Engineering Research Council of Canada postgraduate scholarship to W.D.H., and a Natural Sciences and Engineering Research Council of Canada Discovery Grant to G.B.D.