Introduction
Prime lamb production in Ireland is seasonal and grass based, and lambing is normally targeted to coincide with grass growth in spring. Grass growth is seasonal, peaking in May and June, with little production in December, January or February. Consequently, during the winter period ewes in mid- and late pregnancy are either housed and offered predominantly grass silage-based diets or kept outdoors often on deferred grazed paddocks (paddocks reserved in autumn for winter grazing). Previous studies at this centre have shown that extended grazing ewes in mid- (Flanagan, Reference Flanagan2003; Keady et al., Reference Keady, Hanrahan and Flanagan2007), late (Keady et al., Reference Keady, Hanrahan and Flanagan2007) or throughout (Keady et al., Reference Keady, Hanrahan and Flanagan2007 and Reference Keady, Hanrahan and Flanagan2009; Keady and Hanrahan, Reference Keady and Hanrahan2009) pregnancy increased lamb birth and weaning weights relative to progeny from ewes that were housed unshorn. Whilst increasing lamb birth weight is one of the advantages for extended grazing ewes throughout pregnancy, a major disadvantage is the reduced stock carrying capacity of a system based on extended grazing throughout pregnancy (Keady et al., Reference Keady, Hanrahan and Flanagan2009).
Utilisation rate (proportion of available herbage that is consumed) is an important factor affecting the cost of grazed grass consumed by the animal (Keady et al., Reference Keady, Kilpatrick, Cushnahan and Murphy2002). Previous studies have clearly demonstrated that increasing herbage allowance reduced utilisation rate by cows (Peyraud et al., Reference Peyraud, Comeron, Wade and Lemaire1996) and sheep (Keady and Hanrahan, Reference Keady and Hanrahan2007a and Reference Keady and Hanrahan2007b). Poor utilisation of grazed grass increases its cost to a level similar to or greater than that of grass silage when expressed per kg of dry matter (DM) consumed (Keady et al., Reference Keady, Kilpatrick, Cushnahan and Murphy2002).
Poor nutrition during mid- or late pregnancy can reduce lamb survival through low birth weight, low milk production and increased aberrant maternal behaviour (Holst et al., Reference Holst, Allen and Gilmour1992). Lamb birth weight has been long considered to be an important production trait in prime lamb production as it is positively correlated with weaning weight (Keady et al., Reference Keady, Hanrahan and Flanagan2007; Keady and Hanrahan, Reference Keady and Hanrahan2009) and consequently age at slaughter. However, lamb birth weight is a major factor affecting lamb survival (Christley et al., Reference Christley, Morgan, Parkin and French2003). The viability of large lambs is reduced due to dystocia whilst that of light lambs is reduced due to large body surface area to body mass ratio.
The plane of nutrition of ewes grazing deferred pasture can be altered by increasing herbage allowance and varying the residency period. When offering grass silage, plane of nutrition may be altered by increasing the digestibility and intake characteristics, which are the two key factors affecting feed value. Chop length impacts the silage intake by ewes (Dulphy and Dermarquilly, Reference Dulphy and Dermarquilly1972; Fitzgerald, Reference Fitzgerald1996).
Previous studies have shown that herbage availability during the subsequent grazing season is affected by date of, and severity of, the last grazing during the previous autumn (Lockhart et al., Reference Lockhart, Herriott, Cunningham and Heddle1969; Carton et al., Reference Carton, Brereton, O’Keeffe and Keane1988). However, there is a paucity of data in the literature on the impact of extended grazing management on herbage yield during the subsequent grazing season.
The aim of the current study was to (i) evaluate the effects of extended grazed (a) herbage allowance, (b) frequency of herbage allocation, (c) potential interactions and (d) grass silage feed value when offered to ewes in mid-gestation on their and subsequent progeny performance, (ii) compare the feed value of extended grazed herbage relative to grass silage and (iii) evaluate the effects of extended grazing management on herbage yield and feed value during the subsequent grazing season.
Material and methods
Experiment 1: effects of herbage allowance and frequency of allocation, and grass silage feed value in mid-gestation on ewe performance and subsequent lamb growth rate
Animals and management
One hundred and twenty crossbred ewes (Belclare × Scottish Blackface; sixty 3.5-year olds and sixty 4.5-year olds; initial liveweight 74.1 kg, initial condition score 3.7) due to lamb at the end of February were allocated at random, balanced with respect to age, to six treatments in a randomised design study from 6 December to 1 February. The ewes had been synchronised using progesterone impregnated sponges and joined with rams on 3 October and did not return to service. The ewes had been shorn in mid-September. The six treatments were low feed value (LFV) grass silage offered to housed ewes, medium feed value (MFV) grass silage offered to housed ewes, pasture offered daily at a DM allowance of 1.0 kg/ewe (1 daily), pasture offered twice weekly at a DM allowance of 1.0/ewe (1 twice weekly), pasture offered daily at a DM allowance of 1.8 kg/ewe (1.8 daily) and pasture offered twice weekly at a DM allowance of 1.8 kg/ewe (1.8 twice weekly). Herbage allowance was determined to ground level. During grazing three longitudinal fences were placed in each paddock to divide it into four equal sections (one per treatment). The ewes in the four treatments were allocated a section within each paddock, and each treatment was rotated weekly between sections to remove any potential sward effects. The herbage was offered in fresh blocks either daily or twice weekly to the ewes on the daily and twice-weekly treatments, respectively. All ewes per treatment grazed together. The allocated herbage had electrified Flexinet placed in front of, and at the back of, each allocated block; consequently, ewes did not have access to previously grazed areas.
The ewes offered the silage treatments were housed in slatted pens in groups of five and grass silage was offered once daily in sufficient quantities to allow a refusal of 50 to 100 g/kg offered.
From 1 February until lambing (mean lambing date = 3 March), all ewes were housed and offered the medium feed value silage ad libitum. Silage intake was recorded for one pen (slatted) of five sheep per treatment, providing two observations for each herbage allowance and indoor treatment, respectively, as there was no significant effect of frequency of herbage allocation or silage feed value on forage intake in mid-pregnancy. The remaining ewes were housed in straw bedded pens according to previous herbage allowance offered outdoors and silage indoor treatments.
All ewes received 19.0 kg of a pelleted concentrate during the last 25 days prior to lambing. Concentrate feeding was stepped up from 0.4 to 0.9 kg/ewe per day from days 25 to 10 prior to lambing. The concentrate consisted of 350, 350, 250, 25 and 25 g/kg barley, sugar beet pulp, soya bean meal, molasses and minerals plus vitamins, respectively. The concentrate was offered in one feed daily (at around 1000 h).
Ewes and their lambs were turned out to pasture within 3 days of lambing. No lambs were fostered. All ewes rearing singles and twins received 0.5 kg concentrate per head daily for 2 weeks post turnout due to grass scarcity, and were grazed in one flock in a rotational grazing system. Ewes rearing triplets were grazed as a separate flock and received 1 kg concentrate/head daily for 3 weeks post lambing and 0.5 kg concentrate/head daily for weeks 4 and 5 post lambing. Concentrate was offered to lambs reared as triplets, to a maximum of 300 g/lamb daily, until weaning. All lambs were weaned at 14 weeks.
Forages
Permanent pasture (predominantly perennial ryegrass), which had been harvested for silage on 6 September, received 34 kg N/ha for grazing from 6 December to 1 February. MFV and LFV grass silages were ensiled from similar pastures on 30 May (precision chopped) and 5 August (big baled), respectively. The herbage was mown using a mower conditioner (Kuhn FC 302G; Kuhn S.A., Severna, France). The precision chop silage was harvested after a 36 h wilting period with a trailed harvester (JF FCT 1050 harvester; JF-Stoll, Sondeborg, Denmark) and ensiled untreated in a walled trench silo. The bale silage was harvested untreated with a round baler (Claas Rollant 225; Claas, Harsewinkel, Germany) following a 30 h wilting period. Immediately after baling the bales were transported to the storage area, wrapped (McHale 991 Bale Wrapper; Ballinrobe, Mayo, Ireland) using six layers of film and stacked three high.
Measurements
During extended grazing, pre-grazing sward height was recorded twice weekly at 80 locations taken randomly across the area to be grazed using a rising plate meter (Ashgrove plate meter; Hamilton, New Zealand). Pre-grazing herbage mass (above 2 cm) was determined twice weekly (prior to ewes entering the plot) by cutting four randomly selected strips (length 3.2 m; width 0.65 m) within the area to be grazed using a reciprocating finger bar mower (Agria, Moeckmuehl, Germany). Herbage harvested from each strip was weighed separately (the exact length of each strip was recorded). A representative bulked sample of herbage was used to determine oven DM concentration after which they were milled and analysed for CP, ash, ADF and NDF. A further representative sample of the fresh herbage was taken and frozen prior to the prediction of metabolisable energy (ME) using near-infrared spectroscopy (NIRS). Pre-grazing herbage mass below 2 cm was determined by cutting two 1 m strips (0.1 m wide) to ground level using a hand-held clipper (Gardena, Ulm, Germany) within each strip harvested at 2 cm. All herbage were collected, washed to remove soil contamination and oven dried at 100°C for 48 h. A representative dried sample was retained for the determination of ash concentration.
Post-grazing herbage mass was determined twice weekly by cutting two 1 m strips (0.1 m wide) using a hand-held clipper (Gardena, Ulm, Germany) to ground level within each treatment area. The total sample was collected, washed to remove soil contamination and dried at 100°C for 48 h. A representative dried sample was retained for the determination of ash concentration.
Mean herbage DM intake was estimated twice weekly by difference between pre- and post-grazing herbage mass to ground level divided by the number of ewes per treatment. Herbage utilisation was estimated as herbage consumed (pre-grazing yield minus post-grazing yield) expressed as a proportion of pre-grazing herbage yield.
Silages offered and refused were sampled daily for the determination of oven DM and dried samples of offered silage were bulked weekly for the determination of ADF, NDF and ash. Further composite samples of fresh offered silage were taken once weekly and analysed for alcohols, gross energy, CP, ammonia nitrogen (N), acetate, propionate, butyrate, valerate and lactate concentrations and pH. A representative sample of each silage was removed and frozen for the determination of apparent digestibilities and ME when offered at maintenance to male castrate hogget sheep.
The forage for the apparent digestibility of the MFV silage was removed from the silo as described by Keady et al. (Reference Keady, Mayne and Marsden1998). The silage for the apparent digestibility of the LFV silage was removed from two bales taken at random, thoroughly mixed, placed in bags (5 kg) and frozen prior to undertaking the digestibility study. The herbage for the digestibility study was obtained by mowing representative areas of the paddocks to 1 cm using a reciprocating finger bar mower. The herbage was thoroughly mixed, placed in bags (5 kg) and frozen prior to undertaking the digestibility study.
Silage DM was determined by oven drying at 85°C for 24 h. Corrected silage DM was determined as described by Porter and Murray (Reference Porter and Murray2001). Chemical composition of the herbage, silage, urine and faeces was as described by Keady et al. (Reference Keady, Mayne and Marsden1998 and Reference Keady, Mayne, Fitzpatrick and Marsden1999). The ME concentrations of the grazed herbage and silages and DM digestibility (DMD) of silages were predicted by NIRS as described by Givens et al. (Reference Givens, Everington and Adamson1990) and Park et al. (Reference Park, Agnew and Barnes1999), respectively.
The apparent digestibilities of each forage, offered at maintenance level, were determined using four male castrate sheep per forage. The sheep were housed in digestibility crates that were designed to allow separate collection of urine and faeces. The digestibility study had a 22-day duration including a 14-day pre-experimental period to enable the animals to adjust to the forages, a 6-day feed in period and the daily collection of faeces and urine for a 6-day period with 48 h allowed between first feed and first collection. Faecal and urine samples were taken daily for each animal in proportion to the total quantity produced. Sulphuric acid (10 ml daily) was placed in the urine collection vessels whilst toluene (six drops) was added to the daily faecal sample for each animal to prevent degradation. The six faecal and urine samples from each animal were bulked and a composite sample taken for analysis.
Ewe liveweight and condition score (Russel et al., Reference Russel, Doney and Gunn1969) were recorded on 2 consecutive days immediately prior to the start of the study, on 2 consecutive days at end of mid-pregnancy grazing treatments, and at weeks 5 and 14 post lambing. Ewe condition score was also assessed within 24 h of lambing. At birth lambing difficulty was assessed on a three-point scale (1 = unassisted, 2 = slight intervention and 3 = major intervention). All lambs were tagged (in each ear) and weighed at birth and at 5, 10 and 14 (weaning) weeks of age. Lamb growth rates for weeks 0 to 5, 5 to 10, 10 to 14 and birth to 14 were determined.
Experiment 2: Effects of sward grazing date and management of autumn pasture on subsequent herbage yield
Sward management
The areas of the pasture that had been grazed in situ in Experiment 1 at daily DM allowances of 1.0 or 1.8 kg/ewe, allocated daily or twice weekly, from 6 to 12 December, 27 December to 3 January or 17 to 23 January, respectively, were utilised in the current study. Thus, there were 12 ‘grazing treatment’ blocks (2 allowances × 2 frequencies of allocation × 3 time periods). Within each block representative plots were allocated at random, post grazing, for harvesting on 27 April (three plots) or 25 May (three plots). Consequently, the study consisted of 72 plots, each 20 m × 1.3 m. All plots received 60, 24.5 and 105 kg/ha of N, P and K fertiliser, respectively, which was applied manually on 14 February.
Herbage from the primary growth of each plot was mown, on either 27 April or 25 May, using a reciprocating blade mower to a height of 2 cm. Herbage from each plot was then bagged and weighed for the determination of yield. Subsequently, the herbage from each plot was thoroughly mixed and sampled for chemical analysis.
Measurements
Herbage from each plot was sampled after mowing for the determination of DM (100°C) and dried samples were retained for the analysis of CP, ash and ADF. A representative sample was dried at 60°C for the determination of water soluble carbohydrate. A further representative sample was frozen (−20°C) for the prediction of ME using NIRS of fresh herbage samples using the equations of Givens et al. (Reference Givens, Everington and Adamson1990). Chemical composition of the herbage was described by Keady et al. (Reference Keady, Mayne and Marsden1998 and Reference Keady, Mayne, Fitzpatrick and Marsden1999).
Statistical analysis
Animal performance data were analysed as a completely randomised study using Proc GLM and Proc Mixed of the Statistical Analysis Systems Institute (SAS) (2000). Contrasts were calculated to evaluate the effects of herbage allowance, frequency of allocation and their interaction and forage type. For all variables the model included fixed effects for treatment and ewe age. For lambing assistance slight and major interactions (scores 2 and 3) were combined together and litter size was also included in the model and analysed using PROC Genmod of SAS. Sex and number of lambs born per ewe were also included as fixed effects for lamb birth weight whilst sex and number born by number reared interaction were included as fixed effects for liveweight gains and weaning weight. Pre-experimental liveweight was used as a covariate for ewe liveweight. Pre-experimental condition score was used as a covariate for ewe condition score. For condition score and liveweight of the ewe at weaning, number of lambs reared was also included in the model. For herbage intake the model had effects for herbage allowance and date, and the herbage allowance by date interaction was treated as the error term. In the case of silage intake, pen within treatment provided replication and these data were analysed with pen as a random term. The effects of sward grazing date, herbage allowance and frequency of allocation at grazing on subsequent herbage yield and composition were analysed with blocks considered random and with fixed effects for herbage allowance, frequency of allocation, grazing date, harvest date and two-factor interactions using PROC Mixed of SAS.
Results
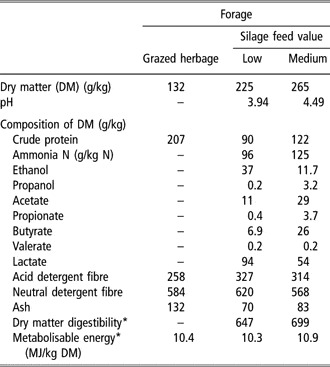
The chemical composition of the forages is presented in Table 1. The extended grazed herbage had higher CP and ash concentrations and lower DM concentration relative to the grass silages. The extended grazed herbage and LFV silage had similar predicted ME concentrations. The silages differed in feed value based on DM and in vitro DMD and ME concentrations.
Experiment 1: Chemical composition of the forages

*Determined by NIRS.
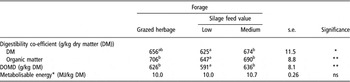
The forage digestibilities as determined through sheep at maintenance level are presented in Table 2. Relative to the LFV silage, the MFV silage had higher DM (P < 0.05) and organic matter (OM) (P < 0.01) digestibility co-efficients and digestive organic matter in the DM (DOMD) (P < 0.05). Relative to the LFV silage, the extended grazed herbage had higher OM digestibility (P < 0.01) and digestible OM in the DM (DOMD) (P < 0.01) but similar DM digestibility and ME concentrations.
Experiment 1: Forage digestibilities determined through sheep at maintenance level

DOMD = digestive organic matter in the DM.
*Metabolisable energy concentrations determined with the forage offered at maintenance and by assuming a methane energy loss of 0.08 of gross energy intake, with urine energy being determined daily.
a,bWithin rows means not showing a common superscript differ significantly (P < 0.05).
Silage feed value did not alter (P > 0.05) silage DM intake, intakes for the LFV and MFV grass silages being 0.99 and 0.91 (s.e. 0.033) kg DM/day, respectively.
The effects of herbage allowance and frequency of allocation on OM intake and utilisation are presented in Table 3. Increasing herbage allowance increased (P < 0.05) OM intake and decreased (P < 0.05) OM utilisation. Frequency of herbage allocation did not significantly alter herbage OM intake or utilisation. There was no herbage allowance by frequency of allocation interactions (P > 0.05) for OM intake or utilisation.
Experiment 1: Effect of extended grazing treatment on herbage organic matter intake and utilization in mid-pregnancy

DM = dry matter; OM = organic matter.
+Utilisation is calculated to ground level.
Silage intake in late pregnancy was not significantly altered by herbage allowance or forage type offered in mid-pregnancy with intakes being 0.90, 0.83 and 0.84 (s.e. 0.070) kg DM/ewe per day for the ewes that were extended grazed at the low and high herbage allowances and for those that were offered grass silage during mid-pregnancy, respectively.
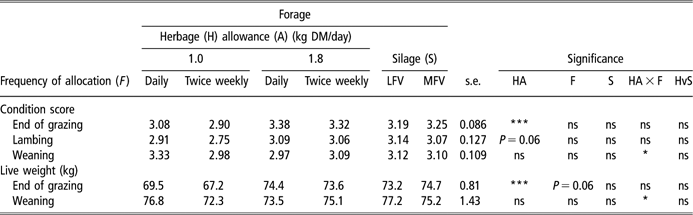
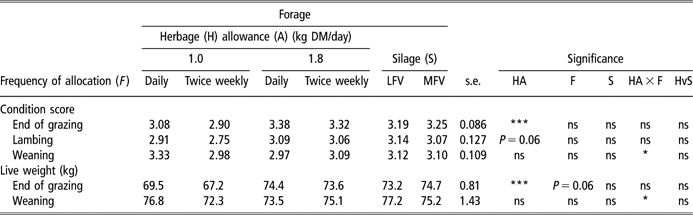
The effects of herbage allowance and frequency of allocation, and silage feed value on ewe condition score and liveweight are presented in Table 4. Increasing herbage allowance increased condition score (P < 0.001) and liveweight (P < 0.001) at the end of extended grazing and tended (P = 0.06) to increase condition score at lambing. Herbage allowance in mid-pregnancy had no significant effect on condition score or liveweight at weaning. Increasing the frequency of herbage allocation tended (P = 0.06) to increase liveweight at the end of extended grazing. Frequency of herbage allocation did not significantly alter condition score at the end of extended grazing or at lambing and weaning, or liveweight at weaning. Silage feed value did not significantly alter ewe liveweight or condition score during the study. Relative to extended grazing, ewes offered grass silage indoors had similar liveweight and condition score throughout the study. There was a significant (P < 0.05) interaction between herbage allowance and frequency of allocation for ewe condition score and liveweight at weaning.
Experiment 1: Effect of herbage allowance and frequency of allocation and silage feed value on ewe condition score and weight
LFV = low feed value grass silage; MFV = medium feed value grass silage.
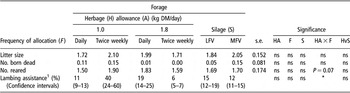
The effects of herbage allowance and frequency of allocation on litter size and viability and lambing assistance are presented in Table 5. Herbage allowance, frequency of herbage allocation or silage feed value did not significantly alter litter size, number born dead, number reared or lambing assistance. There was a significant interaction (P < 0.05) between herbage allowance and frequency of allocation for lambing assistance. Reducing frequency of allocation at the low herbage allowance tended to increase assistance score, whilst at the high herbage allowance reducing frequency of allocation tended to reduce assistance score. Litter size, number born dead, number reared and lambing assistance did not differ (P > 0.05) for ewes that were extended grazed or housed offered grass silage in mid-pregnancy.
Experiment 1: Effects of herbage allowance and frequency of allocation and silage feed value, litter size and viability

LFV = low feed value grass silage; MFV = medium feed value grass silage.
1Back-transformed values.
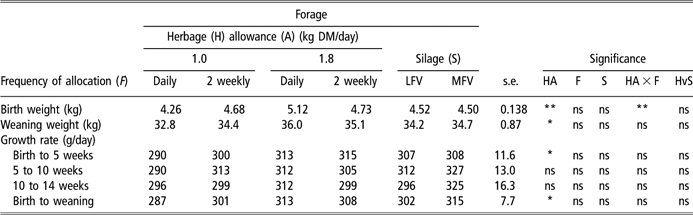
The effects of herbage allowance and frequency of allocation and silage feed value on lamb birth weight and subsequent performance are presented in Table 6. Increasing herbage allowance increased lamb birth (P < 0.01) and weaning (P < 0.05) weights and growth rate from birth to 5 weeks (P < 0.05) and birth to weaning (P < 0.05). Herbage allowance did not significantly alter lamb growth rate from weeks 5 to 10 and 10 to 14. Frequency of herbage allocation and grass silage feed value did not significantly alter lamb birth or weaning weights, or growth rate from birth to 5 weeks, 5 to 10, 10 to 14 weeks and birth to weaning. Lambs from ewes extended grazed had similar birth and weaning weights, and growth rate from birth to 5 weeks, 5 to 10, 10 to 14 weeks and birth to weaning as lambs from ewes housed offered silage-based diets in mid-pregnancy. There was a significant interaction between herbage allowance and frequency of allocation for lamb birth weight (P < 0.01). At the low herbage allowance reducing the frequency of allocation increased birth weight, whilst at the high allowance reducing the frequency of allocation reduced birth weight.
Experiment 1: Effects of herbage allowance and frequency of allocation and silage feed value on lamb birth weight and growth rate
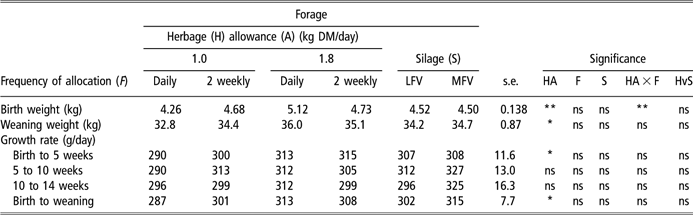
LFV = low feed value grass silage; MFV = medium feed value grass silage.
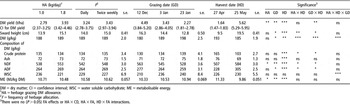
The effects of grazing date, herbage allowance, frequency of allocation and harvest date on subsequent herbage yield and height are presented in Table 7. Increasing herbage allowance increased subsequent herbage DM yield (P < 0.01) but did not alter sward height (P > 0.05). Delaying grazing date significantly decreased herbage DM yield (P < 0.01) and sward height (P < 0.05). Delaying harvest date increased herbage yield (P < 0.001) and sward height (P < 0.001). Frequency of herbage allocation during grazing did not alter (P > 0.05) subsequent herbage yield or sward height. There was a significant interaction between grazing date and harvest date for herbage yield (P < 0.01) and sward height (P < 0.05). For the swards grazed in early December, late December and late January, herbage yields on 27 April and 25 May were 2616, 1702 and 855 kg DM/ha; 6874, 5763 and 4361 kg DM/ha, respectively. There were no herbage allowance by grazing date or herbage allowance by frequency of allocation or harvest date by frequency of herbage allocation interactions (P > 0.05) for herbage yield or sward height.
Experiment 2: Effects of grazing date and management of autumn saved pasture, and harvest date on subsequent herbage yield and composition

DM = dry matter; CI = confidence interval; WSC = water soluble carbohydrate; ME = metabolisable energy.
1HA = herbage grazing DM allowance.
2F = frequency of herbage allocation.
3There were no (P > 0.05) FA effects or HA × CD, HA × FA, HD × FA interactions.
The effects of grazing date, herbage allowance, frequency of allocation and harvest date on subsequent herbage composition are presented in Table 7. Increasing herbage allowance during grazing increased (P < 0.05) ADF and decreased (P < 0.05) predicted ME concentrations in the herbage. Delaying grazing date decreased NDF (P < 0.01) and ADF (P < 0.05) concentrations and increased ME (P < 0.01) and DM (P < 0.05) concentrations. Delaying harvest date decreased (P < 0.001) DM, CP, ash and ME concentrations and increased (P < 0.001) NDF and ADF concentrations. There was a significant interaction (P < 0.05) between grazing date and harvest date for CP, NDF and ADF concentrations. Herbage from pastures closed in early December, late December and late January and harvested on 24 April and 25 May had CP concentrations of 172, 106, 168, 100, 156 and 104 g/kg DM; NDF concentrations of 499, 557, 504, 587, 518 and 607 g/kg DM; and ADF concentrations of 226, 292, 222, 305, 234 and 319 g/kg DM, respectively. There were no significant effects of frequency of herbage allocation or grazing date and frequency of herbage allocation, herbage allowance and frequency of allocation or harvest date and frequency of allocation interactions for herbage composition.
Discussion
Results from previous studies at this Research Centre have showed that relative to ewes housed indoors, unshorn, and offered grass silage during mid- and late pregnancy extended-grazing ewes in mid- (Flanagan, Reference Flanagan2003; Keady et al., Reference Keady, Hanrahan and Flanagan2007), late (Keady et al., Reference Keady, Hanrahan and Flanagan2007) and throughout (Keady et al., Reference Keady, Hanrahan and Flanagan2007 and Reference Keady, Hanrahan and Flanagan2009; Keady and Hanrahan, Reference Keady and Hanrahan2009) pregnancy increased lamb birth weight and subsequent growth rate. In these studies fresh herbage was allocated daily, which is labour demanding. However, Keady et al. (Reference Keady, Hanrahan and Flanagan2009) clearly showed that year-round grazing required a reduction in stocking rate, dramatically reduced stock carrying capacity from 14.1 to 10.4 ewes/ha. Whilst the aim of the present study was to evaluate the effects of herbage allowance and frequency of allocation in mid-gestation, the study also provided the opportunity to directly compare extended grazed herbage with grass silages of differing feed value. The grass silages offered in the present study were typical of grass silages produced in Ireland and United Kingdom as determined by their feed value and fermentation characteristics (Keady, Reference Keady2000). The LFV silage was ensiled in round bales unchopped, whilst the MFV silage was precision chopped. Decreasing chop length has been shown to increase silage intake (Dulphy and Dermarquilly, Reference Dulphy and Dermarquilly1972; Fitzgerald, Reference Fitzgerald1996) and subsequent feed value for ewes. The herbage offered in the present study had similar crude protein, ash and estimated ME concentrations for autumn saved pasture as reported by Flanagan (Reference Flanagan1994) and Keady et al. (Reference Keady, Hanrahan and Flanagan2007).
Herbage utilisation
Previous studies (Peyraud et al., Reference Peyraud, Comeron, Wade and Lemaire1996; Maher et al., Reference Maher, Stakelum and Rath2003) have shown a curvilinear relationship between forage intake and daily herbage allowance. Whilst there were only two herbage allowances in the current study, herbage utilisation declined as herbage allowance increased, such that only 23% of the additional herbage allowance was utilised. Maher et al. (Reference Maher, Stakelum and Rath2003), using dairy cows, observed that there was no evidence of any change in the relationship between herbage allowance and forage intake throughout the grazing season.
Utilisation rate is one of the major factors affecting the cost of the herbage consumed by grazing livestock (Keady et al., Reference Keady, Kilpatrick, Cushnahan and Murphy2002). The utilisation rate of herbage is influenced by prevailing weather conditions, particularly rainfall, soil type, herbage mass and herbage allowance. During the current study the rainfall was 148 mm (average for the same period during the previous 10 years was 198 mm). Furthermore, with the heavy sward mass in the current study the ewes were allocated small areas, and the herbage became soiled within hours of allocation. In other studies, using the same techniques for determining intake as in the current study (i.e. to ground level), herbage utilisation rates of extended grazed herbage have varied from 68% to 82% (Keady and Hanrahan, Reference Keady and Hanrahan2007a and Reference Keady and Hanrahan2007b) on pastures on freer draining soils and with lower rainfall. However, Carson et al. (Reference Carson, Dawson and Laidlaw2003), using a different technique to determine intake, reported herbage utilisation rates of 47% and 28% for ewes in late pregnancy allocated 1.3 and 2.6 kg herbage DM allowance, respectively.
The reduced forage and, consequently, ME intakes due to the lower herbage allowance impacted ewe liveweight (−5.7 kg) and condition score (0.36 units) at the end of the extended grazing period. However, when all the ewes were offered the MFV silage supplemented with concentrate in late pregnancy there was limited evidence that ewes on the lower allowance consumed more food as determined by silage intake and also the difference in condition score due to herbage allowance declined from 0.36 units at the end of extended grazing to 0.24 units at the point of lambing.
An analysis of the relationship between sward height and extended grazing herbage yield (to ground level) identified a highly significant linear relationship between sward height and herbage yield, which is best described by the following relationship:

where x is the sward height (cm).
Lamb birth weight
Litter size and birth weight are two important traits in mid-season prime lamb production. Whilst herbage allowance had no impact on litter size in the current study, it is noted that relative to ewes, which were housed and offered grass silage-based diets, ewes extended grazed tended to have a lower litter size. Whilst not statistically significant, previous studies have shown similar trends, that extending grazing ewes either in late (Carson et al., Reference Carson, Dawson, Irwin and Kilpatrick2004) or through pregnancy (Keady and Hanrahan, Reference Keady and Hanrahan2009) reduced litter size by 0.03 and 0.17 lambs, respectively. The numerical improvement in lamb birth weight of 0.19 kg due to extended grazing in mid-pregnancy is similar to the results of Keady et al. (Reference Keady, Hanrahan and Flanagan2007). Furthermore, Keady et al. (Reference Keady, Hanrahan and Flanagan2007) concluded that the increase in birth weight due to extended grazing in mid-pregnancy was equivalent to 0.35 of the increase in birth weight observed due to extended grazing for the duration of gestation.
For the low and high herbage allowances, ME intake was estimated to be 0.44 and 0.60 of requirements (maintenance plus pregnancy), respectively. Whilst in the current study forage intake was determined by the differences between pre- and post-grazing yields, potential selection of herbage by the animals during grazing may have occurred, which would increase the ME concentration of the herbage consumed. However, differences in ME intake between the two herbage allowances would still occur should the ME concentration of the ingested herbage differ from the herbage offered. In the current study, as pregnancy progressed and ME requirement increased, herbage allowance remained static; consequently, ME intake as a proportion of ME requirement declined. The loss of condition due to underfeeding on the low herbage allowance was two times the loss, which occurred for animals on the high allowance, clearly illustrating that herbage allowance had a major effect on the level of nutrition. Robinson et al. (Reference Robinson, Sinclair and McEvoy1999) concluded that for ewes in good condition, during days 30 to 90 of pregnancy a mild degree of undernutrition (resulting in a steady loss of up to 0.5 of a condition score) enhanced the growth of the placenta. However, Robinson (Reference Robinson1990) further observed that loss of greater than 0.5 units of condition during mid-pregnancy may reduce placental size and consequently lamb birth weight.
The ewes on the low herbage allowance in the current study (which produced lighter lambs than the ewes on the high herbage allowance) were underfed for at least 57 days while grazing and immediately post housing when time was required to adjust to their new diet of silage and concentrate. From a review of the literature Mellor (Reference Mellor1983) concluded that in well-fed ewes foetal growth rate remains constant until at least 120 days of gestation and subsequently decreased gradually. However, in underfed ewes Mellor (Reference Mellor1983) found that when ewes that have been well fed and subsequently severely underfed at any stage during the last 40 to 50 days of pregnancy, foetal growth rate declined within 3 days and in extreme cases almost became static. Mellor (Reference Mellor1983) also concluded from a review of the literature that if ewes were underfed for a period of greater than 21 days, that upon refeeding, foetal growth rate did not increase to compensate for the loss of growth during the period of undernutrition. Furthermore, Mellor (Reference Mellor1983) found that moderately underfeeding ewes for 85 days reduced foetal growth rate irreversibly and that refeeding at 120 days of gestation did not cause the foetal growth rate to increase but did prevent further decreases in growth rate after 120 days.
Placental weight is the major factor determining lamb birth weight (Mellor, Reference Mellor1983; Heasman et al., Reference Heasman, Clarke, Stephenson and Symond1999). Peak placental weight is attained by day 80 of gestation (Heasman et al., Reference Heasman, Clarke, Stephenson and Symond1999) and is sensitive to nutrition between days 40 and 80 of gestation. In the current study the high and low herbage allowances resulted in moderate and mild undernutrition, respectively. Kelly (Reference Kelly1992) concluded from a review of the literature that while the majority of evidence indicated that undernutrition in mid-pregnancy decreased placental size, there was limited evidence to support the contention that if ewes are in good condition in early pregnancy that underfeeding in mid-pregnancy will increase placental size. Ewes offered the low herbage allowance were underfed throughout most of pregnancy, probably retarding placental growth; subsequently, these foetuses entered their maximum growth phase handicapped both by a small placenta and by continuing moderate underfeeding, which subsequently impacts foetal survival in late pregnancy. Mellor et al. (Reference Mellor, Mitchell and Matheson1977) found a higher incidence of foetal death during late pregnancy when foetal growth retardation was caused by a small placenta than when it was due mainly to maternal underfeeding. In the current study there was a tendency for a greater number of lambs to be born dead from ewes offered the low herbage allowance.
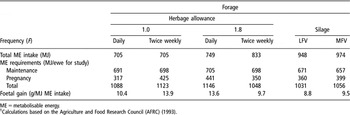
Whilst previous studies (Mellor, Reference Mellor1983; Holst et al., Reference Holst, Allen and Gilmour1992; McCrabb et al., Reference McCrabb, Egan and Hosking1992) have shown an effect of level of nutrition during mid-pregnancy on subsequent lamb birth weight, the current study illustrates that the impact of plane of nutrition, as impacted by herbage allowance, is influenced by frequency of herbage allocation. At the high herbage allowance offering herbage twice weekly reduced lamb birth weight probably due to a higher forage and subsequently ME intake. Robinson (Reference Robinson1977) noted that high plane feeding in mid-pregnancy could reduce lamb birth weight and subsequently Robinson and McDonald (Reference Robinson and McDonald1989) suggested that practical feeding strategies for mid-pregnant ewes should take account of body condition at the beginning of pregnancy. Whilst the ewes were offered the same herbage allowance, the ewes offered it daily had a more consistent supply of ME. However, offering herbage twice-weekly probably fluctuated intake daily within each allocation period. Also, offering the high allowance of herbage twice weekly reduced the efficiency of utilisation of ME for foetal gain (Table 8).
Experiment 1: the effects of treatment on energy intake and availabilityFootnote 1

ME=metabolisable energy.
1 Calculations based on the Agriculture and Food Research Council (AFRC) (1993).
At the low herbage allowance, ewes that were offered herbage twice weekly produced lambs with higher birth weights relative to ewes offered fresh herbage daily. It would appear that the frequency of allocating the low herbage allowance influenced energy partitioning. Ewes offered the herbage twice weekly lost more condition but produced heavier lambs and improved the efficiency of utilisation of ME for foetal gain (Table 8) while having a similar ME intake. Probably the ewes offered the low herbage allowance daily adjusted partitioning to reduce weight loss at the expense of the conceptus.
The ewes offered the grass silage-based diets consumed 0.91 of ME requirements, but produced lambs of similar birth weight as ewes offered the low herbage allowance achieving 0.44 of requirements. Whilst previous studies (Keady et al., Reference Keady, Hanrahan and Flanagan2007; Keady and Hanrahan, Reference Keady and Hanrahan2009) have reported increased lamb birth weights from lambing outdoors, Keady et al. (Reference Keady, Hanrahan and Flanagan2007) and Keady and Hanrahan (Reference Keady and Hanrahan2009) showed that shearing March-lambing ewes at housing in mid-December produced lambs of similar birth weight to those from ewes lambing outdoors. The ewes in the current study were shorn in mid-September; consequently, heat stress is unlikely to effect lamb birth weight. Previous studies (McCrabb et al., Reference McCrabb, Egan and Hosking1992) have shown that feeding ewes that were in good condition at the beginning of the study (day 30), above maintenance requirement, reduced placental size, which is positively correlated with lamb birth weight. However, Muñoz et al. (Reference Muñoz, Carson, McCoy, Dawson, O’Connell and Gordon2008) showed that increasing feed level in mid-pregnancy from 0.8 to 1.4 maintenance did not influence birth weight. The lack of an effect of offering silage indoors (even at higher levels of feeding) on lamb birth weight is probably associated with diet type and feeding method. During the ensiling process major changes occur in the composition of the carbohydrate and protein fractions, which may have impacted lamb birth weight. From the mean of six studies, Keady (Reference Keady1991) reported that true protein accounts for 790 and 553 g/kg N of the parent herbage and resultant silage, respectively. Keady and Murphy (Reference Keady and Murphy1998) observed that ensilage increased nitrogen degradation in the rumen and reduced microbial protein supply. Using the proportions of true protein reported by Keady (Reference Keady1991), estimated true protein intakes for the ewes in mid-pregnancy for the low and high extended grazed herbage allowances and LFV and (high feed value) HFV silage treatments were 92, 125, 60 and 77 g/day, respectively. Whilst the ewes offered silage-based diets had higher ME intake, their intake of true protein was lower than the ewes offered the low and high herbage allowances. Bell et al. (Reference Bell, Kennaugh, Battaglia and Meschia1989) reported that the efficiency of uptake of amino acid nitrogen by the foetus was greater in mid-gestation than in late gestation. Lippert et al. (Reference Lippert, Milne and Russel1983) also suggested that amino acid supply may be more important in alleviating adverse effects on subsequent lamb birth weight of undernutrition of the ewes in mid-pregnancy relative to ME supply. The results of the current study are consistent with this observation. Secondly, the energy in the silage-based diet may have been partitioned to body gain of the ewe at the expense of the conceptus as ewes offered silage maintained liveweight whilst those on the low herbage allowance lost weight. Kirkpatrick and Steen (Reference Kirkpatrick and Steen1999) showed that relative to the parent herbage, when silage was offered as the sole diet to lambs, muscle lipid concentration was increased by 71%. Thirdly, the efficiency of ME utilisation for the silage-based diets may have been lower than that of the grazed herbages. The silages offered in the current study had LFV and MFV, respectively. When replacing ME from concentrate with ME from silage offered to beef cattle Steen et al. (Reference Steen, Kilpatrick and Porter2002) showed that carcass gain was reduced by 5% and 31% for high (DOMD = 743 g/kg DM) and medium (DOMD = 643 g/kg DM) feed value silages, respectively. Fourthly, the efficiency of utilisation of ME for foetal growth was lower on the silage-based diets relative to the extended grazed herbage allowances. Finally, during the last 4 weeks of pregnancy, when 50% of foetal growth occurs, ewes that had been offered the low herbage allowance in mid-pregnancy tended to have higher forage intake when offered the MFV silage ad libitum.
Lamb growth rate
The mean lamb performance from birth to weaning of 305 g/day was at the upper range of previously published values (Carson et al., Reference Carson, Dawson, Irwin and Kilpatrick2004; Keady and Hanrahan, Reference Keady and Hanrahan2007a; Keady et al., Reference Keady, Hanrahan and Flanagan2007 and Reference Keady, Hanrahan and Flanagan2009). A further analysis of the relationship between lamb birth weight and weaning weight yielded a significant linear relationship between lamb birth weight and weaning weight (P < 0.01), which is best described by the following equation:

where WW is the weaning weight (kg) and BW is the birth weight (kg).
Similarly, Keady et al. (Reference Keady, Hanrahan and Flanagan2007) and Keady and Hanrahan (Reference Keady and Hanrahan2009) reported similar responses of an increase in weaning weight of 3.35 and 3.16 kg for each 1 kg increase in birth weight. However, the increase in weaning weight due to higher birth weight is also partly attributed to growth rate from birth to weaning, which is indirectly related to milk yield. In the current study lambs from ewes that were on the high herbage allowance had the heavier weaning weights (+1.9 kg relative to lambs from ewes offered the low herbage allowance) due to a combination of higher birth weight and growth rate to weaning. Lambs from ewes that were on the low herbage allowance and silage treatments had similar birth weights but weaning weight differed by 0.9 kg. Relative to the ewes on the silage treatments those on the low herbage allowance treatments had poorer condition at lambing (−0.28). However, at weaning condition score was similar for ewes on the low herbage allowance and silage treatments, respectively. Whilst the lambs in the present study had similar genetic potential, those from ewes offered silage indoors grew faster to weaning (+15 g/day) than those from ewes offered the low herbage allowance even though they had similar birth weights. Consequently, 0.53 of the response in weaning weight in equation (2) was due to birth weight per se while the remaining 0.47 was due to higher growth rate by the lambs, most likely due to higher ewe milk energy output, from birth to weaning. Whilst milk yield or composition was not determined in the current study, it is apparent that the ewes on the low herbage allowance produced less milk energy output, as indicated by lower lamb growth rate, and partitioned more energy to replenishing body reserves than ewes offered silage indoors. With dairy cows Keady and McCoy (Reference Keady and McCoy2001) concluded from a review of the literature that increasing condition score at calving increased milk yield and tended to increase fat concentration, consequently increasing milk energy output during the subsequent lactation.
Based on the differences in lamb weight at weaning, an extended grazed herbage daily DM allowance of 1.3 kg/ewe in mid-pregnancy had the same feed value as 1.0 kg DM intake of LFV grass silage.
Subsequent herbage regrowth
An analysis of the relationship between grazing date and subsequent herbage yield identified a highly significant negative linear relationship between grazing date and subsequent herbage yield, which is best described by the following relationship:

where x is the days delay in grazing after 12 December.
Whilst many previous authors (Lockhart et al., Reference Lockhart, Herriott, Cunningham and Heddle1969; Carton et al., Reference Carton, Brereton, O’Keeffe and Keane1988; O’Donovan et al., Reference O’Donovan, Dillon, Reid, Rath and Stakelun2002) have reported that delaying autumn grazing (closing) date decreased subsequent spring herbage yield, the reduction in herbage yield for each day’s delay in grazing date is greater in the current study. Previous authors have reported reduced spring herbage yield of 9.4 (Carton et al., Reference Carton, Brereton, O’Keeffe and Keane1988) to 15.0 (O’Donovan et al., Reference O’Donovan, Dillon, Reid, Rath and Stakelun2002) kg DM for each day’s delay in autumn grazing. The greater decrease in the current study is due to one or more of the following. Firstly, the swards were heavily stocked during grazing with stocking density equivalent to 3329 and 1849 ewes/ha for the 1.0 and 1.8 kg DM herbage allowances; consequently, the swards were probably damaged due to treading. Busteed et al. (Reference Busteed, O’Riordan and Collins2000) found that severely damaging swards in early December reduced herbage yield the following April by up to 1886 kg DM/ha. Secondly, the grazing dates in the current study extended from early December to late January whilst in many of the previous studies autumn grazing dates extended from September to early December. Thirdly, in the current study the swards had heavy herbage yields (3330 kg DM/ha) at the time of grazing. Fourthly, this study involved sheep as the grazing animals whilst in the previous studies cattle or mowing were used at the autumn harvest dates. The decline in herbage DM yield of 54.2 kg/ha per day delay in grazing after early December has a significant impact on spring grass availability. Using the data of Vulich et al. (Reference Vulich, O’Riordan and Hanrahan1991), a decline of 54.2 kg DM/ha is equivalent to 20 grazing days for ewes rearing twin lambs from birth to weaning. However, whilst delaying grazing reduced herbage yield, it increased feed value as indicated by ME concentration due to a reduction in fibre concentration, but did not impact water-soluble carbohydrate or CP concentrations.
The mean growth rate of 147 kg herbage DM for each day’s delay in harvesting in the present study is similar to the growth rates of 135 and 152 kg DM reported by Keady and O’Kiely (Reference Keady and O’Kiely1998) and Keady et al. (Reference Keady, Mayne and Fitzpatrick2000) when harvesting of swards was delayed from 24 May to 8 June and 10 May to 7 June, respectively. The changes in herbage composition and decreased feeding value due to delayed harvest date are similar to the results of previous studies (Keady and O’Kiely, Reference Keady and O’Kiely1998; Keady et al., Reference Keady, Mayne and Fitzpatrick2000).
The effects of severity of defoliation at the winter grazing date on subsequent herbage yield are similar to the results of Carton et al. (Reference Carton, Brereton, O’Keeffe and Keane1988). However, whilst Carton et al. (Reference Carton, Brereton, O’Keeffe and Keane1988) found that by May the effects of severity of winter grazing had no effect on herbage yield, in the current study severity of winter grazing had the same negative effect on herbage yield at both harvest dates.
Conclusions
It is concluded that increasing herbage allowance in mid-gestation ewes increased subsequent birth and weaning weights of lambs. There was a herbage allowance by frequency of allocation interaction for lamb birth weight probably due to differences in partitioning energy intake. Based on lamb weaning weight 1.3 kg extended herbage DM allowance had the same feed value as 1.0 kg DM of LFV grass silage. Each 1-day delay in winter grazing date decreased herbage yield during the subsequent spring by 54 kg DM/ha.