From historical accounts of “storm and stress” (Arnett, Reference Arnett1999) to contemporary developmental and clinical science perspectives (Rudolph & Flynn, Reference Rudolph, Flynn, Gotlib and Hammen2014), there is a strong consensus that risk for depression intensifies across the adolescent transition. In large part, this burgeoning risk is attributed to the challenges of puberty (Graber, Nichols, & Brooks-Gunn, Reference Graber, Nichols and Brooks-Gunn2010; Mendle, Turkheimer, & Emery, Reference Mendle, Turkheimer and Emery2007; Negriff & Susman, Reference Negriff and Susman2011). Consistent with a rapidly growing emphasis on multilevel conceptualizations of psychopathology (Cicchetti, Reference Cicchetti, Beauchaine and Hinshaw2008, Reference Cicchetti2013; Cicchetti & Dawson, Reference Cicchetti and Dawson2002; Cicchetti & Valentino, Reference Cicchetti, Valentino and Masten2007), developmental psychopathology theories of puberty call for considering how the biological and social context of puberty intersects with personal and contextual risk in the ontogenesis of depression over time (Rudolph, Reference Rudolph, Lewis and Rudolph2014). In particular, theory and research implicate the timing of puberty (one's level of maturation relative to peers) as a robust contributor to the emergence of depression (Mendle et al., Reference Mendle, Turkheimer and Emery2007) and the sex difference therein (Negriff & Susman, Reference Negriff and Susman2011). This research sought to (a) examine sex differences in the initial and long-term effects of pubertal timing on depression and (b) identify personal and contextual pathways linking pubertal timing to trajectories of depression across adolescence in girls and boys.
Part 1: Examining Sex Differences in Pubertal Timing Effects
The first goal of this research was to examine whether pubertal timing exerted similar or different initial and long-term effects on depression in girls and boys. Several theories propose that maturing off-time compromises development in ways that heighten risk for psychopathology (Petersen & Taylor, Reference Petersen, Taylor and Adelson1980). According to the maturational deviance perspective, off-time development, both early and late, triggers insecurity and social stress that heighten risk for psychopathology. According to the stage-termination perspective, maturing early poses an especially strong risk, as youth are confronted with the challenges of puberty without sufficient developmental preparation or social support. Moreover, early maturing youth often encounter riskier social contexts through affiliations with older and deviant peers and precocious entrance into dating and sexual relationships (Negriff, Ji, & Trickett, Reference Negriff, Ji and Trickett2011; Stattin, Kerr, & Skoog, Reference Stattin, Kerr and Skoog2011). Thus, early maturing youth not only negotiate puberty with fewer resources but also experience a more stressful transition.
Although these theories do not inherently implicate sex-differentiated processes, conventional wisdom and early empirical research fostered the idea that early maturation would confer costs for girls but benefits for boys (for reviews, see Huddleston & Ge, Reference Huddleston, Ge and Hayward2003; Mendle et al., Reference Mendle, Turkheimer and Emery2007; Mendle & Ferrero, Reference Mendle and Ferrero2012; Rudolph, Reference Rudolph, Lewis and Rudolph2014). Not only are many pubertal changes (e.g., increasing weight and body fat; menarche) associated with physical and psychological discomfort and social stress in girls (Mendle et al., Reference Mendle, Turkheimer and Emery2007; Susman & Dorn, Reference Susman, Dorn, Lerner and Steinberg2009), but also early maturing girls undergo these changes prior to their entire peer group. In contrast, early maturing boys experience some desirable changes (e.g., increasing muscle mass and athleticism; social prestige) prior to their peers, potentially leaving late-maturing boys at a disadvantage (Conley & Rudolph, Reference Conley and Rudolph2009). However, an increasingly nuanced perspective has recently emerged, driven in part by mixed evidence regarding the effects of puberty in boys (Mendle & Ferrero, Reference Mendle and Ferrero2012).
A sizable body of research supports the role of early maturation in depression (Graber et al., Reference Graber, Nichols and Brooks-Gunn2010; Mendle & Ferrero, Reference Mendle and Ferrero2012; Mendle et al., Reference Mendle, Turkheimer and Emery2007; Negriff & Susman, Reference Negriff and Susman2011; Rudolph, Reference Rudolph, Lewis and Rudolph2014). Relative to their on-time and late-maturing peers, early maturing girls experience heightened depression over time (Conley & Rudolph, Reference Conley and Rudolph2009; Ge et al., Reference Ge, Kim, Brody, Conger, Simons and Gibbons2003). In boys, studies alternately link late maturation (Dorn, Susman, & Ponirakis, Reference Dorn, Susman and Ponirakis2003), early maturation (Ge et al., Reference Ge, Kim, Brody, Conger, Simons and Gibbons2003; Rudolph & Troop-Gordon, Reference Rudolph and Troop-Gordon2010), or both (Kaltiala-Heino, Kosunen, & Rimpela, Reference Kaltiala-Heino, Kosunen and Rimpela2003) with internalizing symptoms. Of interest, one study suggested that late maturation was concurrently associated with depression but early maturation predicted depression across a 1-year period in boys (Conley & Rudolph, Reference Conley and Rudolph2009).
It is unfortunate that most research supporting puberty–depression linkages involves single or at best two assessments of depression, thereby limiting our knowledge about the enduring effects of off-time maturation. Moreover, initial and long-term effects of puberty could vary, perhaps accounting for some discrepant findings. Conclusions also may differ depending on the analytic approach; if initial pubertal timing is associated with concurrent depression, between-subject analyses could obfuscate effects over time (i.e., it would be hard to detect longitudinal effects when earlier depression is controlled). Between-subject designs make it difficult to determine the precise pattern of effects (e.g., whether puberty predicts increasing, decreasing, or stable levels of depression within individuals over time) or to document the absolute level of depression.
Early maturing girls may experience initial challenges, yet these adverse effects may dissipate as other girls catch up in status; alternatively, once early maturing girls are launched upon a trajectory of risk, accumulating consequences may continue to propel them along this path. In boys, early maturation may provide an initial edge as they acquire confidence and social stature, yet risks may accumulate over time as early maturing boys generate more stress in their relationships (Rudolph, Reference Rudolph2008) or suffer the long-term consequences of affiliating with risky peers (Weichold, Silbereisen, & Schmitt-Rodermund, Reference Weichold, Silbereisen, Schmitt-Rodermund and Hayward2003).
Only a few studies use multiple assessments of depression and/or within-subject analyses to examine the contribution of pubertal timing to depression and associated psychopathology. In one study, early maturation in 7th grade predicted psychological distress in girls (Ge, Conger, & Elder, Reference Ge, Conger and Elder1996) and in boys (Ge, Conger, & Elder, Reference Ge, Conger and Elder2001b) from early to midadolescence (8th, 9th, and 10th grades). A longer term follow-up with this sample revealed that early age of menarche predicted girls’ trajectories of depressive symptoms from 7th to 12th grades (Ge, Conger, & Elder, Reference Ge, Conger and Elder2001a). In a 4-year prospective study, Mendle, Harden, Brooks-Gunn, and Graber (Reference Mendle, Harden, Brooks-Gunn and Graber2010) reported that early maturing girls (in 3rd grade) and boys (in 4th grade) experienced increasing depression over time. DeRose, Shiyko, Foster, and Brooks-Gunn (Reference DeRose, Shiyko, Foster and Brooks-Gunn2011) found that early menarche in girls predicted peak levels of internalizing symptoms in 5th to 6th grade, with declines through age 15 (although early maturing girls still showed higher levels than late-maturing girls at this age). Joinson, Heron, Lewis, Croudace, and Araya (Reference Joinson, Heron, Lewis, Croudace and Araya2011) found that early menarche (before 11.5 years) predicted heightened depression in girls at both 13 and 14 years of age. Finally, Natsuaki, Biehl, and Ge (Reference Natsuaki, Biehl and Ge2009) found that both early and very late-maturing girls and boys experienced higher initial levels of depressive symptoms (at age 12), although early maturing girls were at the highest risk. Both early maturing girls and boys showed a very small decline in depressive symptoms through age 23 (peak symptoms occurred at ages 15–16), suggesting that the adverse effect dissipated gradually across late adolescence and early adulthood.
These few longer term studies suggest that pubertal timing may have distinct effects concurrently and over time. However, there is a scarcity of research that meets three important criteria within the same study: (a) involves a prospective design using within-subject analyses; (b) includes both girls and boys, allowing for direct comparisons; and (c) uses clinical interviews to assess depression, providing in-depth reports of depression from both youth and parents. To address this gap, Part 1 of this study aimed to examine sex differences in the contribution of pubertal timing to initial and emerging depression across 4 years. We hypothesized that (a) early maturation in girls would predict higher initial levels of depression and persistent or increasing depression over time, (b) early maturation in boys would predict lower initial levels of depression along with increasing depression over time, and (c) early maturation would predict higher levels of depression at the end of the study in both girls and boys. Tracking depression trajectories across several years provided unique information about initial versus enduring effects of pubertal timing.
Method
Participants
Participants were 167 youth (86 girls, 81 boys; M age at Wave 1 = 12.41 years, SD = 1.19; 77.8% White, 22.2% non-White) and their female caregivers (88.6% biological mothers; 1.8% stepmothers; 4.2% adoptive mothers; 5.4% other). Families were diverse in income (16.7% below $30,000, 48.7% $30,000–$59,999, 21.6% $60,000–$89,999, 13.0% over $90,000). Youth completed school-wide screenings with the Children's Depression Inventory (CDI; Kovacs, Reference Kovacs1992). The screening sample (N = 1,985) represented 80% of targeted participants. From this sample, we selected potential participants (n = 468) along the range of the CDI, oversampling slightly for youth with severe symptoms (15.8% of the screening sample, 20.3% of targeted youth, and 24.1% of recruited youth had scores >18). Participants were recruited based on CDI scores, having a maternal caregiver in the home, and proximity to the university, until the target sample was attained. Exclusion criteria included having a non-English-speaking maternal caregiver or a severe developmental disability.
Youth whose families agreed and declined participation in the study did not differ in sex, χ2 (N = 468, df = 1) = 0.39, ns, ethnicity (White vs. non-White), χ2 (N = 468, df = 1) = 0.02, ns, or CDI scores, t (280) = 1.11, ns. Participants (M = 12.41, SD = 1.19) were slightly younger than nonparticipants (M = 12.65, SD = 0.89), t (275) = 2.28, p < .05. Depression scores were available for 159 (95.2%), 157 (94%), and 152 (91%) youth at Wave 2 (W2), Wave 3 (W3), and Wave 4 (W4), respectively. Youth with and without W4 depression scores did not differ in sex, χ2 (N = 167, df = 1) = 2.18, ns, age, t (165) = 0.55, ns, ethnicity, χ2 (N = 167, df = 1) = 1.19, ns, or W1 depression, t (165) = 0.27, ns.
Procedures
Families were recruited through phone calls. Interested families completed an in-person, 3- to 4-hr initial assessment. Caregivers provided written informed consent; youth provided written assent. Youth and their caregivers were then interviewed separately. Follow-up interviews were completed 1, 2, and 3 years later. Families received a financial reimbursement and youth received a gift certificate. Diagnostic interviews were conducted by a faculty member in clinical psychology, a postdoctoral fellow in clinical psychology, psychology graduate students, or a post BA level research assistant. All diagnoses were made through consultation with a clinical psychology faculty member or postdoctoral student.
Measures
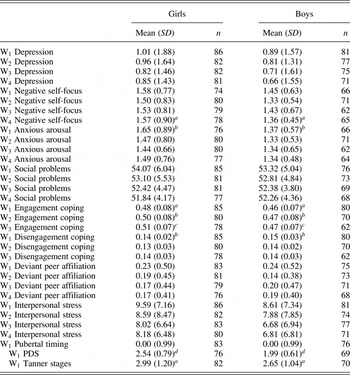
Table 1 presents descriptive data and sample sizes in girls and boys.
Descriptives

Note: W1, Wave 1; W2, Wave 2; W3, Wave 3; W4, Wave 4; PDS, Pubertal Development Scale.
a Means differ at p < .10.
b Means differ at p < .05.
c Means differ at p < .01.
d Means differ at p < .001.
Assessment of puberty
First, youth and caregivers completed the well-validated Pubertal Development Scale (PDS; Brooks-Gunn, Warren, Rosso, & Gargiulo, Reference Brooks-Gunn, Warren, Rosso and Gargiulo1987; Petersen, Crockett, Richards, & Boxer, Reference Petersen, Crockett, Richards and Boxer1988). This measure includes five questions assessing stage of growth spurt, body hair, skin changes, voice changes and facial hair (boys), and breast development and menarcheal status (girls) using a 4-point scale (1 = no development to 4 = development is complete). Onset of menarche is rated using a dichotomous response (1 = no, 4 = yes). Data were available for 132 youth and 140 caregivers. Because strong correlations were found between youth and caregiver reports (r = .88, p < .001, for girls; r = .72, p < .001, for boys), composites were formed for each item by averaging across informants (αs = 0.86 for girls and boys).
Second, youth and caregivers completed a well-validated line-drawing measure of the five Tanner stages (Morris & Udry, Reference Morris and Udry1980). Girls were rated on breast development and pubic hair growth; boys were rated on genital development and pubic hair growth. Participants checked which drawing most closely matched the youth's current stage. Data were available for 118 youth and 140 caregivers. Youth and caregiver reports were strongly correlated for girls (breast development: r = .83, p < .001; pubic hair development: r = .69, p < .001) and moderately correlated for boys (genital development: r = .47, p < .01; pubic hair development: r = .65, p < .001). Composites were formed for each of the two items by averaging across informants.
Confirmatory factor analyses in this data set yielded well-fitting measurement models using the seven items (five PDS and two Tanner) as indicators for a latent variable (Conley & Rudolph, Reference Conley and Rudolph2009). Thus, a composite score was created by standardizing the scores for each measure within sex and averaging the scores across the two measures. Higher scores reflected more advanced pubertal status. To create a timing index, residualized scores were computed separately for girls and boys by regressing pubertal status onto age. Higher scores reflected earlier maturation.
Assessment of depression
Trained interviewers administered the Schedule for Affective Disorders and Schizophrenia for School-Age Children (Orvaschel, Reference Orvaschel1995) to youth and caregivers; information was combined using a best-estimate approach (Klein, Ouimette, Kelly, Ferro, & Riso, Reference Klein, Ouimette, Kelly, Ferro and Riso1994). Based on DSM criteria, interviewers rated depressive psychopathology on a 5-point scale: 0 = no symptoms, 1 = mild symptoms, 2 = moderate symptoms, 3 = diagnosis with mild to moderate impairment, 4 = diagnosis with severe impairment. Separate ratings were assigned for each category of depression (e.g., major depression; dysthymia) and were summed to create continuous scores for the past year. Strong reliability was found (intraclass correlation coefficient [ICC] = 0.95). Across the four waves, 22% met diagnostic criteria for a depressive disorder at some point, and an additional 25% experienced depressive symptoms.
Results
Preliminary analyses of sex differences and intercorrelations
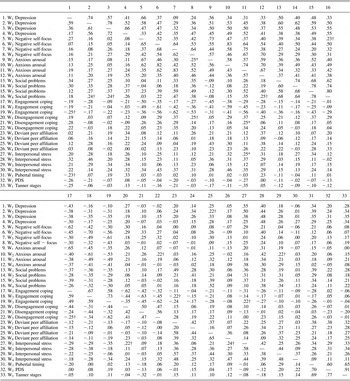
Based on the PDS, girls were significantly more developed than boys, t (140) = 4.71, p < .001. Based on self- and caregiver-reported Tanner stages, girls were somewhat more developed than boys, t (150) = 1.85, p = .07. There were no sex differences in depression at any wave, ts (150–165) < 1, ns, likely due to the age range of the sample; prior data from this sample reveal a sex difference at midpuberty (Tanner Stage 3 or above; Conley & Rudolph, Reference Conley and Rudolph2009). For descriptive purposes, Table 2 presents intercorrelations between puberty and depression.
Intercorrelations

Note: Correlations for girls/boys are above/below the diagonal. Correlations ≥|.25| are p < .05 unless otherwise noted. PDS, Pubertal Development Scale.
†p = .05. *p < .10.
Latent growth curve analysis
Overview
Latent growth curve analyses were conducted using Mplus software (Muthén & Muthén, Reference Muthén and Muthén1998–2007) to test the contribution of pubertal timing to W1 depression (initial levels), trajectories of depression across W1 to W4 (linear change), and W4 depression (enduring effects). Parameters were estimated using full information, maximum likelihood estimation (Enders & Bandalos, Reference Enders and Bandalos2001), allowing for the inclusion of all available data from the 167 participants. Model fit was evaluated using the χ2/df (values < 2.5 or 3 indicate good fit; Kline, Reference Kline1998), comparative fit index (CFI; values above 0.90 indicate good fit; Bollen, Reference Bollen1990), and root mean square error of approximation (RMSEA; values of 0.08 or less indicate good fit; Browne & Cudeck, Reference Browne and Cudeck1993). To examine sex differences, multigroup structural equation modeling was employed. Chi-square difference tests were used to compare models in which all parameters were freely estimated to models in which paths and variances were sequentially constrained to be equal for girls and boys.
In the first stage of analysis, latent growth models were estimated to establish (a) the initial level of depression and average rate of change in depression, (b) the average level of depression after 4 years, and (c) whether there was significant variance in the growth parameters. A latent intercept variable was estimated by setting indicator paths from the W1–W4 depression variables equal to 1. In the first model, a latent linear slope variable was estimated by setting the indicator paths from the W1–W4 depression variables equal to 0, 1, 2, and 3, respectively. By setting the path from W1 depression to the latent slope variable at 0, the intercept could be interpreted as youths’ level of depression at the onset of the study (Duncan, Duncan, Strycker, Li, & Alpert, Reference Duncan, Duncan, Strycker, Li and Alpert1999). Preliminary analyses indicated no quadratic change in the depression growth curve for girls or boys, and adding a quadratic term did not improve model fit. Thus, only linear change in depression was modeled. In the second model, the indicator paths from the W1–W4 depression variables to the latent slope variable were recentered to –3, –2, –1, and 0, respectively. By recentering the latent slope variable around the W4 assessment, the intercept could be interpreted as youths’ level of depression at the end of the study (Little, Bovaird, & Slegers, Reference Little, Bovaird, Slegers, Mroczek and Little2006). It should be noted that recentering the latent intercept does not affect the model's fit statistics or the means and variances of the latent slope variable; therefore, fit statistics are reported only for the first model. In the second stage of analysis, pubertal timing was added to the latent growth curve models as a predictor of W1 depression, linear change in depression, and W4 depression.
Growth trajectories of depression
The latent growth curve model for depression fit the data well, χ2 (10, N = 167) = 12.34, ns, χ2/df = 1.23, CFI = 0.99, and RMSEA = 0.053. Mean W1 levels of the intercept were 1.03 and 0.88 for girls and boys, respectively. Although there was significant variance in the latent intercept for all youth, there was more variance for girls (2.91, p < .001) than for boys (1.60, p < .001), Δχ2 (1) = 4.52, p < .05. The mean level of the latent slope was negative but nonsignificant (–0.06 and –0.09 for girls and boys, respectively), and there was significant variance in the latent slope (0.19 and 0.33, ps < .005, for girls and boys, respectively). Mean W4 levels of the intercept were 0.84 and 0.61 for girls and boys, respectively. The variance in the recentered latent intercept was significant and did not differ for girls and boys (2.23 and 1.50, ps < .001, for girls and boys, respectively).
Pubertal timing and trajectories of depression
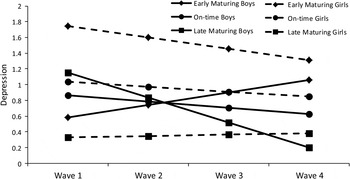
The addition of pubertal timing as a predictor of the depression latent intercept and slope yielded a good model fit, Δχ2 (14, N = 167) = 15.11, ns, CFI = 1.00, and RMSEA = 0.031. Early maturation significantly predicted higher initial (W1) depression for girls (0.41, p < .001) but not for boys (–0.23, ns), a significant sex difference, Δχ2 (1) = 13.31, p < .001. With regard to the latent slope, early maturation significantly predicted the rate of change in depression over time for boys (0.42, p < .001) but not for girls (–0.18, ns), a significant sex difference, Δχ2 (1) = 10.27, p < .001. Early maturation significantly predicted higher W4 depression for girls (0.38, p = .001) and for boys (0.29, p = .012). Figure 1 displays trajectories of depression estimated for early, on-time, and late-maturing (±1 SD) girls and boys. Early maturing girls showed high initial depression that remained stable across the study. Early maturing boys showed significantly lower initial depression than did early maturing girls, Δχ2 (1) = 9.82, p = .002. However, there was no significant difference in depression between early maturing girls and boys by W4, Δχ2 (1) = 0.61, ns. Late-maturing boys showed significantly higher initial depression than did late-maturing girls, Δχ2 (1) = 5.17, p = .02. However, this difference had dissipated by W4, Δχ2 (1) = .34, ns.
Estimated trajectories of depression for early, on-time, and late-maturing girls and boys.

Discussion
Although the contribution of pubertal timing to depression is well established, research is limited by an overreliance on cross-sectional or two-wave longitudinal designs and failure to track within-individual change over time. These constraints raise three critical substantive questions: (a) Does off-time maturation generate temporary perturbations in depression during or shortly after onset of puberty (or lack of onset in late-maturing youth) or do adverse effects endure across adolescence? (b) If off-time maturation exerts both initial and long-term effects, are these effects similar? (c) Does puberty predict similar or different absolute levels of depression in girls and boys? Tracking individual changes in depression over time, Part 1 of this study reveals that the consequences of early maturation for depression persist across 4 years and there are key sex-linked differences between the initial and long-term effects.
Consistent with the stage-termination hypothesis, early maturation predicted elevated initial depression (reflecting close to “moderate” symptoms, consistent with a diagnosis of minor depression) in girls. As reflected in a significant sex difference, the effect for boys was opposite in direction (albeit nonsignificant), and late-maturing boys showed significantly higher initial depression than did late-maturing girls. Examining trajectories over time, early maturation predicted stable high depression in girls and increasing depression in boys; early maturing girls and boys did not significantly differ by the end of the study. These findings indicate the need to consider not only patterns of change but also absolute levels of psychopathology over time. That is, early maturation created an early and stable risk in girls. In contrast, this timing somewhat favored boys initially but posed a risk over time; late-maturing boys ultimately showed the lowest level of depression (close to none) overall.
These results confirm the differing significance of off-time development for initial versus emerging depression in boys, demonstrating the importance of tracking symptoms within individuals over time. Some of the desirable aspects of puberty may provide a brief psychological and social boost to boys when they first appear but perhaps are overcome by longer term adverse effects that trigger depression over time (Mendle et al., Reference Mendle, Harden, Brooks-Gunn and Graber2010). Our results for girls generally are consistent with prior research. In this study, trajectories were high and stable over time; in others, early maturing girls showed increasing (Ge et al., Reference Ge, Conger and Elder2001a; Mendle et al., Reference Mendle, Harden, Brooks-Gunn and Graber2010) or curvilinear (increasing and then slightly decreasing; DeRose et al., Reference DeRose, Shiyko, Foster and Brooks-Gunn2011; Natsuaki et al., Reference Natsuaki, Biehl and Ge2009) trajectories over time. The precise nature of the trajectories likely depends on the age range and length of follow-up. However, studies converge on the conclusion that (a) early maturing girls face the highest risk for depression early in adolescence and (b) this effect persists for at least several years. In sum, both early maturing girls and boys show distinct risks for depression across adolescence, leaving open the question of the processes through which this risk emerges.
Part 2: Examining Personal and Contextual Mediators of Pubertal Timing Effects
The second goal of this research was to identify specific pathways through which pubertal timing contributes to initial, emerging, and enduring depression across adolescence. Pioneering (Petersen & Taylor, Reference Petersen, Taylor and Adelson1980) and contemporary (Ge & Natsuaki, Reference Ge and Natsuaki2009; Graber et al., Reference Graber, Nichols and Brooks-Gunn2010; Ladouceur, Reference Ladouceur2012; Mendle et al., Reference Mendle, Turkheimer and Emery2007; Natsuaki, Samuels, & Leve, Reference Natsuaki, Samuels, Leve, McLean and Syed2014; Rudolph, Reference Rudolph, Lewis and Rudolph2014) theoretical models of puberty emphasize how the transition through puberty and its timing contribute to personal and contextual risks in ways that trigger psychopathology. In particular, several models suggest that physical changes associated with the pubertal transition can create psychological instability and social disruption, which then heighten risk for depression (Rudolph, Reference Rudolph, Lewis and Rudolph2014). The timing of these effects may differ in girls and boys, resulting in differing temporal profiles of depression.
Drawing from contemporary multilevel conceptualizations of psychopathology (e.g., Cicchetti, Reference Cicchetti, Beauchaine and Hinshaw2008, Reference Cicchetti2013; Cicchetti & Curtis, Reference Cicchetti and Curtis2007; Cicchetti & Dawson, Reference Cicchetti and Dawson2002; Cicchetti & Valentino, Reference Cicchetti, Valentino and Masten2007) and, more specifically, from current perspectives on puberty as a context of risk for psychopathology (Graber et al., Reference Graber, Nichols and Brooks-Gunn2010; Mendle et al., Reference Mendle, Turkheimer and Emery2007; Rudolph, Reference Rudolph, Lewis and Rudolph2014), we focused on three levels of risk hypothesized to account for the adverse effects of pubertal timing on depression: psychological, social–behavioral, and interpersonal. Given the Part 1 findings, we sought to identify risks accounting for an early and stable risk for depression in early maturing girls (as reflected in a proximal and enduring risk model) and an emerging risk for depression in early maturing boys (as reflected in a progressive risk model).
Multilevel pathways of risk in girls
Psychological risk
As the first in their peer group to experience the changes of puberty, early maturing girls may feel particularly self-conscious and insecure. Some of the associated somatic changes of girls’ maturation represent a move away from Western cultural ideals of thinness and attractiveness, thereby undermining self-image (Alsaker, Reference Alsaker1992; Stice, Presnell, & Bearman, Reference Stice, Presnell and Bearman2001; Williams & Currie, Reference Williams and Currie2000). Moreover, self-evaluation, social comparison, and attention to social stimuli increase throughout adolescence (Harter, Reference Harter1990; Herba & Phillips, Reference Herba and Phillips2004; Somerville, Reference Somerville2013), particularly during puberty (Silk, Davis, McMakin, Dahl, & Forbes, Reference Silk, Davis, McMakin, Dahl and Forbes2012). Early maturing girls are the first in their cohort to experience the morphological transformation; thus, their feelings of “being different” and their desire to “fit in” may heighten their sensitivity to self- and social scrutiny (Blumenthal et al., Reference Blumenthal, Leen-Feldner, Babson, Gahr, Trainor and Frala2011). Because early maturing girls show lasting differences in their body size and shape (heavier weight and higher body mass index; Lee et al., Reference Lee, Appugliese, Kaciroti, Corwyn, Bradley and Lumeng2007), these effects may endure over time.
The pubertal transition also is a time of heightened emotional arousal. Hormonal changes and transformations in brain structure and function foster a disjuncture between systems involved in the regulation of arousal and emotion and those involved in the cognitive modulation of behavior (Ladouceur, Reference Ladouceur2012), thereby compromising emotion regulation and heightening stress reactivity (Dahl & Gunnar, Reference Dahl and Gunnar2009; Silk et al., Reference Silk, Siegle, Whalen, Ostapenko, Ladouceur and Dahl2009). This emerging imbalance between reactivity and regulation may create a fertile ground for emotional arousal (Graber, Brooks-Gunn, & Warren, Reference Graber, Brooks-Gunn and Warren2006), particularly anxiety (Hayward et al., Reference Hayward, Killen, Wilson, Hammer, Litt and Kraemer1997; Silbereisen & Kracke, Reference Silbereisen, Kracke, Schulenberg, Maggs and Hurrelman1997; for a review, see Reardon, Leen-Feldner, & Hayward, Reference Reardon, Leen-Feldner and Hayward2009), stemming perhaps from ambiguity about the impending changes of adolescence (Natsuaki, Leve, & Mendle, Reference Natsuaki, Leve and Mendle2011). Early maturation may amplify this anxiety given that girls who mature before their peers have less exposure to, and understanding of, pubertal changes than their on-time and later maturing peers.
We therefore anticipated that early maturation in girls would predict psychological risk, as reflected in negative self-focus (tendency to engage in negative self-evaluation, social comparison, and excessive concern about social evaluation; Rudolph & Troop-Gordon, Reference Rudolph and Troop-Gordon2010) and anxious arousal (physiological arousal and somatic tension; Clark & Watson, Reference Clark and Watson1991; Heller & Nitschke, Reference Heller and Nitschke1998).
Social–behavioral risk
According to the developmental readiness hypothesis, early maturing girls have insufficient cognitive preparation and environmental support for acquiring the skills needed to deal with the demands of puberty. Because their physical growth outpaces their psychological development, a gap arises between biological maturity and cognitive, emotional, and social maturity (Ge & Natsuaki, Reference Ge and Natsuaki2009). This gap may be reflected in compromised social–behavioral competence (Negriff, Hillman, & Dorn, Reference Negriff, Hillman and Dorn2011). During adolescence, peer group conformity assumes utmost importance; early maturing girls, who stand out among peers, may feel alienated from their age mates, causing them to withdraw from the peer group and to display more social problems. Moreover, their underdeveloped self-regulatory skills may lead them to feel overwhelmed when faced with social stressors, thereby undermining their ability to cope effectively (Sontag, Graber, Brooks-Gunn, & Warren, Reference Sontag, Graber, Brooks-Gunn and Warren2008). We therefore anticipated that early maturation in girls would predict social–behavioral risk, as reflected in social problems and maladaptive coping with interpersonal stress (less engagement coping, such as problem solving and emotion regulation; more disengagement coping, such as avoidance and denial; Compas, Connor-Smith, Saltzman, Thomsen, & Wadsworth, Reference Compas, Connor-Smith, Saltzman, Thomsen and Wadsworth2001).
Interpersonal risk
The pernicious effects of early maturation extend into girls’ interpersonal worlds. Despite a few perceived social advantages of puberty, early maturation exposes girls to many social challenges (Rudolph, Reference Rudolph, Lewis and Rudolph2014). Early maturation singles girls out as different from peers, with the potential for eliciting teasing, harassment, and victimization (Craig, Pepler, Connolly, & Henderson, Reference Craig, Pepler, Connolly, Henderson, Juvonen and Graham2001; Haynie & Piquero, Reference Haynie and Piquero2006; Reynolds & Juvonen, Reference Reynolds and Juvonen2011) and associated social stressors (e.g., poor quality friendships; peer isolation or conflict; Conley, Rudolph, & Bryant, Reference Conley, Rudolph and Bryant2012). Driven by a tendency to affiliate with similar peers, early maturing girls also befriend older youth, who are more likely to engage in norm-breaking behavior (Weichold et al., Reference Weichold, Silbereisen, Schmitt-Rodermund and Hayward2003). Both early maturation per se and immersion in older and riskier peer contexts may launch early maturing girls into premature dating, romantic relationships, and sexual activity (Compian & Hayward, Reference Compian, Hayward and Hayward2003; Stattin et al., Reference Stattin, Kerr and Skoog2011), which can create heightened stress in opposite-sex relationships (Llewellyn, Rudolph, & Roisman, Reference Llewellyn, Rudolph and Roisman2012). Within the family, tension may arise as early maturing girls anticipate privileges and autonomy associated with advancing maturation while parents have heightened concerns about the mismatch between physical and chronological development (Paikoff & Brooks-Gunn, Reference Paikoff and Brooks-Gunn1991; Rudolph, Reference Rudolph, Lewis and Rudolph2014). These differing expectations may undermine family relationships and generate conflict. We therefore anticipated that early maturation in girls would predict interpersonal risk, as reflected in deviant peer affiliation and interpersonal stress.
Links with depression
Consistent with a proximal and enduring risk model, psychological, social–behavioral, and interpersonal risks were expected to contribute to heightened depression proximal to early maturation as well as enduring depression (i.e., higher levels of depression several years later). With regard to psychological risk, youth who consistently focus on negative aspects of the self and feel they fall short when making comparisons to peers are likely to overreact to perceived slights, causing them to be emotionally vulnerable and prone to depression (Rudolph & Troop-Gordon, Reference Rudolph and Troop-Gordon2010). Anxiety also acts as an antecedent and risk factor for subsequent depression (Silk et al., Reference Silk, Davis, McMakin, Dahl and Forbes2012). With regard to social–behavioral risk, social withdrawal (Rubin, Coplan, & Bowker, Reference Rubin, Coplan and Bowker2009) and compromised social competence (Cole, Martin, Powers, & Truglio, Reference Cole, Martin, Powers and Truglio1996) serve as catalysts for adolescent depression (for a review, see Rudolph & Flynn, Reference Rudolph, Flynn, Gotlib and Hammen2014). Likewise, a reliance on disengagement rather than engagement coping in the context of social stress may perpetuate rather than resolve stressors and even generate more stress, instilling negative affect, low self-efficacy, and feelings of hopelessness and consequent depression (Agoston & Rudolph, Reference Agoston and Rudolph2011; Flynn & Rudolph, Reference Flynn and Rudolph2011). With regard to interpersonal risk, the consequences of affiliating with deviant peers (Benoit, Lacourse, & Claes, Reference Benoit, Lacourse and Claes2013; Fergusson, Wanner, Vitaro, Horwood, & Swain-Campbell, Reference Fergusson, Wanner, Vitaro, Horwood and Swain-Campbell2003), as well as exposure to high levels of interpersonal stress (Rudolph, Flynn, Abaied, Groot, & Thompson, Reference Rudolph, Flynn, Abaied, Groot and Thompson2009), may set the stage for depression.
Only a small body of research directly examines pathways linking early maturation and depression in girls (Rudolph, Reference Rudolph, Lewis and Rudolph2014). Examining psychological risk, studies support mediation effects for poor self (body) image (Ge, Elder, Regnerus, & Cox, Reference Ge, Elder, Regnerus and Cox2001; Stice et al., Reference Stice, Presnell and Bearman2001) and emotional (anxious) arousal (Graber et al., Reference Graber, Brooks-Gunn and Warren2006). Providing indirect support for the role of anxious arousal, heightened cortisol reactivity to social stress partially accounts for higher internalizing symptoms in early maturing girls (Natsuaki et al., Reference Natsuaki, Biehl and Ge2009). Examining social–behavioral risk, one study found that low perceived competence (including social) mediated the link between more advanced menarcheal status but not pubertal timing and internalizing symptoms (Negriff et al., Reference Negriff, Hillman and Dorn2011). Another study revealed that early maturation predicted less engagement coping (specifically primary control) in girls; however, a nonsignificant association between early maturation and internalizing symptoms precluded a test of mediation (Sontag et al., Reference Sontag, Graber, Brooks-Gunn and Warren2008). Examining contextual risk, exposure to stress within peer (Conley et al., Reference Conley, Rudolph and Bryant2012) and other-sex (Llewellyn et al., Reference Llewellyn, Rudolph and Roisman2012) relationships, as well as being the victim of rumor spreading (Reynolds & Juvonen, Reference Reynolds and Juvonen2011), partially mediate the contribution of early maturation to depression. It is unfortunate that these studies primarily involve concurrent tests of mediation (for exceptions, see Conley et al., Reference Conley, Rudolph and Bryant2012; Reynolds & Juvonen, Reference Reynolds and Juvonen2011), thereby preventing conclusions about the potential enduring effects of these risks on depression.
In this study, we expected risk in early maturing girls to take the form of a proximal and enduring risk model, wherein (a) early maturation predicts higher initial levels of psychological, social–behavioral, and interpersonal risks in girls, which predict depression at the onset of the study, and (b) initial levels and/or increasing levels of risk over time contribute to enduring depression, such that these risks mediate the contribution of early maturation to heightened depression at the end of the study. In this way, the hypothesized multilevel risks would account for the observed pattern of early and stable susceptibility to depression in early maturing girls.
Multilevel pathways of risk in boys
Both theory and research on the consequences of pubertal timing in boys lag far behind that in girls. In boys, physical changes of puberty (e.g., increases in height and musculature; a deepening voice and growth of body hair; genital development) represent a move toward Western cultural ideals of masculinity, strength, and athleticism. Because these changes are personally and socially valued, they may boost self-esteem and confer social prestige (Huddleston & Ge, Reference Huddleston, Ge and Hayward2003; Mendle & Ferrero, Reference Mendle and Ferrero2012). Early maturing boys are the first to attain these attributes, potentially protecting them from psychological, social–behavioral, and interpersonal risks.
Consistent with these ideas, early maturing boys hold more positive self-perceptions (specifically body image; Alsaker, Reference Alsaker1992; Wichstrom, Reference Wichstrom1999) than late-maturing boys, who show more self-derogation (Benjet & Hernández-Guzmán, Reference Benjet and Hernández-Guzmán2002). Early maturing boys also experience less stressful other-sex relationships than late-maturing counterparts (Llewellyn et al., Reference Llewellyn, Rudolph and Roisman2012). However, the few studies documenting these effects primarily rely on concurrent designs (for an exception, see Taga, Markey, & Friedman, Reference Taga, Markey and Friedman2006). It is possible that the benefits of being early maturers are short-lived in boys. Over time, as early maturing boys gradually face the changing demands associated with puberty (e.g., assuming more responsibility and independence; acting in a more mature fashion) or attempt to take on adult roles and behaviors before fully prepared, their resources may become increasingly taxed. They also may become disillusioned when the anticipated benefits of more mature status are not always realized. These challenges and disappointments may gradually undermine their well-being over time, leading to increasing psychological and social–behavioral risks and consequent depression. Moreover, given early maturing boys’ propensity for entering riskier social contexts through earlier exposure to romantic and sexual relationships as well as affiliation with deviant peers (Mendle & Ferrero, Reference Mendle and Ferrero2012; Weichold et al., Reference Weichold, Silbereisen, Schmitt-Rodermund and Hayward2003), they may experience a cascade of adverse interpersonal effects (e.g., conflict and victimization resulting from deviant peer affiliation; stressful interpersonal consequences of early romantic activity or norm-breaking behavior) that eventuate in depression (Fergusson et al., Reference Fergusson, Wanner, Vitaro, Horwood and Swain-Campbell2003; Mendle & Ferrero, Reference Mendle and Ferrero2012). Consistent with the idea that effects accumulate over time in boys, one study found that declines in peer relationship quality mediated the contribution of early maturation to increases in boys’ depressive symptoms (Mendle, Harden, Brooks-Gunn, & Graber, Reference Mendle, Harden, Brooks-Gunn and Graber2012).
In this study, we expected risk in early maturing boys to take the form of a progressive risk model, wherein early maturation predicts increasing levels of psychological, social–behavioral, and interpersonal risks in boys over time, which predict (a) increasing trajectories of depression and (b) heightened depression at the end of the study. In this way, the hypothesized multilevel risks would account for the observed pattern of emerging susceptibility to depression in early maturing boys.
Study overview
Despite a prominent focus on pubertal timing as a risk for depression, little is known about explanatory processes. Part 2 of this study took a multilevel approach to addressing this gap, aiming to understand how the developmental context of puberty set into motion psychological, social–behavioral, and interpersonal risks that accounted for early and stable susceptibility to depression in girls (a proximal and enduring risk model) and emerging susceptibility to depression in boys (a progressive risk model) across 4 years. Using this multilevel longitudinal design, this research built significantly on prior investigations by tracking processes accounting for depression differentially in girls and boys over time.
In particular, we used latent growth curve analysis to examine the following hypotheses: (a) in girls, early maturation would predict heightened risks at the study onset, which would then predict heightened initial levels of depression (Hypothesis Set 1); (b) in boys, early maturation would predict increasing risks over time, which would then predict increasing depression (Hypothesis Set 2); and (c) initial levels of risks (for girls; Hypothesis Set 3a) and increases in risks over time (for girls and boys; Hypothesis Set 3b) would account for the contribution of early maturation to heightened depression at the end of the study.
Method
Data were drawn from the same study described in Part 1, and thus participants and procedures were identical. Youth without W4 depression scores reported less W1 effortful engagement than those with W4 depression scores, t (163) = 3.97, p < .01 but did not differ in any of the other mediators at W1, ts (140–165) ≤ 1.54, ns. Life stress interviews were conducted by a postdoctoral student in clinical psychology, psychology graduate students, a post BA-level research assistant, or advanced undergraduate students. To avoid contamination of the diagnostic and life stress information, two different staff members conducted these interviews.
Measures
Pubertal timing and depression were assessed as described in Part 1. Table 1 presents descriptive data and sample sizes in girls and boys. Each measure was completed at each of the four waves, except for the responses to stress measure, completed only at the first three waves.
Assessment of psychological risk
Negative self-focus
Youth completed an eight-item questionnaire assessing negative judgments about their abilities or worth, a focus on social comparison, and concerns about social evaluation (e.g., “I was disappointed in myself,” “I felt like other kids were better than me,” “I worried about what other people thought of me”). They rated how much each item described them on a 5-point scale (1 = not at all to 5 = very much). Scores were computed as the average of the eight items, with higher scores reflecting more negative self-focus. The measure had high internal consistency (average α = 0.85) and was relatively stable across 1-year intervals (rs = .57–.65, ps < .001). Providing evidence of validity, the negative self-focus measure correlates significantly with a variety of associated constructs tapping negative self-appraisals, including social-evaluative concerns, negative relational self-views, lower levels of perceived control, and a negative attributional style (|r|s = .39–.57, ps < .001).
Anxious arousal
Youth completed a six-item questionnaire assessing symptoms of anxious arousal, as reflected in physiological arousal (e.g., “I felt dizzy or lightheaded, like I might faint”) as well as nonsomatic aspects of arousal (e.g., “I felt like I could not relax”) and fatigue (e.g., “I got tired easily”). They rated how much each item described them on a 5-point scale (1 = not at all to 5 = very much). Scores were computed as the average of the six items, with higher scores reflecting more anxious arousal. The measure had high internal consistency (average α = 0.91) and was relatively stable across 1-year intervals (rs = .58–.63, p < .001). Anxious arousal is viewed as a specific marker of anxiety rather than generalized negative affect. Providing evidence of concurrent validity, the anxious arousal measure correlates significantly with the Revised Children's Manifest Anxiety Scale (Reynolds & Richmond, Reference Reynolds and Richmond1978), a measure of general anxiety (rs = .75–.83, p < .001). Providing evidence of discriminant validity, the anxious arousal measure shows a modest correlation with a measure of positive affect, viewed as a specific marker of depression (rs = –.27 to −.33, p < .001).
Assessment of social–behavioral risk
Social problems
Parents completed the withdrawn and social problems subscales of the Child Behavior Checklist (CBCL; Achenbach & Rescorla, Reference Achenbach and Rescorla2001). The withdrawn subscale includes 9 items assessing withdrawn behavior (e.g., “Withdrawn, doesn't get involved with others,” “Shy or timid”). The social problems subscale includes 13 items assessing social difficulties (e.g., “Gets teased a lot,” “Not liked by other kids”). Mothers rated on a 3-point scale (0 = not true, 1 = somewhat or sometimes true, 2 = very true or often true) the extent to which each item applied to youth. A T score was computed for each subscale. Because the subscales were significantly correlated (rs = .50–.60, ps < .001) and hypotheses were the same for the two subscales, these scores were averaged to create a social problems composite. The CBCL has been found to distinguish clinical and nonclinical groups (Achenbach, Reference Achenbach1991) and the factor structure has been validated in numerous samples (for a review, see Achenbach et al., Reference Achenbach, Becker, Döpfner, Heiervang, Roessner and Steinhausen2008).
Coping behavior
Youth completed the engagement and disengagement coping subscales of the Responses to Stress Questionnaire (Connor-Smith, Compas, Wadsworth, Thomsen, & Salzman, Reference Connor-Smith, Compas, Wadsworth, Thomsen and Saltzman2000). The engagement coping subscale includes 21 items assessing efforts to resolve stressors or one's response to stressors (e.g., problem solving and emotion regulation) or to adapt to stressors (e.g., cognitive restructuring and positive thinking). The disengagement coping subscale includes 9 items assessing efforts to orient oneself away from stressors or one's response to stressors (e.g., denial, avoidance, and wishful thinking). Youth rated how much they engaged in each type of response to peer stressors on a 4-point scale (1 = not at all to 4 = a lot). Consistent with prior research (Connor-Smith et al., Reference Connor-Smith, Compas, Wadsworth, Thomsen and Saltzman2000; Flynn & Rudolph, Reference Flynn and Rudolph2007), to correct for base-rate differences in the endorsement of coping (Compas et al., Reference Compas, Connor-Smith, Saltzman, Thomsen and Wadsworth2001), proportion scores were calculated as the total score for each subscale divided by the total score on the Responses to Stress Questionnaire, with higher scores reflecting higher levels of each type of response. The engagement coping (average α = 0.88) and disengagement coping (average α = 0.81) subscales had high internal consistency and were relatively stable across 1-year intervals (rs = .64–.68, p < .001 and rs = .46–.53, p < .001, respectively). Confirmatory factor analyses support distinctions between engagement and disengagement coping (Connor-Smith et al., Reference Connor-Smith, Compas, Wadsworth, Thomsen and Saltzman2000). Correlations with another well-validated measure of coping establish strong convergent and discriminant validity of the individual subscales (Connor-Smith et al., Reference Connor-Smith, Compas, Wadsworth, Thomsen and Saltzman2000).
Assessment of interpersonal risk
Deviant peer affiliation
To assess deviant peer affiliation, mothers rated a single item (“Hangs around with others who get in trouble”) from the CBCL (Achenbach & Rescorla, Reference Achenbach and Rescorla2001) on a 3-point scale (0 = not true, 1 = somewhat or sometimes true, 2 = very true or often true). Single-item ratings of deviant peer affiliation have established validity (Benoit et al., Reference Benoit, Lacourse and Claes2013).
Interpersonal stress
The Youth Life Stress Interview (Rudolph & Flynn, Reference Rudolph and Flynn2007) was administered to assess interpersonal stress. This semistructured interview includes an initial open-ended question, followed by detailed probes to elicit information about the nature, intensity, timing, and context of episodic stressors experienced by youth during the preceding year. Interviewers present a narrative summary of each event to a team of coders with no prior knowledge about the youth's diagnostic status or subjective reaction. Integrating information across youth and caregiver reports, the coders rated the stressfulness of each event, from 1 (no negative stress) to 5 (severe negative stress); events with ratings of 1 were excluded. The coders also categorized each event as either interpersonal or noninterpersonal. Given the present focus on interpersonal stress, a composite score of interpersonal stress was calculated by summing the stress ratings across all relevant events. High reliability was achieved for ratings of stress (ICC = 0.90) and event categorization (Cohen κ = 0.92).
Results
Preliminary analysis of sex differences and intercorrelations
Compared to boys, girls reported significantly more W1 anxious arousal and somewhat more W4 negative self-focus. Girls reported more engagement coping than boys at each wave, although only marginally at W1. Boys reported significantly more W1 disengagement coping than girls (Table 1). For descriptive purposes, Table 2 presents intercorrelations among puberty, hypothesized mediators, and depression.
Latent growth curve analyses
Overview
Latent growth curve analyses were conducted to identify sex differences in psychological, social–behavioral, and interpersonal risks accounting for the contribution of pubertal timing to W1 depression (initial levels), trajectories of depression across W1 to W4 (linear change), and W4 depression (enduring effects). Latent growth trajectories of each risk were tested separately as mediators of the links between pubertal timing and depression. Latent intercept variables were estimated by setting indicator paths from the W1–W4 mediators equal to 1. A latent linear slope variable was estimated by setting the indicator paths from the W1–W4 mediator variables equal to 0, 1, 2, and 3, respectively.Footnote 1 In each model, the latent intercept and slope of the mediator were predicted by pubertal timing. Latent growth trajectories of depression were estimated first with depression centered at W1 (i.e., with the indicator paths from W1–W4 depression to the latent slope variable set to 0, 1, 2, and 3, respectively) and then with depression recentered at W4 (i.e., with the indicator paths from W1–W4 depression to the latent slope variable set to –3, –2, –1, and 0, respectively).
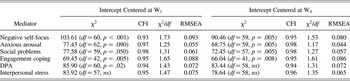
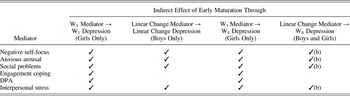
To test whether (a) the initial effect of early maturation on W1 depression in girls was due to initial levels of the mediators (Hypothesis Set 1) as well as (b) the effect of early maturation on increases in depression in boys was due to increasing levels of the mediators (Hypothesis Set 2), models were first examined including trajectories of depression centered at W1. Paths were included from the latent intercept of the mediator to the latent intercept and slope of depression as well as from the latent slope of the mediator to the latent slope of depression. Full results from these models are reported in the text, Table 3 (model fit statistics) and Table 4 (qualitative summary of which hypotheses were supported by the data), and Figures 2–6. To test whether the enduring effects of early maturation on W4 depression in girls and boys were due to initial levels of the mediators (for girls; Hypothesis Set 3a) or changes in the mediator over time (for girls and boys; Hypothesis Set 3b), models were then examined including trajectories of depression centered at W4, with a path added from the latent slope of the mediator to the latent intercept of depression. To reduce redundancy in reporting similar effects for the first and second set of models, only unique findings relevant to the enduring effects of early maturation on W4 depression are presented for the second set of models. The significance of indirect effects was examined using the Sobel test (Sobel, Reference Sobel1982) and bootstrapped confidence intervals using 5,000 resamples (MacKinnon, Lockwood, & Williams, Reference MacKinnon, Lockwood and Williams2004).
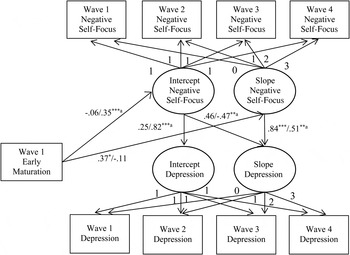
Latent growth curve analysis of the contribution of early maturation to trajectories of depression through trajectories of negative self-focus with the latent intercept of depression centered at Wave 1. Coefficients for boys are left of the slash, and coefficients for girls are right of the slash. aSignificant sex difference. *p < .05. **p < .01. ***p < .001.

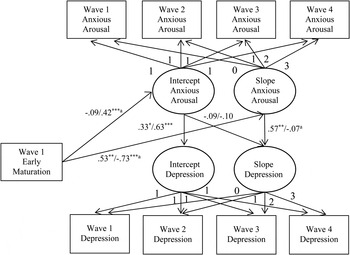
Latent growth curve analysis of the contribution of early maturation to trajectories of depression through trajectories of anxious arousal with the latent intercept of depression centered at Wave 1. Coefficients for boys are left of the slash, and coefficients for girls are right of the slash. aSignificant sex difference. *p < .05. **p < .01. ***p < .001.

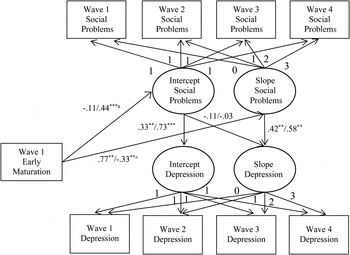
Latent growth curve analysis of the contribution of early maturation to trajectories of depression through trajectories of social problems with the latent intercept of depression centered at Wave 1. Coefficients for boys are left of the slash, and coefficients for girls are right of the slash. aSignificant sex difference. *p < .05. **p < .01. ***p < .001.

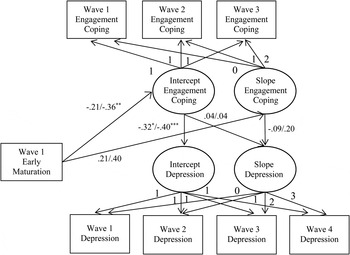
Latent growth curve analysis of the contribution of early maturation to trajectories of depression through trajectories of engagement coping with the latent intercept of depression centered at Wave 1. Coefficients for boys are left of the slash, and coefficients for girls are right of the slash. aSignificant sex difference. *p < .05. **p < .01. ***p < .001.

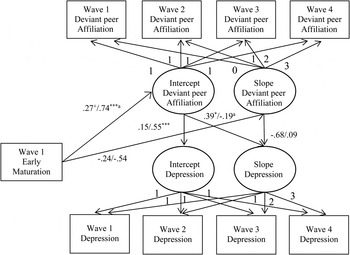
Latent growth curve analysis of the contribution of early maturation to trajectories of depression through trajectories of deviant peer affiliation with the latent intercept of depression centered at Wave 1. Coefficients for boys are left of the slash, and coefficients for girls are right of the slash. aSignificant sex difference. +p = .06. *p < .05. **p < .01. ***p < .001.

Fit statistics for models testing mediators of the association between early maturation and depression

Note: Fit statistics changed after recentering the intercept at W4 as a result of the additional path from the slope of the mediators to W4 depression as well as slight changes to the model (noted in the text) to improve model fit. W1, Wave 1; W4, Wave 4; CFI, comparative fit index; RMSEA, root mean square error of approximation; DPA, deviant peer affiliation.
Summary of support for hypotheses regarding indirect pathways from early maturation to depression

Note: W1, Wave 1; W4, Wave 4; ✓, support for this hypothesis was found; ✓(b), support for this hypothesis was found only for boys; DPA, deviant peer affiliation.
Psychological pathways
Negative self-focus
Figure 2 presents standardized parameter estimates for the negative self-focus model with depression centered at W1. To improve model fit, the residual variances of the negative self-focus latent intercept and slope were allowed to covary (–0.74, p < .001, and –0.34, p = .03, for boys and girls, respectively). Early maturation predicted heightened negative self-focus at the onset of the study for girls but not boys, a significant sex difference, Δχ2 (1) = 5.96, p = .01. In turn, W1 negative self-focus predicted higher initial levels of depression for girls but not boys, a significant sex difference, Δχ2 (1) = 9.70, p = .002. As expected, for girls, there was a significant indirect effect of early maturation on initial levels of depression through heightened W1 negative self-focus (0.50, p = .007, 95% confidence interval [CI] = 0.08, 1.04; Hypothesis 1).
For boys but not girls, early maturation predicted increases in negative self-focus, although this sex difference was not significant, Δχ2 (1) = 2.37, ns. In turn, increases in negative self-focus predicted increases in depression for both boys and girls, although this effect was stronger for boys than girls, Δχ2 (1) = 9.76, p = .002. As expected, for boys, early maturation was indirectly related to increases in depression through increases in negative self-focus (0.17, p = .02, 95% CI = 0.03, 0.67; Hypothesis 2).
With the depression intercept recentered at W4, an error covariance between the W2 and W3 depression variables was added for girls (0.49, p < .001). For girls but not boys, W1 negative self-focus predicted W4 depression, a significant sex difference, Δχ2 (1) = 8.78, p = .003, resulting in the expected significant indirect effect of early maturation on W4 depression through heightened W1 negative self-focus (0.32, p = .005, 95% CI = 0.04, 0.82; Hypothesis 3a). For boys but not girls, increases in negative self-focus predicted W4 depression, a significant sex difference, Δχ2 (1) = 9.39, p = .002, resulting in the expected significant indirect effect of early maturation on W4 depression through increases in negative self-focus (0.46, p = .006, 95% CI = 0.12, 0.94; Hypothesis 3b).
Anxious arousal
Figure 3 presents standardized parameter estimates for the anxious arousal model with depression centered at W1. Early maturation predicted heightened anxious arousal at the onset of the study for girls but not boys, a significant sex difference, Δχ2 (1) = 9.38, p = .002. In turn, W1 anxious arousal predicted higher initial levels of depression for girls and boys. As expected, for girls, there was a significant indirect effect of early maturation on initial levels of depression through heightened W1 anxious arousal (0.45, p = .004, 95% CI = 0.12, 0.85; Hypothesis 1).
Early maturation also predicted increases in anxious arousal for boys and decreases in anxious arousal for girls, a significant sex difference, Δχ2 (1) = 19.82, p < .001. In turn, increases in anxious arousal predicted increases in depression for boys but not girls, a significant sex difference, Δχ2 (1) = 12.04, p < .001. As expected, for boys, early maturation was indirectly related to increases in depression through increases in anxious arousal (0.17, p = .002, 95% CI = 0.07, 0.35; Hypothesis 2).
With the depression intercept recentered at W4, for girls but not boys, W1 anxious arousal predicted W4 depression, although this sex difference only approached significance, Δχ2 (1) = 6.19, p = .06. The expected significant indirect effect of early maturation on W4 depression through heightened W1 anxious arousal emerged (0.27, p = .04), although the 95% CI (–0.01, 0.77) suggested this effect only approached significance (Hypothesis 3a). For boys but not girls, increases in anxious arousal predicted W4 depression, a significant sex difference, Δχ2 (1) = 11.33, p < .001, resulting in the expected indirect effect of early maturation on W4 depression through increases in anxious arousal (0.48, p = .004, 95% CI = 0.16, 0.97; Hypothesis 3b).
Social–behavioral pathways
Social problems
Figure 4 presents standardized parameter estimates for the social problems model with depression centered at W1. To improve model fit, the residual variances of the social problems latent intercept and slope were allowed to covary (0.43, ns, and –.64, p < .001, for boys and girls, respectively). Early maturation predicted heightened social problems at the onset of the study for girls but not boys, a significant sex difference, Δχ2 (1) = 11.72, p < .001. In turn, W1 social problems predicted higher initial levels of depression for girls and boys. As expected, for girls, there was a significant indirect effect of early maturation on initial levels of depression through heightened W1 social problems (0.56, p < .001, 95% CI = 0.25, 0.97; Hypothesis 1).
Early maturation also predicted increases in social problems for boys and decreases in social problems for girls, a significant sex difference, Δχ2 (1) = 19.42, p < .001. In turn, increases in social problems predicted increases in depression for both boys and girls. As expected, for boys, early maturation was indirectly related to increases in depression through increases in social problems (0.18, p < .001, 95% CI = 0.04, 0.40; Hypothesis 2).
With the depression intercept recentered at W4, for girls but not boys, W1 social problems predicted W4 depression. Although the standardized coefficients for this path were quite different for girls and boys, a chi-square difference test of the sex difference for the raw coefficients was not significant, Δχ2 (1) = 2.63, ns. As expected, for girls, early maturation was indirectly related to W4 depression through heightened W1 social problems (0.54, p < .001, 95% CI = 0.04, 1.26; Hypothesis 3a). For boys and girls, increases in social problems predicted W4 depression. As expected, for boys, early maturation was indirectly related to W4 depression through increases in social problems (0.43, p = .01, 95% CI = 0.01, 0.97; Hypothesis 3b).
Engagement coping
Figure 5 presents standardized parameter estimates for the engagement coping model with depression centered at W1. To improve model fit, the residual variance of W1 engagement coping and W1 depression (–0.75, p = .005) and the residual variance of W2 depression and W3 depression (0.47, p < .001) were freely estimated for girls. Early maturation predicted dampened engagement coping at the onset of the study for girls but not boys; however, this sex difference was not significant, Δχ2 (1) = 1.55, ns. In turn, W1 engagement coping predicted lower initial levels of depression for girls and boys. As expected, for girls, there was a significant indirect effect of early maturation on initial levels of depression through dampened W1 engagement coping (0.25, p = .05, 95% CI = 0.01, 0.57; Hypothesis 1). Early maturation did not predict changes in engagement coping, and changes in engagement coping did not predict changes in depression. Therefore, no support was found for the hypothesis that early maturation was indirectly related to increases in depression through decreases in engagement coping for boys (Hypothesis 2).
With the depression intercept recentered at W4, the residual variances of the W2 and W3 depression variables were allowed to covary for girls (0.52, p < .001). For girls but not boys, less W1 engagement coping predicted W4 depression, although this sex difference was not significant, Δχ2 (1) = 0.52, ns. The expected significant indirect effect of early maturation on W4 depression through dampened W1 engagement coping emerged (0.27, p = .01, 95% CI = 0.05, 0.68; Hypothesis 3a). Early maturation did not predict changes in engagement coping for girls or boys. Therefore, no support was found for the hypothesis that early maturation was indirectly related to W4 depression through decreases in engagement coping for girls or boys (Hypothesis 3b).
Interpersonal pathways
Deviant peer affiliation
Figure 6 presents standardized parameter estimates for the deviant peer affiliation model with depression centered at W1. Early maturation predicted heightened deviant peer affiliation at the onset of the study, significantly for girls and marginally for boys; this sex difference was not significant, Δχ2 (1) = 3.36, ns. In turn, W1 deviant peer affiliation predicted higher initial levels of depression for girls but not boys, a significant sex difference, Δχ2 (1) = 5.64, p = .02. As expected, for girls there was a significant indirect effect of early maturation on initial levels of depression through heightened W1 deviant peer affiliation (0.38, p = .009, 95% CI = 0.31, 1.09; Hypothesis 1). Early maturation did not predict changes in deviant peer affiliation, and changes in deviant peer affiliation did not predict changes in depression. Therefore, no support was found for the hypothesis that early maturation was indirectly related to increases in depression through increases in deviant peer affiliation for boys (Hypothesis 2).
With the depression intercept recentered at W4, W1 deviant peer affiliation predicted W4 depression for girls and boys. As expected, for girls, early maturation was indirectly related to W4 depression through heightened W1 deviant peer affiliation (0.46, p = .02, 95% CI = 0.01, 2.45; Hypothesis 3a). Increases in deviant peer affiliation did not predict W4 depression for boys or girls. Therefore, no support was found for the hypothesis that early maturation was indirectly related to W4 depression through increases in deviant peer affiliation for girls or boys (Hypothesis 3b).
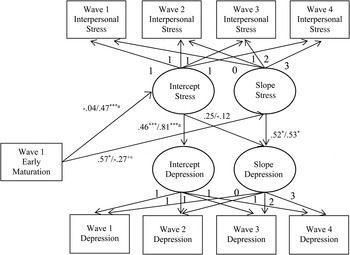
Interpersonal stress
Figure 7 presents standardized parameter estimates for the interpersonal stress model with depression centered at W1. To improve model fit, the residual variances of the interpersonal stress latent intercept and slope were allowed to covary (–0.72 and –0.71, ps < .001, for boys and girls, respectively), and, for girls, the residual variances of the W2 and W3 depression variables were allowed to covary (0.49, p < .001). Early maturation predicted heightened interpersonal stress at the onset of the study for girls but not for boys, a significant sex difference, Δχ2 (1) = 7.90, p = .005. In turn, W1 interpersonal stress predicted higher initial levels of depression for girls and boys, although this relation was stronger for girls than boys, Δχ2 (1) = 6.17, p = .01. As expected, for girls there was a significant indirect effect of early maturation on initial levels of depression through heightened W1 interpersonal stress (0.66, p < .001, 95% CI = 0.32, 1.19; Hypothesis 1).
Latent growth curve analysis of the contribution of early maturation to trajectories of depression through trajectories of interpersonal stress with the latent intercept of depression centered at Wave 1. Coefficients for boys are left of the slash, and coefficients for girls are right of the slash. aSignificant sex difference. *p < .05. **p < .01. ***p < .001.

For boys but not girls, early maturation predicted increases in interpersonal stress, a significant sex difference, Δχ2 (1) = 7.45, p = .006. In turn, increases in interpersonal stress predicted increases in depression for both girls and boys. As expected, for boys, early maturation was indirectly related to increases in depression through increases in interpersonal stress (0.16, p = .02, 95% CI = 0.04, 0.44; Hypothesis 2).
With the depression intercept recentered at W4, W1 interpersonal stress predicted W4 depression for girls and boys. As expected, for girls, early maturation was indirectly related to W4 depression through heightened W1 interpersonal stress (0.48, p = .003, 95% CI = 0.15, 1.08; Hypothesis 3a). For boys but not girls, increases in interpersonal stress predicted W4 depression, a significant sex difference, Δχ2 (1) = 3.86, p = .05, resulting in the expected significant indirect effect of early maturation on W4 depression through increases in interpersonal stress (0.42, p = .03, 95% CI = 0.05, 1.14; Hypothesis 3b).
Discussion
Developmental psychopathology models implicate the salient contribution of puberty, particularly off-time maturation, to increasing rates of adolescent depression and the sex difference therein (Ge & Natsuaki, Reference Ge and Natsuaki2009; Graber et al., Reference Graber, Brooks-Gunn and Warren2006; Mendle et al., Reference Mendle, Turkheimer and Emery2007; Rudolph, Reference Rudolph, Lewis and Rudolph2014). Using a multilevel approach to examining risk, Part 2 of this study identified psychological, social–behavioral, and interpersonal pathways accounting for the link between early maturation and depression in girls and boys over time.
Multilevel pathways of risk in girls
Although speculation about processes accounting for depression in early maturing girls has proliferated for decades, surprisingly few studies directly test these ideas, particularly using longitudinal designs. Using a rigorous, four-wave longitudinal design and within-subject analyses, Part 2 findings supported a proximal and enduring risk model of pubertal timing in girls: Early maturation was associated with proximal psychological (negative self-focus and anxious arousal), social–behavioral (social problems and dampened engagement coping), and interpersonal (deviant peer affiliation and interpersonal stress) risks. In turn, each of these risks predicted depression, resulting in significant indirect effects of early maturation on depression. Early maturation did not predict increasing risk over time, yet heightened proximal risk accounted for the contribution of early maturation to enduring depression. Thus, early maturing girls’ persistent vulnerability to depression was due to the damaging emotional consequences of proximal risk. The continuity in these effects over time suggests that even as peers catch up in their physical development, early maturing girls remain at a distinct disadvantage. Overall, these findings paint a picture in which early maturing girls show proximal risk for psychological, social–behavioral, and interpersonal difficulties, which predict stable high levels of depression.
Multilevel pathways of risk in boys
Perhaps because of inconsistent findings regarding risk for depression in boys with off-time development, few studies have explored explanations for heightened depression in early maturing boys (for an exception, see Mendle et al., Reference Mendle, Harden, Brooks-Gunn and Graber2012). Addressing this gap, Part 2 findings supported a progressive risk model of pubertal timing in boys: Early maturation predicted increasing psychological (negative self-focus and anxious arousal), social–behavioral (social problems), and interpersonal (interpersonal stress) risks. In turn, increasing levels of these risks predicted increasing depression over time and heightened depression by the end of the study, resulting in significant indirect effects of early maturation on depression. Contrary to hypotheses, early maturation did not predict increasing deviant peer affiliation in boys. However, analyses (not discussed earlier because they did not involve direct tests of hypotheses for boys) revealed that early maturation was marginally associated with proximal deviant peer affiliation, which significantly predicted increasing depression and depression at the end of the study, although the indirect effects of early maturation on increasing (0.06, p = .17, 95% CI = –0.13, 0.25) and final (0.22, p = .103, 95% CI = –0.024, 0.577) levels of depression through proximal deviant peer affiliation did not reach significance. It is interesting that deviant peer affiliation was the only proximal risk predicted by early maturation in boys; in fact, early maturation was negatively, albeit nonsignificantly, associated with several other risks at the study onset. It may be that early deviant peer affiliation initially is not detrimental for early maturing boys but helps to explain emerging risks (e.g., social problems, interpersonal stress; Fergusson et al., Reference Fergusson, Wanner, Vitaro, Horwood and Swain-Campbell2003) over time, resulting in progressively more depression. However, our measure of deviant peer affiliation was based on a single item; research using a more robust measure is needed to determine its precise role in early maturing boys’ risk for depression. Overall, these findings paint a picture in which early maturing boys show an emerging risk for psychological, social–behavioral, and interpersonal difficulties, which predict increasing depression across adolescence.
Integrative Conclusion
Part 1 of this study documented differing temporal patterns of puberty-related risk in girls and boys. Part 2 provided robust support for process-oriented models, which consider multiple levels of risk linking early maturation with depression (Ge & Natsuaki, Reference Ge and Natsuaki2009; Graber et al., Reference Graber, Brooks-Gunn and Warren2006; Rudolph, Reference Rudolph, Lewis and Rudolph2014). These findings present an integrated picture of how early maturation contributes to proximal and enduring risk for depression in girls and to progressive risk for depression in boys across adolescence.
Summary and implications
In girls, early maturation seems to trigger an immediate set of personal and contextual risks and consequent depression. Girls who mature earlier than their peers stand out at a time when fitting in is of the utmost importance, thereby threatening their sensitivity to social scrutiny. They also may experience insecurity and ambivalence about entering a new life stage, making them vulnerable to arousal and anxiety. Insufficient developmental preparation or external support for managing these challenges may hinder early maturing girls’ efforts to deal effectively with the implications of their changing physical and social status. When girls’ psychological resources are taxed, they may disengage from the peer group and find it difficult to generate effective strategies for coping with stress. Along with their tendency to affiliate with deviant peers, pubertal changes cause early maturing girls to enter riskier and more stressful social contexts and to experience disruption and conflict within their relationships. These psychological, social–behavioral, and interpersonal risks predict not only heightened depression proximal to pubertal changes but also enduring depression several years later.
In boys, early maturation did not have immediate adverse effects. Early maturing boys showed significantly lower initial levels of depression than did their female counterparts, whereas late-maturing boys showed significantly higher initial levels of depression than did their female counterparts. However, these differences dissipated by the end of the study: Early maturing girls and boys showed similar high levels of depression, whereas late-maturing girls and boys showed similar low levels of depression. These increasing levels of depression in early maturing boys were accounted for by their increasing susceptibility to a negative self-image, anxiety, social problems, and interpersonal stress over time. This pattern suggests that early maturing boys initially may be protected from the challenges of puberty, as traditionally believed, but experience an emerging cascade of personal and contextual risks as they move through adolescence, eventuating in depression.
Future directions
Puberty-related risk in both girls and boys occurred at multiple levels of development, from internal psychological experiences through broad contextual influences, highlighting the value of multilevel conceptualizations of vulnerability to psychopathology (Cicchetti, Reference Cicchetti, Beauchaine and Hinshaw2008, Reference Cicchetti2013; Cicchetti & Curtis, Reference Cicchetti and Curtis2007; Cicchetti & Dawson, Reference Cicchetti and Dawson2002; Cicchetti & Valentino, Reference Cicchetti, Valentino and Masten2007). Although this study examined independent pathways of risk, it is likely that these multiple levels of risk are mutually reinforcing over time. For instance, early maturation may foster a negative self-focus that causes youth to engage in maladaptive social behaviors, which then elicit adverse social responses through a process of stress-generation (Rudolph, Reference Rudolph, Nolen-Hoeksema and Hilt2009). Withdrawal from mainstream peers may leave early maturing youth with limited social options, causing them to affiliate with deviant peers and thus creating interpersonal stressors that heighten their negative self-views and undermine their coping. Future investigations will therefore need to track reciprocal influences among puberty-linked personal and contextual risks across the adolescent years.
Although this study represents one of the few to track the effect of early maturation on within-individual changes in depression, and one of the first to identify processes accounting for risk across multiple years (for an exception, see Mendle et al., Reference Mendle, Harden, Brooks-Gunn and Graber2012), this time frame still covers a relatively brief stage of adolescence. It remains to be seen whether the adverse effects documented here linger through development. Evidence regarding the long-term effects of early maturation on depression is mixed, with some research suggesting increasing adverse effects through early to midadolescence with slight declines through adolescence (De Rose et al., Reference DeRose, Shiyko, Foster and Brooks-Gunn2011) and early adulthood (Natsuaki et al., Reference Natsuaki, Biehl and Ge2009), other research documenting effects through adulthood (based on a measure of perceived timing; Graber, Seeley, Brooks-Gunn, & Lewinsohn, Reference Graber, Seeley, Brooks-Gunn and Lewinsohn2004), and yet other research revealing no long-term effects (Foster, Hagan, & Brooks-Gunn, Reference Foster, Hagan and Brooks-Gunn2008). Given this lack of clarity, future research needs to document patterns of risk and psychopathology across developmental stages.
Another critical direction for future inquiry is to track puberty-related risk at the biological level. In particular, it would be helpful to clarify the extent to which the biological changes of adolescence (e.g., heightened hormonal and neural sensitivity to emotions and social stress) contribute to the observed psychological, social–behavioral, and interpersonal risks. On one hand, these changes occur with advancing puberty for all youth, and it is unclear why adverse effects would be particularly salient for youth who mature early relative to their peers. On the other hand, the hormonal profiles of early maturing youth may differ from their on-time and late-maturing counterparts, or the brain may be more sensitive to the effects of hormonal changes at earlier stages of development (Harden & Mendle, Reference Harden and Mendle2012; Mendle & Ferrero, Reference Mendle and Ferrero2012; Rudolph, Reference Rudolph, Lewis and Rudolph2014; Susman & Dorn, Reference Susman, Dorn, Lerner and Steinberg2009), resulting in heightened reactivity in early maturing youth. It also is possible that normative biological sensitivity is amplified by the psychological and contextual challenges faced by early maturing youth, causing them to become particularly reactive. These unexplored issues point to intriguing possibilities for research.
Finally, this study focused on a single, static index of puberty: timing at the study onset. Although there are robust effects of multiple indexes of puberty on depression, there is some inconsistency in the findings across these indexes, perhaps explaining some of the discrepancies in the field (Rudolph, Reference Rudolph, Lewis and Rudolph2014). In particular, recent efforts focus on understanding not only the timing but also the tempo (rate of maturation) of puberty and its effects (Marceau, Ram, Houts, Grimm, & Susman, Reference Marceau, Ram, Houts, Grimm and Susman2011; Mendle et al., Reference Mendle, Harden, Brooks-Gunn and Graber2010). Understanding whether the timing and tempo of puberty exert their effects on psychopathology through similar or different pathways will help to elucidate the long-term consequences of puberty in girls and boys.
Implications for multilevel interventions
This research offers promising leads for efforts aimed at reversing the rising rate of depression across adolescence, suggesting that interventions should be developed and implemented at multiple levels of youth functioning and providing insight into specific targets of intervention for early maturing youth. Individual-level interventions can be directed toward discouraging negative social comparisons, teaching adaptive social behaviors and strategies for coping with interpersonal stress, and encouraging immersion in mainstream peer groups. Family-level interventions can be directed toward helping parents understand and anticipate the specific challenges faced by early maturing youth, easing family stress, and encouraging parents to carefully monitor youths’ peer groups to avoid risky affiliations. Peer group and school-wide interventions can be directed toward teaching tolerance of maturational differences combined with efforts to prevent potential harassment and victimization directed toward early maturing youth. Although much attention is directed toward understanding and preventing adolescent depression in girls, the present findings highlight the need to consider early maturing boys as an at-risk group as well, even if they do not show early signs of depression. Interventions need to focus the attention of youth, peers, and families away from the challenges and stress, and toward the growth and opportunities, of advancing puberty.