1 Introduction
When helicopters hover near the ground, the wake produced by the rotor interacts with the soil and may lift up sand grains, dust or dirt. The sediments entrained by the flow can form a cloud around the helicopter, which blinds the pilot. Such degraded visibility can lead to spatial disorientation and crashes. Previous literature (Colby Reference Colby2005; Phillips & Brown Reference Phillips and Brown2009) defines this condition as ‘brownout’ – or ‘whiteout’ if it occurs on snowy grounds. To mitigate the impact of brownout during landing or take-off, a clear understanding of particle resuspension and entrainment mechanisms is required. Detailed investigation of these mechanisms is the main objective of the present study. In particular, we focus on the role of the rotor-generated flow structures in the formation of the fully resuspended particle cloud.
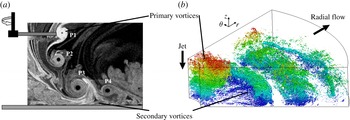
(a) Visualization of the wake of a rotor in ground effect. Figure courtesy of Lee, Leishman & Ramasamy (Reference Lee, Leishman and Ramasamy2010) figure 6(f), reproduced with permission. (b) Instantaneous flow structures in an excited, round impinging jet with embedded azimuthal vortices. Isosurfaces of the second invariant of the velocity-gradient tensor are coloured according to their distance from the bottom surface.

1.1 Phenomenology of rotor wake flow
Particle suspension during brownout is driven by the flow produced by the spinning blades of the rotor. The complexity of this flow can be appreciated even in the simplest case of a single-bladed rotor, visualized in figure 1(a): helical vortices, visualized by smoke swirl (light grey) around the vortex core (dark), are formed at the tip of the blades and advected towards the ground by the rotor downwash (Leishman Reference Leishman2000; Lee et al. Reference Lee, Leishman and Ramasamy2010). Previous investigations (Özdemir & Whitelaw Reference Özdemir and Whitelaw1992; Mladin & Zumbrunnen Reference Mladin and Zumbrunnen2000; Hwang & Cho Reference Hwang and Cho2003; Geiser & Kiger Reference Geiser and Kiger2011; Wu & Piomelli Reference Wu and Piomelli2015) have shown that the rotor wake can be modelled as a forced free jet impinging on a solid wall, and that helical vortices can be represented as vortex rings generated by Kelvin–Helmholtz (KH) instability in the shear layer near the nozzle outlet if the ratio of the helix radius to pitch is large (as in the case of a helicopter). The primary KH instability is artificially amplified by pulsing the jet (Sato Reference Sato1960; Huang & Hsiao Reference Huang and Hsiao1999), leading to the formation of stronger and more coherent azimuthal vortex rings that mimic the rotor-tip vortices (e.g. vortex P1 in figure 1 a). The resulting flow is highly turbulent and provides a unique combination of turbulent structures and characteristic scales with which the particles can interact. With reference to figure 1(a), the impinging flow with a portion of the vortex ring, referred to as the ‘primary vortex’ hereinafter, can be observed near the rotor tip. This large-scale counter-clockwise vortex travels towards the bottom surface and is surrounded by the small eddies of the jet turbulence (e.g. vortex P2 in figure 1 a). As the primary vortex approaches the surface, a region of negative secondary vorticity is generated at the surface and then lifted up, causing flow separation (occurring downstream of vortex P3 in figure 1 a). Downstream of the jet impingement region, the primary and secondary vortices interact forming a wall jet that travels along the radial direction and gradually loses coherence (vortex P4 in figure 1 a).
A perspective view of the flow dynamics just described is provided in figure 1(b), taken from Wu & Piomelli (Reference Wu and Piomelli2015). The turbulent structures are visualized by the second invariant of the velocity-gradient tensor,
 $Q=(\unicode[STIX]{x1D6FA}_{ij}\unicode[STIX]{x1D6FA}_{ij}-\unicode[STIX]{x1D61A}_{ij}\unicode[STIX]{x1D61A}_{ij})/2$
, where
 $\unicode[STIX]{x1D6FA}_{ij}$
is the antisymmetric rate-of-rotation tensor and
 $\unicode[STIX]{x1D61A}_{ij}$
is the symmetric rate-of-strain tensor (Dubrief & Delcayre Reference Dubrief and Delcayre2000). Four consecutive primary vortices, surrounded by bundles of smaller structures can be observed. These structures start as small-scale near-wall vortices generated by the rolling up of the jet turbulence around the primary vortex in the impingement region, and are then amplified during the primary–secondary vorticity interaction. As the primary vortex moves radially, the small-scale vortices detach from the surface and roll around the primary vortex core, forming the rib-like structures visible in figure 1(b). Far downstream of the wall-jet region, however, these structures undergo a rapid decay and break into smaller and smaller segments. Wu & Piomelli (Reference Wu and Piomelli2015) observed that the distribution of rib-like structures around the primary vortex in the azimuthal direction is non-uniform and connected to a three-dimensional instability developed by the primary vortex. The role of these vortical structures on particle entrainment and dispersion was observed in confined round free jets by Sbrizzai, Verzicco & Soldati (Reference Sbrizzai, Verzicco and Soldati2009). In free jets, the ribs are couples of counter-rotating streamwise vortices that form (with well-defined azimuthal periodicity) where the vortex ring is intro-flected towards the jet core, and connect subsequent vortex rings. Particles are mainly transported by the large-scale vortices in such flow, but rib-like vortices cause small-scale clustering and control dispersion toward the periphery of the jet.
Even though there are different macroscopic flow features between free jets and forced jets, the findings of Sbrizzai et al. (Reference Sbrizzai, Verzicco and Soldati2009) suggest that the formation, mutual interaction and decay of the vortices in the impinging jet system, as the crucial features of the flow evolution (Olsson & Fuchs Reference Olsson and Fuchs1998; Dairay et al. Reference Dairay, Fortune, Lamballais and Brizzi2015; Wu & Piomelli Reference Wu and Piomelli2015), could play a key role in the brownout cloud formation. To the best of our knowledge, no detailed investigation on the mechanisms leading to the onset and spreading of the cloud is available yet. The aim of the present work is to examine these mechanisms, focusing in particular on the local interaction between the re-entrained particles and the flow structures in the wall-jet region.
1.2 Particle resuspension from solid boundaries
Particle resuspension from a solid surface is a multi-step process. First, particles detach from the surface by breaking the particle–surface contacts: this step is governed by complex particle–surface interactions that have been widely examined to understand the specific role of interface chemistry, surface morphology and material properties (Friess & Yadigaroglu Reference Friess and Yadigaroglu2002; Ziskind Reference Ziskind2006; Goldasteh, Ahmadi & Ferro Reference Goldasteh, Ahmadi and Ferro2013; Henry & Minier Reference Henry and Minier2014). Second, particles are removed from the surface into a region of strong particle–particle interactions (Munro, Bethke & Dalziel Reference Munro, Bethke and Dalziel2009; Bethke & Dalziel Reference Bethke and Dalziel2012; Barth, Lecrivain & Hampel Reference Barth, Lecrivain and Hampel2013; Matsusaka Reference Matsusaka2015). Finally, particles are further lifted off and entrained in regions of the flow dominated by particle–fluid interactions: it is precisely on this step that we focus our analysis. Considering that there is an abundance of particles that are lifted off by the rotor flow (steps one and two), we can try to understand the role of the rotor flow in lifting many of these particles up to the height of the pilot visual.
Previous channel flow experiments (Kaftori, Hetsroni & Banerjee Reference Kaftori, Hetsroni and Banerjee1995a ,Reference Kaftori, Hetsroni and Banerjee b ; Niño & Garcia Reference Niño and Garcia1996) and direct numerical simulations (Niño & Garcia Reference Niño and Garcia1996; Marchioli & Soldati Reference Marchioli and Soldati2002) have shown that particles can be efficiently entrained into suspension via coherent ejections of low-momentum fluid. Through this process, and regardless of the specific detachment/surface removal mechanism, a significant number of particles can be brought far enough from the bottom surface to interact with the fluid in dilute flow conditions. This is what we expect to find in the outer region of the rotor wake flow, even if the near-wall structures in a turbulent channel are topologically different from the large-scale vortices shown in figure 1(b), and the resulting particle–turbulence interactions may lead to quantitatively different resuspension dynamics.
Large-scale vortices are usually absent in most of the fully turbulent vertical jets investigated in archival literature to study the transport and erosion of a sediment bedload (see Badr, Gauthier & Gondret (Reference Badr, Gauthier and Gondret2014), Sutherland & Dalziel (Reference Sutherland and Dalziel2014) among others) or the removal of small particles from surfaces (Liu, Hirama & Matsusaka Reference Liu, Hirama and Matsusaka2012): the mean flow produced by these jets is similar to the rotor wake, but the vortical structures are different. On the other hand, the effect of large-scale vortices on particle resuspension (Munro et al. Reference Munro, Bethke and Dalziel2009; Bethke & Dalziel Reference Bethke and Dalziel2012) has been examined only for idealized configurations in which vortex rings are issued from orifices or tubes in an otherwise quiescent fluid, and impact downward on the sediment bed. In addition, the focus was on resuspension and erosion of multi-layer deposits with a porous structure, which are characterized by interaction dynamics at the particle layer different from that targeted here. Nevertheless, it is interesting to note that bed deformation is associated with deceleration and stretching of the vortex rings and with the formation of secondary vortices, which trigger particle resuspension upon separation from the bed as reported in the experimental studies of Kiger and co-workers (Mulinti & Kiger Reference Mulinti and Kiger2012; Kiger, Corfman & Mulinti Reference Kiger, Corfman and Mulinti2014) and Leishman and co-workers (Johnson, Leishman & Sydney Reference Johnson, Leishman and Sydney2010; Lee et al. Reference Lee, Leishman and Ramasamy2010). These authors examined the time evolution of bed erosion and the suspended flux of particles induced by the action of a forced impinging jet of air. In particular, the authors pointed out the importance of the secondary vorticity region in enhancing particle suspension and deposition downstream of the impingement point. Flow visualizations also revealed rapid erosion of sediments and significant changes of bed topography, with possible onset of inter-phase coupling effects (Kiger et al. Reference Kiger, Corfman and Mulinti2014). Unfortunately, these authors did not examine the interaction between the vortices and the particles at the particle scale, due to the inherent limitations in the spatial and temporal resolution of the measurements.
1.3 Particle transport in impinging jets: open modelling issues
A strong motivation for the present study comes from the modelling of particle re-entrainment and long-term resuspension by impinging jets upon detachment from the bottom surface. Most of the models currently used at the industrial level assume that particle concentration distribution is determined mainly by the balance between diffusion and particle settling (quasi-equilibrium condition) to calculate the suspended and bed loads (Mihailovic & Gualtieri Reference Mihailovic and Gualtieri2010). However, such a zeroth-order assumption would clearly be inaccurate if applied to the highly intermittent and transient flows in the rotor wake. Additional modelling issues are related to the use of inviscid models and turbulence models for the Reynolds-averaged Navier–Stokes (RANS) equations that have been used to simulate the brownout (Ghosh Reference Ghosh2010; Jasion & Shrimpton Reference Jasion and Shrimpton2012; Thomas Reference Thomas2013). These models can provide a macroscopic description of the fluid/particle fields, but cannot explain the underlying physics (Wu & Piomelli Reference Wu and Piomelli2015). Eddy-resolving methods such as large-eddy simulation (LES) appear to be the natural choice, in view of their capability to capture the dynamics of all relevant turbulent structures and flow instabilities, and to provide multi-point, non-intrusive measurements of observables that are difficult to measure (e.g. velocity gradients along the particle trajectory). In the present study, we thus build on the single-phase investigations of Wu & Piomelli (Reference Wu and Piomelli2015, Reference Wu and Piomelli2016) to examine the dispersion of small, heavy particles produced by a vertical jet impinging on a surface covered with a single layer of loose micro-particles. Lagrangian tracking of particle is coupled with Eulerian simulation of the flow field, with interests put on the physical mechanisms by which the jet vortices induce resuspension. We underline here that the focus of our study is to investigate the mechanism that leads already detached particles to form a cloud at large distances from the surface. This analysis is based on the assumption that, during the entire re-entrainment process, only particle–fluid interactions are important and the particle concentration is dilute: in this case, our methodology is fully consistent to approach the problem. More sophisticated physico-chemical models would be required to account for particle detachment. However, it has been shown that detachment is determined by particle–surface interactions that become significant, and comparable to particle–fluid interactions, only for separation distances much smaller than the particle size – of the order of a few tens of nanometres or less (Henry & Minier Reference Henry and Minier2014). Because the resuspension mechanism we examine depends on interactions at the particle scale (of the order of tens of micrometres or higher), explicit inclusion of particle–surface interaction models is beyond the scope of the present simulations.
In the following, we first review the numerical methodology (§ 2), and then discuss particle preferential distribution, both in the radial–vertical plane and in the azimuthal direction (§ 3), as well as particle transport flux (§ 4); we discuss the initial lift off of the particles from the surface by the vortical flow structures in the wall-jet region and subsequent particle entrainment into the outer flow (§§ 5.1 and 5.2, respectively), also evaluating possible particle size effects (§ 5.3). Finally we draw the main conclusions and make recommendations for future work (§ 6).
2 Problem formulation and numerical methodology
2.1 Flow configuration
The flow field used for particle tracking is the periodically forced, round impinging jet simulated by Wu & Piomelli (Reference Wu and Piomelli2015, Reference Wu and Piomelli2016). The reader is referred to those papers for a complete description of the configuration and methodology. Here, we will recall just the main details to make the paper self-contained. The flow Reynolds number, based on the mean exit velocity
 $U_{o}$
and the exit diameter
 $D$
of the nozzle, is
 $Re_{D}\approx 66\,700$
(see table 1). The values of
 $U_{o}$
and
 $D$
match those considered in the experiments of Geiser & Kiger (Reference Geiser and Kiger2011), and are used here to make variables non-dimensional. The simulation domain size is
 $[0.25D,3.75D]\times [0,D]\times [0,\unicode[STIX]{x03C0}/3]$
in the radial (
 $r$
), wall-normal (
 $z$
) and azimuthal (
 $\unicode[STIX]{x1D703}$
) directions, respectively. The domain does not extend to the symmetry axis to avoid the singularity at
 $r=0$
(Mohseni & Colonius Reference Mohseni and Colonius2000; Constantinescu & Lele Reference Constantinescu and Lele2002), to decrease the number of grid points required, and to avoid the small time steps required by the Courant–Friedrichs–Lewy condition in regions where the azimuthal spacing,
 $r\unicode[STIX]{x0394}\unicode[STIX]{x1D703}$
, is small. Wu & Piomelli (Reference Wu and Piomelli2015) have shown that this choice does not affect the results in the wall-jet region. They have also shown that the domain size in the
 $\unicode[STIX]{x1D703}$
direction is sufficient to capture the largest azimuthal length scale. The computational grid (for which grid-converged results are obtained) is made of
 $768\times 500\times 256$
nodes, equi-spaced in
 $r$
and
 $\unicode[STIX]{x1D703}$
but stretched in the wall-normal direction based on a hyperbolic tangent function with maximum stretching ratio below 1 %.
Flow parameters.

2.2 Fluid governing equations and flow solver
The fluid phase is governed by the filtered Navier–Stokes equations (Leonard Reference Leonard1975)
 $$\begin{eqnarray}\displaystyle & \unicode[STIX]{x1D735}\boldsymbol{\cdot }\overline{\boldsymbol{u}}=0, & \displaystyle\end{eqnarray}$$
 $$\begin{eqnarray}\displaystyle & \displaystyle \frac{\unicode[STIX]{x2202}\overline{\boldsymbol{u}}}{\unicode[STIX]{x2202}t}+\unicode[STIX]{x1D735}\boldsymbol{\cdot }\overline{\boldsymbol{u}}\;\overline{\boldsymbol{u}}=-\unicode[STIX]{x1D735}\overline{P}-\unicode[STIX]{x1D735}\boldsymbol{\cdot }\unicode[STIX]{x1D749}+\unicode[STIX]{x1D708}_{f}\unicode[STIX]{x1D6FB}^{2}\overline{\boldsymbol{u}}, & \displaystyle\end{eqnarray}$$
where the
 $\overline{(.)}$
operator represents the spatial filtering,
 $\boldsymbol{u}$
is the fluid velocity,
 $t$
is time,
 $P=p/\unicode[STIX]{x1D70C}_{f}$
is the modified pressure,
 $\unicode[STIX]{x1D70C}_{f}$
the fluid density, and
 $\unicode[STIX]{x1D708}_{f}$
the fluid kinematic viscosity (see table 1). The subgrid-scale (SGS) stresses
 $\unicode[STIX]{x1D70F}_{ij}=\overline{u_{i}u_{j}}-\overline{u}_{i}\overline{u}_{j}$
are modelled using the Lagrangian-averaged dynamic eddy-viscosity model (Germano et al.
Reference Germano, Piomelli, Moin and William1991; Meneveau, Lund & Cabot Reference Meneveau, Lund and Cabot1996), due to its capability to capture the spatial flow heterogeneity by following the fluid elements along their paths. Because of the one-way coupling assumption made (details given in the next subsection), particles have no effect on the fluid motion and therefore no source term is considered in (2.2). This assumption is justified here by the low particle mass and volume fraction. Simulations were performed using a well-validated code (Keating et al.
Reference Keating, Piomelli, Bremhorst and Nešić2004) that solves (2.1) and (2.2) on a staggered grid using second-order accurate central finite differences scheme for all the spatial terms. A second-order accurate semi-implicit time advancement method is employed. The velocity at the jet exit was assumed to be sinusoidal, of the form
 $U_{jet}/U_{o}=1+A_{f}\sin (2\unicode[STIX]{x03C0}t_{T})$
, where
 $A_{f}=0.4$
is the amplitude of the forcing and
 $t_{T}$
is the time normalized by the forcing period. Such expression gives the best matching with experiments in terms of wall-jet flow structures (Geiser & Kiger Reference Geiser and Kiger2011; Wu & Piomelli Reference Wu and Piomelli2015). The non-dimensional forcing period is
 $T=1.3334$
, and corresponds to a jet forcing frequency of 75 Hz, as in the experiment of Geiser & Kiger (Reference Geiser and Kiger2011). Time-dependent mean-flow profiles imposed at the top and inflow boundaries were obtained by auxiliary, a priori unsteady Reynolds-averaged Navier–Stokes (URANS) computations performed using Fluent®. Synthetic turbulent fluctuations were superposed to the URANS solution (Klein, Sadiki & Janicka Reference Klein, Sadiki and Janicka2003) to simulate a turbulent jet. Periodic boundary conditions are enforced along the azimuthal direction, while the no-slip boundary condition is used at the bottom surface. A modified convective boundary condition (Orlanski Reference Orlanski1976; Wu & Piomelli Reference Wu and Piomelli2015) is applied at the outflow of the domain. Validation of the boundary conditions is discussed in Wu & Piomelli (Reference Wu and Piomelli2015).
Since the jet is periodically forced the total velocity at the nozzle exit,
 $u_{tot}$
, can be decomposed into a mean component,
 $\overline{U}$
, a periodic fluctuating component,
 $\widetilde{u}$
, and a stochastic fluctuating component,
 $u^{\prime }$
(Hussain & Reynolds Reference Hussain and Reynolds1970):
 $$\begin{eqnarray}u_{tot}=\overline{U}+\widetilde{u}+u^{\prime },\end{eqnarray}$$
with
 $\langle u\rangle =\overline{U}+\widetilde{u}$
the phase-averaged velocity (e.g.
 $\langle U_{jet}\rangle$
obtained by URANS). For a periodic field, the phase-averaged quantities are defined as:
 $$\begin{eqnarray}\langle f(\boldsymbol{x},\unicode[STIX]{x1D719})\rangle =\frac{1}{N}\mathop{\sum }_{n=1}^{N}f(\boldsymbol{x},(n+\unicode[STIX]{x1D719})T),\end{eqnarray}$$
where
 $\unicode[STIX]{x1D719}=\text{mod}(t,T)/T$
represents the temporal phase and
 $N$
is the total number of flow realizations used for averaging. In the following, we will show and discuss results at eight equally spaced phases of the forcing period, denoted as
 $\unicode[STIX]{x1D719}=i/8$
(
 $i=0,1,\ldots ,7$
).
2.3 Particle motion equations and Lagrangian tracking
Particle tracking simulations aim to reproduce the physical situation of small sand grains or dust dragged by the impinging jet. The flow is dilute due to the low particle volume fraction (
 $\unicode[STIX]{x1D6F7}_{V}<10^{-4}$
on average), so two-way momentum coupling and particle–particle collisions can be neglected (Balachandar & Eaton Reference Balachandar and Eaton2010). Particles are modelled as rigid, pointwise spheres, and their dynamics is governed by the following set of equations (in vector form):
 $$\begin{eqnarray}\frac{\text{d}\boldsymbol{x}_{p}}{\text{d}t}=\boldsymbol{v}_{p},\quad \frac{\text{d}\boldsymbol{v}_{p}}{\text{d}t}=\boldsymbol{f},\end{eqnarray}$$
where
 $\boldsymbol{x}_{p}$
is the particle position,
 $\boldsymbol{v}_{p}$
is the particle velocity and
 $\boldsymbol{f}$
is the total force per unit mass exerted by the fluid (air) on the particles. In our simulations,
 $\boldsymbol{f}=\boldsymbol{f}_{D}+\boldsymbol{f}_{G}+\boldsymbol{f}_{B}+\boldsymbol{f}_{S}$
where
 $\boldsymbol{f}_{D}$
,
 $\boldsymbol{f}_{G}$
,
 $\boldsymbol{f}_{B}$
and
 $\boldsymbol{f}_{S}$
represent drag, gravity, buoyancy and Saffman lift, respectively. Other unsteady forces (e.g. added mass, Basset and pressure gradient) have been neglected due to the very small fluid-to-particle density ratio (Crowe, Sommerfeld & Tsuji Reference Crowe, Sommerfeld and Tsuji1998). The lift force term is written as (Saffman Reference Saffman1965):
 $$\begin{eqnarray}\boldsymbol{f}_{S}=-\unicode[STIX]{x1D709}\frac{9.66}{\unicode[STIX]{x03C0}}\frac{\unicode[STIX]{x1D70C}_{f}}{\unicode[STIX]{x1D70C}_{p}}\frac{\sqrt{\unicode[STIX]{x1D708}_{f}}}{d_{p}}\frac{(\overline{\boldsymbol{u}}-\boldsymbol{v}_{p})\times (\unicode[STIX]{x1D735}\times \overline{\boldsymbol{u}})}{\sqrt{\Vert \unicode[STIX]{x1D735}\times \overline{\boldsymbol{u}}\Vert }},\end{eqnarray}$$
where
 $\unicode[STIX]{x1D70C}_{p}$
is the particle density,
 $d_{p}$
is the particle diameter and
 $\unicode[STIX]{x1D709}$
is an additional correction factor (always positive) that becomes important when the relative velocity between the particle and the gas is large (McLaughlin Reference McLaughlin1991). Wall effects are not taken into account in (2.6). Thus, the actual influence of the lift force on particle behaviour might be slightly overestimated. Even if drag and gravity are the most effective forces in determining particle dynamics when
 $\unicode[STIX]{x1D70C}_{p}\gg \unicode[STIX]{x1D70C}_{f}$
, the lift due to velocity gradients (especially the radial velocity gradient in the wall-normal direction) becomes non-negligible near the impingement surface.
Indicating with
 $\overline{\boldsymbol{u}}_{@p}$
the filtered fluid velocity at the particle position, the complete set of scalar equations for the particle motion is (Cerbelli, Giusti & Soldati Reference Cerbelli, Giusti and Soldati2001):
 $$\begin{eqnarray}\displaystyle \left.\begin{array}{@{}c@{}}{\displaystyle \frac{\text{d}\unicode[STIX]{x1D703}_{p}}{\text{d}t}}={\displaystyle \frac{v_{p,\unicode[STIX]{x1D703}}}{r}},\\ {\displaystyle \frac{\text{d}r_{p}}{\text{d}t}}=v_{p,r},\\ {\displaystyle \frac{\text{d}z_{p}}{\text{d}t}}=v_{p,z},\\ {\displaystyle \frac{\text{d}v_{p,\unicode[STIX]{x1D703}}}{\text{d}t}}={\displaystyle \frac{C_{D}}{\unicode[STIX]{x1D70F}_{p}}}(\overline{u}_{@p,\unicode[STIX]{x1D703}}-v_{p,\unicode[STIX]{x1D703}})-{\displaystyle \frac{v_{p,\unicode[STIX]{x1D703}}v_{p,r}}{r}}+f_{S,\unicode[STIX]{x1D703}},\\ {\displaystyle \frac{\text{d}v_{p,r}}{\text{d}t}}={\displaystyle \frac{C_{D}}{\unicode[STIX]{x1D70F}_{p}}}(\overline{u}_{@p,r}-v_{p,r})+{\displaystyle \frac{v_{p,\unicode[STIX]{x1D703}}^{2}}{r}}+f_{S,r},\\ {\displaystyle \frac{\text{d}v_{p,z}}{\text{d}t}}={\displaystyle \frac{C_{D}}{\unicode[STIX]{x1D70F}_{p}}}(\overline{u}_{@p,z}-v_{p,z})+\left(1-{\displaystyle \frac{\unicode[STIX]{x1D70C}_{f}}{\unicode[STIX]{x1D70C}_{p}}}\right)g+f_{S,z},\end{array}\right\} & & \displaystyle\end{eqnarray}$$
where
 $C_{D}=24/Re_{p}$
is the drag coefficient,
 $Re_{p}=\Vert \overline{\boldsymbol{u}}_{f}-\boldsymbol{v}_{p}\Vert d_{p}/\unicode[STIX]{x1D708}_{f}$
is the particle Reynolds number,
 $\unicode[STIX]{x1D70F}_{p}=\unicode[STIX]{x1D70C}_{p}d_{p}^{2}/(18\unicode[STIX]{x1D70C}_{f}\unicode[STIX]{x1D708}_{f})$
the particle relaxation time,
 $\overline{u}_{@p,i}$
the fluid velocity components at the particle position,
 $f_{S,i}$
the components of the Saffman lift force (Saffman Reference Saffman1965) (not written explicitly for ease of notation) and
 $g$
the gravitational acceleration. Details of the derivatives in cylindrical coordinates are given in the Appendix. When
 $Re_{p}$
becomes larger than unity, the nonlinear correction of Schiller & Naumann (Reference Schiller and Naumann1935) is used to compute
 $C_{D}$
:
 $$\begin{eqnarray}C_{D}=\frac{24}{Re_{p}}(1+0.15Re_{p}^{0.687}).\end{eqnarray}$$
Recently Bergougnoux et al. (Reference Bergougnoux, Bouchet, Lopez and Guazzelli2014) have demonstrated that this model is necessary to avoid overestimating inertial effects compared to viscous effects.
Note that the filtered fluid velocity is used in (2.7), with no model for the small (unresolved) subgrid flow scales. Previous studies (Kuerten Reference Kuerten2006; Marchioli, Salvetti & Soldati Reference Marchioli, Salvetti and Soldati2008) have shown that filtering effects in bounded turbulence are only important near the wall. Away from this region, LES can still yield accurate predictions of preferential concentration provided that the computational grid is well resolved. In our study, the grid resolution is such that the subgrid-scale turbulent kinetic energy is a small fraction of the total (i.e. resolved plus subgrid scale), and two-point correlations, a robust measure for estimating LES resolution (Davidson Reference Davidson2009), are well predicted. From a physical viewpoint, filtering is deemed to play a minor role because particle initial entrainment and subsequent resuspension are driven by the large-scale primary and secondary vortices in the wall-jet region (as discussed in the following sections).
The set of (2.7), made dimensionless using
 $D$
and
 $U_{o}$
, was integrated in time using a fourth-order explicit Runge–Kutta method. The fluid velocity at the particle position was obtained by trilinear interpolation of the Eulerian fluid velocity provided by LES. Simulation parameters for the particles correspond to realistic instances of helicopter brownout and are listed in table 2. In particular, the diameters selected to investigate particle size effects match the typical range in which sediments undergo long-term suspension and may generate the brownout cloud (Syal, Govindarajan & Leishman Reference Syal, Govindarajan and Leishman2010), and are representative of laboratory experiments such as those by Geiser & Kiger (Reference Geiser and Kiger2011). The corresponding rotor-to-particle diameter ratio is
 $O(10^{4})$
, much smaller than in real situations (in which the ratio is
 $O(10^{6})$
). The particle characteristic time scale,
 $\unicode[STIX]{x1D70F}_{p}$
, settling velocity,
 $u_{settl}$
, and critical value of the Shields parameter,
 $\unicode[STIX]{x1D703}_{c}$
, (defined in § 4) are also listed in table 2. The time step used to integrate (2.7) is
 $\text{d}t=\unicode[STIX]{x1D70F}_{p}/10$
, sufficient to ensure numerical convergence and accurate calculation of the Lagrangian trajectories. The Lagrangian tracking was performed considering statistically steady flow fields over a total of 54 forcing periods: 30 forcing periods were required to develop the particle field from its initial distribution (random distribution on a horizontal plane located at a distance of 0.85
 $d_{p}$
from the bottom surface) to the statistically steady state; an additional 24 periods were considered to collect the statistics for both phases. Particle statistics were computed considering an ensemble of 50 000 particles. We also tested larger ensembles, but no change could be observed in the phase- and azimuthal-averaged particle distribution along
 $r$
and
 $z$
.
Particle parameters (particle density is
 $\unicode[STIX]{x1D70C}_{p}=1500~\text{kg}~\text{m}^{-3}$
for all sets).

Periodic boundary conditions are adopted for the particles in the azimuthal direction: if a particle exits from the computational domain along this direction, it is reseeded at the opposite
 $r{-}z$
plane with the same radial and wall-normal coordinates and with the same velocity components. Particles are free to leave the domain from the top, inlet and outlet boundaries. In this case, a new particle is reseeded from the inlet boundary at a distance of 0.85
 $d_{p}$
from the bottom surface. By doing so, the total number of particles within the domain at each time step is constant. Finally, a fully elastic rebound condition is enforced when a particle hits the bottom surface, which is treated as a no-slip wall: the particle bounces back upon impact keeping all of its kinetic energy. The perfectly elastic reflection considered here and the perfectly absorbing wall are the two limit situations when modelling particle–wall collisions. Real cases usually fall between these two limits (Marchioli & Soldati Reference Marchioli and Soldati2002).
Identification of particle clusters and voids in the
 $r{-}z$
plane at phase
 $\unicode[STIX]{x1D719}=6/8$
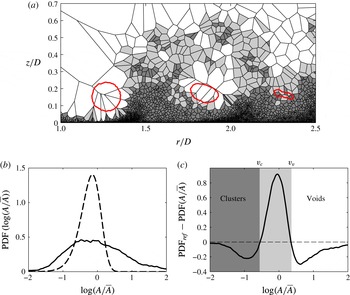
. (a) Visualization of the instantaneous particle distribution using Voronoï tessellation. Dark grey areas belong to clusters, white areas to regions depleted of particles. The primary vortices, azimuthally averaged over a
 $\unicode[STIX]{x0394}\unicode[STIX]{x1D703}=10^{\circ }$
slab, are also shown as contours of the second invariant of the velocity-gradient tensor at
 $\langle Q\rangle =Q_{rms}$
are superposed. (b) The PDF of Voronoï areas (solid line), and the reference distribution of random Poisson process (dashed line). (c) Difference between the two PDFs shown in (b): the values of
 $A/\overline{A}$
for which the difference is zero identify particle clusters and voids, and define the colour map used in (a).

3 Particle spatial distribution
In this section, we discuss the spatial distribution of the particles in connection with the vortical flow structures of the wall-jet region. Results are discussed with reference to the
 $20~\unicode[STIX]{x03BC}$
m particles. Effects due to particle size are discussed in § 5.3. To quantify particle distribution, we use Voronoï tessellation, which represents an efficient and robust tool to diagnose preferential concentration and clustering of inertial particles in turbulent flows (Monchaux, Bourgoin & Cartellier Reference Monchaux, Bourgoin and Cartellier2010, Reference Monchaux, Bourgoin and Cartellier2012). One Voronoï cell is defined as the ensemble of points that are closer to a given particle than to any other particle in the flow. The area (volume in three dimensions) of a Voronoï cell is therefore the inverse of the local particle number density. In addition Voronoï areas are naturally evaluated around each particle and provide a direct measure of preferential concentration at the inter-particle length scale (Monchaux et al.
Reference Monchaux, Bourgoin and Cartellier2010). Compared to box counting methods, Voronoï tessellation is computationally more efficient and does not require an a priori selection of an arbitrary length scale to compute concentration. Compared to pair correlation functions, Voronoï tessellation has the advantage of providing local information about particle clusters. An example of Voronoï tessellation for the present flow is shown in figure 2(a), which illustrates the instantaneous distribution of the
 $20~\unicode[STIX]{x03BC}\text{m}$
particles within a quasi-two-dimensional
 $r{-}z$
slab at phase
 $\unicode[STIX]{x1D719}=6/8$
. Such slab has azimuthal thickness
 $\unicode[STIX]{x0394}\unicode[STIX]{x1D703}=10^{\circ }$
, is centred at
 $\unicode[STIX]{x1D703}=\unicode[STIX]{x03C0}/12$
and was chosen to ensure tessellation of a sufficiently large (for visualization purposes) sample of particles. In this diagram, cells corresponding to clusters are coloured in dark grey, whereas regions depleted of particles are coloured in white. Also shown are the contours of the phase- and azimuthal- (over the
 $\unicode[STIX]{x0394}\unicode[STIX]{x1D703}$
slab) averaged second invariant of the velocity-gradient tensor at
 $\langle Q\rangle =Q_{rms}$
, to visualize the position of three successive primary vortices. Clusters and voids are identified by comparing the probability density function (PDF) of the Voronoï areas obtained from the simulation to that of a synthetic random Poisson process, which is well approximated by a gamma distribution (Ferenc & Néda Reference Ferenc and Néda2007; Monchaux et al.
Reference Monchaux, Bourgoin and Cartellier2010). This comparison is shown in figure 2(b), where the Voronoï areas are normalized using the average Voronoï area,
 $\overline{A}$
(equivalent to the inverse of the mean particle number density), independent of the spatial organization of the particles. As found previously (Monchaux et al.
Reference Monchaux, Bourgoin and Cartellier2010), in the case of heavy particles, the measured PDF (solid line) departs from the Poisson distribution (dashed line), with higher probability of finding depleted regions (large Voronoï areas) and populated regions (small Voronoï areas), a typical signature of preferential concentration. When the difference between the two PDFs is considered (figure 2
c), two cross-over points can be identified:
 ${\mathcal{V}}_{c}$
represents the threshold value of
 ${\mathcal{V}}=A/\overline{A}$
below which Voronoï areas are considered to belong to a cluster (dark grey areas in figure 2
a);
 ${\mathcal{V}}_{\unicode[STIX]{x1D708}}$
represents the threshold value of
 ${\mathcal{V}}$
above which Voronoï areas are considered to belong to a void (white areas in figure 2
a).
Figure 2 shows that the highest particle concentration is found in the near-wall region because particles exiting the domain are continually reseeded at the surface. In an effort to provide a fair characterization of particle distribution in this region, unbiased by the reseeding condition, particles located at a distance
 $z_{p}<0.05D$
from the bottom surface are considered to be in contact with the surface and thus excluded from the calculation of the PDF. There is evidence of strong preferential concentration at the periphery of the high enstrophy regions in the wall jet, characterized by high values of
 $\langle Q\rangle$
. The centre of the primary vortices is almost depleted of particles, consistent with the centrifugation mechanism first described by Eaton & Fessler (Reference Eaton and Fessler1994). The flow separation region between two successive primary vortices is characterized by large-scale clusters that stretch away from the bottom surface, up to an height
 $z\simeq 0.3D$
. These clusters are associated with a strong vertical particle flux and fluid ejections, as explained in the next section. In the outer flow region (at a distance
 $z\simeq 0.6D$
from the surface), small sparse clusters can still be observed.
The Voronoï tessellation in the
 $r{-}\unicode[STIX]{x1D703}$
plane (which includes all particles with vertical position
 $z_{p}/D\in [0.05,0.1]$
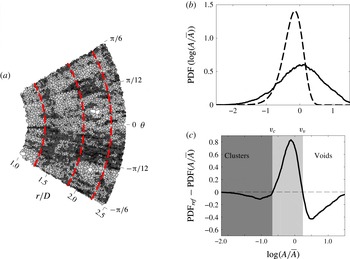
) together with the corresponding PDFs are shown in figure 3, at the same phase as figure 2. The radial location of the primary vortices is indicated by their axis (dashed lines). Only the cells in the region
 $r/D\in [1,3]$
were considered to calculate the average area
 $\overline{A}$
. Again the PDF of the Voronoï areas is wider than the random Poisson process and the two cross-over values can be used to identify the characteristic size of clusters and voids (figure 3
b,c). The elevated clusters in figure 2(a) appear now as radially aligned streaks distributed along the azimuthal direction and downstream of each primary vortex. At this phase, the azimuthal inter-cluster spacing is approximately
 $\unicode[STIX]{x03C0}/9$
, quite close to the azimuthal periodicity (
 $\unicode[STIX]{x03C0}/12$
) of the rib-like vortices observed in the single-phase simulations of Wu & Piomelli (Reference Wu and Piomelli2015). This inhomogeneity in particle distribution is extremely persistent in the wall-jet region and has been reported also in previous studies of sediment bed erosion (Munro et al.
Reference Munro, Bethke and Dalziel2009; Bethke & Dalziel Reference Bethke and Dalziel2012), where spoke-like scar features were found to form on the crater interior. As will be discussed in the last section of this paper, the secondary instability of the primary vortices and the associated small-scale structures are the key ingredients determining such preferential concentration of particles.
Identification of particle clusters and voids in the
 $r{-}\unicode[STIX]{x1D703}$
plane at phase
 $\unicode[STIX]{x1D719}=6/8$
. Only particles with vertical position
 $z_{p}/D\in [0.05,0.1]$
are considered. (a) Visualization of instantaneous particle distribution using two-dimensional Voronoï tessellation. Dark grey areas belong to clusters, white areas to regions depleted of particles. The red dashed lines illustrate the axis of three consecutive primary vortices. (b) The PDF of Voronoï areas (solid line), and the reference distribution of random Poisson process (dashed line). (c) Difference between the PDFs shown in (b): the values of
 $A/\overline{A}$
for which the difference is zero identify particle clusters and voids, and define the colour map used in (a).

4 Particle pick up and particle fluxes
In this section, we analyse the initiation of particle resuspension from the bottom surface. During this process, particles are first lifted off the surface (pick up) and then remain airborne in the flow. To estimate the particle pick-up rate in the different portions of the wall-jet flow, we use the pick-up function
 $P_{k}$
proposed by van Rijn (Reference van Rijn1984), which was selected for its simplicity:
 $$\begin{eqnarray}\frac{P_{k}}{\sqrt{(s-1)g\,d_{p}}}=\unicode[STIX]{x1D6FC}d_{\ast }^{\unicode[STIX]{x1D6FD}}t_{\ast }^{\unicode[STIX]{x1D6FE}},\end{eqnarray}$$
where
 $\unicode[STIX]{x1D6FC}=0.00033$
,
 $\unicode[STIX]{x1D6FD}=0.3$
and
 $\unicode[STIX]{x1D6FE}=1.5$
are coefficients obtained by fitting experimental data, and
 $s$
is the particle-to-fluid density ratio. These are used to express the non-dimensional particle diameter
 $d_{\ast }=d_{p}[(s-1)g/\unicode[STIX]{x1D708}_{f}^{2}]^{1/3}$
. The independent variable
 $t_{\ast }=(\unicode[STIX]{x1D703}-\unicode[STIX]{x1D703}_{c})/\unicode[STIX]{x1D703}_{c}$
is a function of the Shields parameter (Shields Reference Shields1936):
 $$\begin{eqnarray}\unicode[STIX]{x1D703}=\frac{\unicode[STIX]{x1D70F}_{w}}{(s-1)\unicode[STIX]{x1D70C}_{f}g\,d_{p}},\end{eqnarray}$$
which expresses the ratio between the wall shear stress of the fluid on the particle bed,
 $\unicode[STIX]{x1D70F}_{w}$
, and the weight per area of the individual particles in the bed. The critical value of the Shields parameter,
 $\unicode[STIX]{x1D703}_{c}$
, is used to establish the condition of incipient motion, and is flow dependent. It also decreases with increasing particle friction Reynolds number
 $Re_{\unicode[STIX]{x1D70F},p}=u_{\unicode[STIX]{x1D70F}}d_{p}/\unicode[STIX]{x1D708}_{f}$
, with
 $u_{\unicode[STIX]{x1D70F}}$
being the friction velocity. In our flow,
 $Re_{\unicode[STIX]{x1D70F},p}\simeq 0.7$
for the
 $20~\unicode[STIX]{x03BC}\text{m}$
particles considered. Based on the Shields curve reported by Miller, McCave & Komar (Reference Miller, McCave and Komar1977), this yields
 $\unicode[STIX]{x1D703}_{c}\approx 0.122$
(table 2). Using the azimuthally and phase-averaged wall shear stress,
 $\langle \unicode[STIX]{x1D70F}_{w}\rangle$
, in (4.2), the behaviour of
 $\unicode[STIX]{x1D703}$
,
 $t_{\ast }$
and, in turn,
 $P_{k}$
along the radial direction can be obtained.
The radial profile of
 $P_{k}$
computed at
 $\unicode[STIX]{x1D719}=0/8$
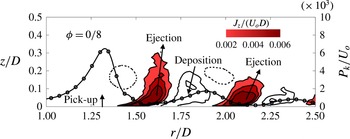
(solid line with marker) is shown in figure 4, together with the vertical particle flux (solid contours). The location of the primary vortices is also shown for reference. The flux of particles set into motion, including initial pick up and subsequent suspension, can be quantitatively described by the particle momentum across a suitably defined control area. Considering a two-dimensional domain
 $\unicode[STIX]{x1D6FA}$
of size
 $\unicode[STIX]{x1D6FF}r\times \unicode[STIX]{x1D6FF}z$
, for instance, the associated vertical particle flux is:
 $$\begin{eqnarray}J_{z}|_{\unicode[STIX]{x1D6FA}}=\mathop{\sum }_{\unicode[STIX]{x1D6FA}}v_{p,z}\unicode[STIX]{x1D6FF}r,\end{eqnarray}$$
where summation is performed only over the particles within the region
 $\unicode[STIX]{x1D6FA}$
. Equation (4.3) provides the net vertical flux, since the particle velocity
 $v_{p,z}$
may be either positive or negative inside
 $\unicode[STIX]{x1D6FA}$
. Hence, the two-dimensional map of
 $J_{z}$
shown in figure 4, obtained by dividing the
 $r{-}z$
plane into
 $200\times 100\;\unicode[STIX]{x1D6FA}$
domains, can provide useful information about the collective particle motion in an average sense. At phase
 $\unicode[STIX]{x1D719}=0/8$
, the primary vortices generate strong ejections of particles at
 $r/D\simeq 1.5$
and at
 $r/D\simeq 2.1$
. However, the maximum pick-up rate occurs immediately upstream of the primary vortex due to the local increase of the wall shear stress generated on its downwash side. A similar behaviour is observed at other phases: particle ejections and depositions are localized events associated with the passage of consecutive primary vortices.
Particle pick-up rate (—
 $\circ$
—) and vertical flux in the wall-jet region at phase
 $\unicode[STIX]{x1D719}=0/8$
. The isocontours of the vertical flux,
 $J_{z}$
, refer to levels 0.002, 0.004 and 0.006
 $U_{o}D$
(filled contours, corresponding to particle ejections away from the bottom surface), and to levels
 $-$
0.002,
 $-$
0.004 and
 $-$
0.006
 $U_{o}D$
(empty contours, corresponding to particle motions towards the surface). Locations of the primary vortices are indicated by the dotted line showing
 $\langle \unicode[STIX]{x1D714}_{\unicode[STIX]{x1D703}}\rangle =10U_{o}/D$
.

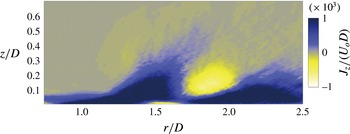
The intensity of the events shown in figure 4 changes with time (not shown), and the time-averaged vertical flux, shown in figure 5, may be used to provide an approximation of the pilot’s view during brownout. The first ejection region, occurring at
 $r/D\simeq 1.5$
, is associated with a strong mean resuspension flux up to a height
 $z\simeq 0.5D$
. This is followed by small, flat deposition patch centred at
 $r/D\simeq 1.75$
and related to short-term re-entrainment phenomena, as will be elucidated in the next section. The strong resuspension flux is located where the primary vortex reaches the ground and induces flow separation. In Mulinti & Kiger (Reference Mulinti and Kiger2012) the first ejection region is observed at
 $r/D\approx 1.7$
; in Munro et al. (Reference Munro, Bethke and Dalziel2009) and Bethke & Dalziel (Reference Bethke and Dalziel2012) at
 $r/D\approx 0.9$
, the differences in the location being due to the change of flow parameters (the jet-to-plane distance, in particular) and particle properties. Regardless of the radial position at which the first ejection occurs, however, strong resuspension fluxes are always induced by the first impact of the vortex ring on the bottom surface in the impingement region. This suggests that the resulting particle cloud may impair visibility especially in the landing/take-off region during brownout.
Azimuthally and time-averaged vertical particle flux in the
 $r{-}z$
plane.

Radial flux of particles relative to the motion of the primary vortices. The value of
 $J_{r,rel}$
is computed at the same time frame as figure 4 and averaged over three different radial regions:
 $r/D\in [1.15,1.40)$
,
 $[1.40,1.65)$
and
 $[1.65,1.90]$
.

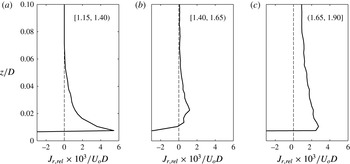
To identify the dominant mechanisms sustaining long-term particle resuspension, in figure 6 we examine the radial particle flux at the same time and phase of figure 4. The radial flux is computed as:
 $$\begin{eqnarray}J_{r,rel}|_{\unicode[STIX]{x1D6FA}}=\mathop{\sum }_{\unicode[STIX]{x1D6FA}}(v_{p,r}-u_{vor,r})\unicode[STIX]{x1D6FF}z,\end{eqnarray}$$
where
 $u_{vor,r}$
is the convection velocity of the primary vortex along the outer shear layer of the wall jet (note that the overbar representing filtered quantities has been omitted for ease of notation). Equation (4.4) accounts for the relative motion between the particle and the primary vortex during their interaction. The profiles in figure 6 refer to different regions (
 $\unicode[STIX]{x1D6FA}$
in (4.4)) along the radial direction:
 $r/D\in [1.15,1.40)$
, where the particles are lifted off;
 $r/D\in [1.40,1.65)$
, where particles are ejected away from the surface; and
 $r/D\in [1.65,1.90]$
, where particles may deposit. A high positive radial flux is observed in the near-wall region underneath the upstream primary vortex (first vortex from the left in figure 4), indicating that a particle that is lifted up here will overtake the primary vortex and feed the suspension. This happens because the vortex is located in the outer shear layer of the wall jet, and its radial convection velocity is significantly smaller than the velocity experienced by the particles upon removal from the surface. In the ejection-dominated region
 $r/D\in [1.40,1.65)$
, the radial flux is more uniform and close to zero indicating that particles are mainly moving in the wall-normal direction relative to the primary vortex. In the deposition-dominated region
 $r/D\in [1.65,1.90]$
, the radial flux increases again because a fraction of the suspended particles is entrained in the downwash side of the downstream primary vortex (second vortex from the left in figure 4 at
 $r/D\approx 2.0$
), get speeded up by the vortex rotation and travel underneath the vortex to further downstream location.
5 Particle suspension mechanisms
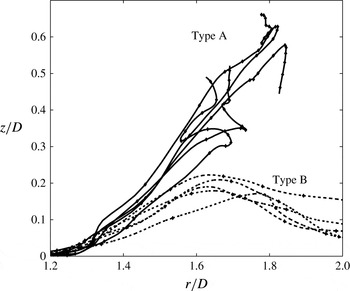
The statistical observables discussed in the previous sections are the macroscopic manifestation of particle interaction with the jet vortices. In this section, we examine the physical mechanisms that drive such interaction at the particle scale. We start by analysing the different types of resuspension dynamics that characterize the re-entrained particles: we recall here that we focus only on the motion of already detached particles in regions of the flow where particle–particle interactions can be neglected. With reference to figure 7, we can identify a significant proportion of particles that remain airborne for a long time after lift off from the bottom surface (solid trajectories in figure 7): these particles, referred to as ‘type-A particles’ hereinafter, are most affected by the large-scale primary vortices and generate the brownout cloud by getting entrained into the structure-free outer region of the flow. Other particles, denoted as ‘type-B particles’ (dashed trajectories in figure 7), undergo short-term resuspension (not to be confused with saltation, which cannot be reproduced by our simulation setting since we do not model the physico-chemical interactions that induce such transport mode) and fall back to the surface soon after lift off: these particles do not reach a height sufficient to be entrained in the brownout cloud. The arbitrary threshold height chosen here to discriminate between type-A and type-B particles is
 $z_{p,max}=0.3D$
, just above the position of the primary vortex in the wall-jet region. We also note that the trajectories of type-A particles exhibit significant deviations with respect to those of type-B particles only above
 $z_{0}=0.02D$
, a height that is 20 % of the inner boundary layer thickness and about
 $1/10$
of the average distance between the primary vortex core and the surface in the wall-jet region. A third category is represented by particles that simply move along the surface without being re-entrained by the wall-jet flow structures (not shown). These particles will not be discussed in the following because they are not involved in the resuspension phenomena we want to analyse and do not contribute to the brownout cloud formation.
Sample particle trajectories showing long-term resuspension (type-A particles, ——); and short-term resuspension (type-B particles, – – –).

5.1 Initial re-entrainment of particles by near-wall vortices
Type-A and type-B particles have the same density and diameter. Therefore the different heights reached by these particles are due solely to their different interactions with the flow structures. Counter to intuition, our simulations show that the initial pick up and lift off of type-B particles occurs upstream compared to type-A particles, in a region where the approaching primary vortex is still quite far from the impingement surface. On average, we find that type-A (type-B) particles cross the
 $z_{0}=0.02D$
threshold at
 $r\simeq 0.87D$
(
 $r\simeq 0.66D$
), and reach the bottom periphery of the primary vortex (
 $z\simeq 0.1D$
) at
 $r\simeq 1.38D$
(
 $r=1.48D$
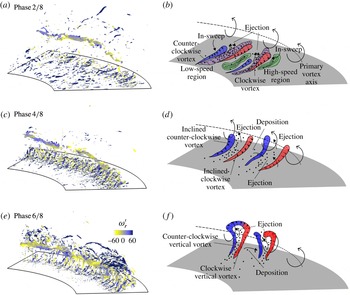
). This finding can be explained considering figure 8, where the time evolution of the flow structures in the wall-jet region is shown. The initial particle lift off is driven by the near-wall small-scale vortices generated by the approaching primary vortex (see figure 8
a). The action of these vortices on particles is similar to that of the hairpin vortices in turbulent boundary layer (Kaftori et al.
Reference Kaftori, Hetsroni and Banerjee1995a
,Reference Kaftori, Hetsroni and Banerjee
b
; Pan & Banerjee Reference Pan and Banerjee1996; Marchioli & Soldati Reference Marchioli and Soldati2002). The trailing legs of the vortices, which become stronger and more coherent as the primary vortex approaches the surface, are embedded in the near-wall region, where they can entrain small lumps of fluid into localized sweep and ejection events that give raise to regions of low-speed fluid alternated to regions of high-speed fluid, as shown in figure 8(b). We remark here that these events should not be confused with those observed in fully developed wall-bounded turbulence, where coherent structures are created by a different type of flow instability and sustained by a different physical mechanism, the well-known turbulence regeneration cycle (Adrian, Meinhart & Tomkins Reference Adrian, Meinhart and Tomkins2000). As soon as the near-wall vortices roll up around the primary vortex, the rib-like structures described in the Introduction are formed (figure 8
c,e). At this stage, particles can be lifted up from the surface (figure 8
d), and then either ejected towards the upwash side of the primary vortex (if entrained in a fluid ejection) or pushed away from the primary vortex (if entrained in a fluid sweep), as indicated in figure 8(f).
(a,c,e) Instantaneous flow structures at different simulation times. Structures are visualised as isosurfaces of
 $Q/U_{o}^{2}D^{-2}=1600$
, and coloured by the radial fluid vorticity
 $\unicode[STIX]{x1D714}_{r}^{\prime }$
. (b,d,f) Schematics of the dynamics of the vortical structures and corresponding particle motion.

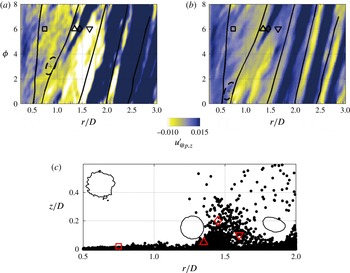
To corroborate the observations drawn from figure 8, in figure 9 we examine the spatio-temporal history of the vertical fluid velocity fluctuation,
 $u_{@p,z}^{\prime }$
, evaluated at the particle position and conditionally sampled according to the particle type: type-A in figure 9(a); type-B in figure 9(b). Dark (light) regions correspond to positive (negative) fluctuations, namely to wall-normal fluid ejections (sweeps). The trajectories followed by the primary vortex core in the
 $r{-}\unicode[STIX]{x1D703}$
plane are also shown, indicated by the solid black lines. In the region where particle lift off starts (indicated by the dashed ellipsoids in figure 9
a,b), and before flow separation, type-B particles are subjected to regions of larger
 $u_{@p,z}^{\prime }$
compared to type-A particles, indicating stronger entrainment into fluid ejections (e.g. the square marker location in figure 9
c). In this region, however, rib-like vortices have not formed yet and near-wall ejections are not strong enough to ensure long-time resuspension. Figure 9(a) shows that type-A particles leave the surface later in time (i.e. in phase
 $\unicode[STIX]{x1D719}$
) at locations further downstream, where they can be carried by stronger ejections and reach higher into the upwash side of the primary vortex upon flow separation. We also note that, downstream of flow separation (
 $r/D>1.2$
), type-A particles are subjected to regions of much higher (both positive and negative) fluid velocity fluctuations. These regions are marked by the upward-pointing triangle and diamond in figure 9(c). The downward-pointing triangle in figure 9(a,c) marks the region at which the resuspended particles give rise to the deposition flux observed in figures 4 and 5: here, we find that type-A particles are entrained in the fluid downwash only if
 $u_{@p,z}^{\prime }$
attains large enough negative values, whereas smaller vertical fluctuations are required to entrain type-B particles. This means that type-B particles are more likely to settle, and constitute a major proportion of the deposition flux (see also figure 7).
Colour map of the wall-normal fluid velocity fluctuations at particle position
 $u_{@p,z}^{\prime }$
, conditionally sampled according to the particle type: (a) type-A particles; (b) type-B particles. Solid black lines: location of the primary vortex core. Dashed lines: near-wall region where the first particle lift off occurs. Markers in (a,b) identify different events associated with the instantaneous particle distribution at
 $\unicode[STIX]{x1D719}=6/8$
shown in (c). Solid contours in (c) illustrate the locations of the primary vortices.

The interaction between type-A particles and the jet flow structures is further confirmed by the behaviour of the auto-correlation of
 $u_{@p,i}^{\prime }$
(
 $i=r$
,
 $z$
) sampled at particle position upon initial lift off from the surface. This correlation has been quantified here by the correlation coefficient:
 $$\begin{eqnarray}R_{u_{@p,i}^{\prime }}(\unicode[STIX]{x1D70F})=\frac{\langle u_{@p,i}^{\prime }(t_{0})u_{@p,i}^{\prime }(t_{0}+\unicode[STIX]{x1D70F})\rangle }{\langle u_{@p,i}^{\prime 2}(t_{0})\rangle },\end{eqnarray}$$
where
 $\langle .\rangle$
represents the ensemble-averaging operator, and
 $t_{0}$
is the time at which particle lift off occurs (namely when the particle crosses the threshold height
 $z_{0}=0.02D$
for the first time). In wall units,
 $z_{0}^{+}\equiv z_{0}u_{\unicode[STIX]{x1D70F}}/\unicode[STIX]{x1D708}_{f}\simeq 60$
: this is the distance within which the trailing legs of the hairpin vortices are usually found in turbulent boundary layer (Adrian et al.
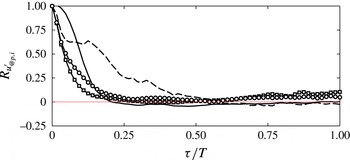
Reference Adrian, Meinhart and Tomkins2000). The radial and wall-normal coefficients for type-A and type-B particles are shown in figure 10. Time decorrelation is always faster for the type-B particles, and occurs within one quarter of the forcing period
 $T$
. This indicates that these particles leave rather soon the fluid event that has produced their lift off, limiting the duration of particle interaction with the flow structures. In contrast, type-A particles are characterized by more persistent correlations, especially in the vertical direction: for these particles,
 $R_{u_{@p,z}^{\prime }}$
exhibits a plateau at
 $R_{u_{@p,z}^{\prime }}\simeq 0.65$
over a time span of about
 $0.1T$
, associated with the motion of those particles that end up in the suspended cloud, and then vanishes at
 $\unicode[STIX]{x1D70F}/T\simeq 0.6$
.
Temporal autocorrelation of fluid velocity fluctuations at particle locations. Lines refer to type-A particles: ——
 $R_{u_{@p,r}^{\prime }}$
; – – –
 $R_{u_{@p,z}^{\prime }}$
. Lines with symbols refer to type-B particles: –
 $\Box$
–
 $R_{u_{@p,r}^{\prime }}$
; —
 $\circ$
—
 $R_{u_{@p,z}^{\prime }}$
.

The statistical observables discussed in this section demonstrate that the different resuspension dynamics followed by type-A particles and by type-B particles originates from their initial interaction with the small-scale near-wall vortices. In the next section, we will show how this interaction leads to remarkable differences in the maximum heights that the particles can reach after flow separation.
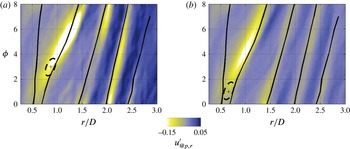
Colour map of the radial fluid velocity fluctuations at particle location
 $u_{@p,r}^{\prime }$
, conditionally sampled according to the particle type: (a) type-A particles; (b) type-B particles. Thick solid lines: location of the primary vortex core. Dashed lines: near-wall region where the first particle lift off occurs.

5.2 Particle long-term suspension by rib-like vortices
As the primary vortex moves downstream along the outer shear layer of the wall jet, the near-wall vortices detach from the bottom surface with the separated flow (see figure 8
c), and form an array of rib-like vortices wrapped around the primary one (see figure 8
d). During detachment and roll up, the fluctuating fluid velocity associated with the sweep/ejection events generated by small-scale vortices changes from
 $u_{z}^{\prime }$
to
 $u_{r}^{\prime }$
. In particular, the local fluid ejections in between neighbouring vortices are characterized by positive
 $u_{z}^{\prime }$
before detachment and by negative
 $u_{r}^{\prime }$
afterwards. The opposite is true for the fluid sweeps. To examine particle interaction with the rib-like vortices, in figure 11 we show the spatio-temporal distribution of
 $u_{@p,r}^{\prime }$
conditionally sampled according to the particle type. Also shown are the regions where the first particle lift off from the surface occurs (dashed lines). For the type-A particles, lift off occurs immediately upstream of flow separation and vortex roll up, which correspond to the light colour region at
 $1<r/D<1.2$
and
 $4<\unicode[STIX]{x1D719}<6$
in figure 11(a). Particles entrained by the newly formed rib-like vortices are readily propelled into a region of strong negative radial fluctuation relative to the mean wall jet: here, particles are driven against the upwash side of the primary vortex and receive another vertical push toward the outer flow region. For the type-B particles, lift off occurs approximately half a jet forcing period before they reach the separation region. The smaller negative values of
 $u_{@p,r}^{\prime }$
sampled by type-B particles in the region
 $1<r/D<1.2$
,
 $4<\unicode[STIX]{x1D719}<6$
indicate weak interaction with the rib-like vortices. Hence type-B particles cannot be efficiently propelled above the primary vortex. A weaker interaction with the flow structures appears to characterize type-B particles in the entire wall-jet region, as indicated by the narrower range of velocity fluctuations sampled by these particles (see figures 9 and 11).
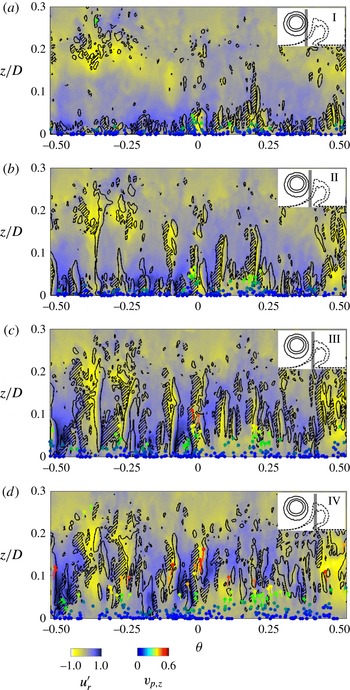
Instantaneous particle distribution and rib-like vortices at four
 $\unicode[STIX]{x1D703}$
–
 $z$
bins downstream of the primary vortex (
 $\unicode[STIX]{x1D719}=6/8$
). The inset in each panel visualizes the bin position relative to the primary vortex. Bins have radial width 0.02
 $D$
, and are centred at
 $r_{c}=1.34D$
(zone I), 1.36
 $D$
(zone II), 1.38
 $D$
(zone III) and 1.4
 $D$
(zone IV). The colour map refers to the radial fluid velocity fluctuations,
 $u_{r}^{\prime }$
, evaluated at
 $r_{c}$
. Contours refer to the wall-normal fluid vorticity fluctuations: ——
 $\unicode[STIX]{x1D714}_{z}^{\prime }=10$
; – – –
 $\unicode[STIX]{x1D714}_{z}^{\prime }=-10$
(patterned regions enclosed by dashed contours highlight areas of strong negative vorticity). Particles are rendered as dots coloured by their vertical velocity,
 $v_{p,z}$
. Particle trajectories in the interval
 $\unicode[STIX]{x1D6FF}t=T/64$
preceding the visualized field are also shown.

The observations made by examining figures 9 and 11 can be verified by correlating the instantaneous distribution of particles and rib-like vortices in the cross-sectional (
 $\unicode[STIX]{x1D703}{-}z$
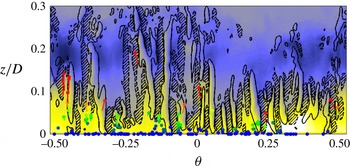
) plane. This correlation is shown in figure 12, where four neighbouring zones in the downstream vicinity of the primary vortex are examined. At the time of visualization, rib-like vortices are rolled around the primary vortex and have a large portion in the nearly vertical direction. Each examining zone has thickness
 $\unicode[STIX]{x1D6FF}r=0.02D$
, sufficient to show a reasonable portion of the vortices, and to discern particle distribution. Particles are coloured by their vertical velocity
 $v_{p,z}$
, and their trajectory over the time span
 $\unicode[STIX]{x1D6FF}t=T/64$
preceding the visualized instant is also drawn. Vortices are visualized by the colour map of
 $u_{r}^{\prime }$
to which contours of the wall-normal vorticity fluctuations,
 $\unicode[STIX]{x1D714}_{z}^{\prime }$
, are superposed. Zone I (figure 12
a) comprises the near-wall portion of the rib-like vortices: only short vorticity contours, representing the projection of the inclined vortex tails, are observed. Particles already show some clustering and follow fluid ejections in the
 $u_{r}^{\prime }<0$
regions in between neighbouring pairs of counter-rotating vortices (see for instance the burst of particles at
 $\unicode[STIX]{x1D703}=0$
). In zone II (figure 12
b), the vertical extent of the rib-like vortices increases. Several vortex pairs can be seen below
 $z\simeq 0.15D$
, as well as more particle ejections within intra-vortex low-speed regions (e.g. at
 $\unicode[STIX]{x1D703}=0$
and
 $\unicode[STIX]{x1D703}=0.24$
rad, where particles have reached
 $z\simeq 0.08D$
). Compared to zone I, the vertical velocity (and thus momentum) of the ejected particles is higher. Zone IV, in particular, corresponds to the peak of vertical particle flux shown in figure 5. Particle still travel in the same
 $u_{r}^{\prime }<0$
regions in which they were first entrained close to the bottom surface. This persistent interaction allows particles to reach the high shear region between primary and secondary vorticity, where the Reynolds stresses (both periodic and stochastic) create a region of high turbulence production (Wu & Piomelli Reference Wu and Piomelli2015).
Identification of particle clusters and voids in the
 $r{-}z$
plane (a,b) and
 $r{-}\unicode[STIX]{x1D703}$
plane (c,d) at phase
 $\unicode[STIX]{x1D719}=6/8$
for particles with
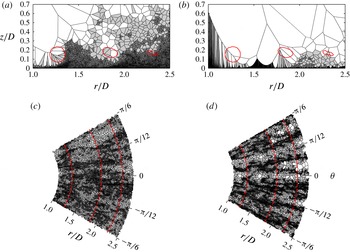
 $d_{p}=10~\unicode[STIX]{x03BC}\text{m}$
(a,c); and
 $d_{p}=30~\unicode[STIX]{x03BC}\text{m}$
(b,d).

The discussion in this section demonstrates that long-term particle resuspension (required to generate the cloud of airborne particles) can be observed only if (i) initial particle lift off occurs within the low-speed regions that the near-wall vortices create immediately. Further downstream, in zones III and IV (figures 12
c and 12
d, respectively), other particle ejection sites can be appreciated (e.g. at
 $\unicode[STIX]{x1D703}=-0.25$
and 0.5 rad) before flow separation; and if (ii) lifted off particles remain within the same intra-vortex region during flow separation and rib-like vortex formation. This is the only mechanism that can provide the vertical push the particles need to reach the outer flow region. Type-A particles are more likely to obey to such mechanisms, whereas type-B particles are removed from the surface too early to segregate into the
 $u_{r}^{\prime }<0$
regions (in fact, these particles experience
 $u_{r}^{\prime }>0$
regions more often than type-A particles) and to interact with the vertically aligned portion of the rib-like vortices.
5.3 Effect of particle size on resuspension dynamics
In this section we assess the effect of particle size on the capability of the wall-jet flow structures to resuspend particles long enough and far enough from the bottom surface to generate the brownout cloud. To this aim, we compare the spatial distribution of the
 $20~\unicode[STIX]{x03BC}\text{m}$
particles (intermediate size), shown in figures 2(a) and 3(a), with that of the
 $d_{p}=10~\unicode[STIX]{x03BC}\text{m}$
particles (small size), shown in figure 13(a,c), as well as that of the
 $d_{p}=30~\unicode[STIX]{x03BC}\text{m}$
particles (large size), shown in figure 13(b,d). For the
 $r{-}\unicode[STIX]{x1D703}$
plane distribution the same wall-normal slab
 $z_{p}/D\in [0.05,0.1]$
considered in figure 3 is used for the
 $10~\unicode[STIX]{x03BC}\text{m}$
particles, whereas a slab closer to the bottom surface (
 $z_{p}/D\in [0,0.05]$
) is used for
 $30~\unicode[STIX]{x03BC}\text{m}$
. The distribution of the small and intermediate size particles are very similar, with vortex centres depleted of particles and separation regions between two consecutive vortices occupied by clusters. On the other hand, large particles are barely resuspended in the present flow configuration due to their larger inertia. Still, their distribution in the near-wall region is highly correlated with the roll-up location of the rib-like vortices, as demonstrated by the long streaks visible in figure 13(d). Particle resuspension fluxes (not shown) are in qualitative agreement with the trends highlighted by figure 13: compared to the reference
 $20~\unicode[STIX]{x03BC}\text{m}$
particle set, vertical fluxes increase (respectively decrease) significantly for the
 $10~\unicode[STIX]{x03BC}\text{m}$
particles (respectively
 $30~\unicode[STIX]{x03BC}\text{m}$
particles). Regardless of particle inertia, however, resuspension fluxes are always observed in the flow separation region downstream of the primary vortex.
Instantaneous particle distribution and rib-like vortices in
 $\unicode[STIX]{x1D703}$
–
 $z$
bin at
 $\unicode[STIX]{x1D719}=6/8$
, in the downstream vicinity of the primary vortex for the
 $d_{p}=10~\unicode[STIX]{x03BC}$
m particles. Lines and colours are the same as figure 12.

As far as initial particle re-entrainment is concerned, we find that type-A (type-B) particles with
 $d_{p}=10~\unicode[STIX]{x03BC}\text{m}$
cross the
 $z_{0}=0.02D$
threshold nearly at the same radial distance (
 $r\simeq 0.70D$
and
 $r\simeq 0.67D$
, respectively): this happens because particles with lower inertia can be lifted off the surface more easily by the wall-jet vortices. As observed for the
 $20~\unicode[STIX]{x03BC}\text{m}$
particles in § 4, however, a trajectory cross-over occurs between type-A and type-B particles, which trespass the
 $z/D=0.1$
threshold at
 $r/D=1.38$
and (respectively 1.41) on average, different suspension dynamics is thus experienced also by the small size particles after initial re-entrainment. In particular, this dynamics is characterized by a longer time correlation of fluid velocity fluctuations for type-A particles compared to type-B particles (not shown).
To conclude the analysis of particle size effects, in figure 14 we demonstrate that the long-term resuspension mechanism discussed in § 5.2 remain effective in entraining particles away from the surface provided that particle inertia is small enough. The
 $10~\unicode[STIX]{x03BC}$
m particles undergoing resuspension clearly sample areas of negative radial fluid velocity fluctuations, where they interact with the vertically aligned portion of neighbouring vortex pairs and receive the vertical push need to reach the outer flow region.
6 Conclusions and future developments
In this work, we have examined the physical mechanisms that lead to particle re-entrainment and resuspension in the wake of a vertical impinging jet. This system is a model for the flow produced by a helicopter rotor hovering near the ground, and is relevant to rotorcraft brownout conditions. Due to its practical importance, the physics of this flow have recently received considerable attention (Mulinti & Kiger Reference Mulinti and Kiger2012; Kiger et al. Reference Kiger, Corfman and Mulinti2014; Dairay et al. Reference Dairay, Fortune, Lamballais and Brizzi2015; Wu & Piomelli Reference Wu and Piomelli2015, Reference Wu and Piomelli2016), but the mechanisms leading to the onset and spreading of the brownout cloud have not been fully elucidated yet, since brownout phenomena involve micron-size particles and their understanding requires a detailed analysis (at the particle scale) of particle interaction with the many vortical structures that populate the flow. To perform such analysis, we have used a numerical approach based on well-resolved LES of the flow and on Lagrangian tracking of the particles. Starting from an ideal situation of the impingement surface covered with a monolayer of sediments, we demonstrate that particles are initially lifted off the surface by the small-scale vortices that form in the near-wall region during jet impingement. These vortices can pick up already detached particles by entraining them into local fluid ejections that eventually detach from the surface following flow separation. Depending on the radial position at which re-entrainment starts, particles may be either suspended for a long time in the quiescent outer flow region or deposit again on the bottom surface after a short time. The different transport dynamics depends on the capability of particles to reach the separation region by gaining sufficient radial momentum in the wall-jet region underneath the primary vortex. Short-term resuspension characterizes those particles that are first lifted off the ground within the impingement region: these particles can only interact with ejection events of limited time persistence, which are not strong enough to suspend sediments until they reach the separation region. As a result they show a weaker tendency to segregate and interact with the rib-like vortices that form and roll around the primary vortex in the azimuthal direction. Long-term resuspension characterizes particles that are first lifted off the ground immediately before flow separation: they interact with stronger and more coherent ejection events (amplified by the passage of the primary vortex) and the interaction lasts long enough to bring sediments at the right height in the separation region. Once there, particles must reach regions of negative radial fluid velocity fluctuations (produced in between counter-rotating pairs of rib-like vortices) to be further ejected away from the bottom surface and become airborne. Particles that sample regions of positive radial fluid velocity fluctuations (produced at the sides of rib-like vortex pairs) cannot reach the upwash side of the primary vortex, never pass its bottom half and eventually move downward.
In the time-averaged sense, particle behaviour produces a suspension region near the surface followed by a deposition region, located at approximately two jet diameters downstream of the stagnation point. Suspension and deposition fluxes balance each other near the surface, while a continuous net feeding of particles in the outer flow sustains the sediment cloud. This scenario is consistent with experimental observations (Johnson et al. Reference Johnson, Leishman and Sydney2010; Bethke & Dalziel Reference Bethke and Dalziel2012; Mulinti & Kiger Reference Mulinti and Kiger2012). In particular, we find that the cloud forms in (and downstream of) the primary–secondary vorticity interaction region and not near the impingement region. The identification and quantification of initial entrainment and suspension mechanisms just summarized can provide useful indications for mitigating the impact of brownout during rotorcraft operations (e.g. suppress the formation of the rib-like vortices or inhibit particle pick up in the flow separation region), but also for developing sediment suspension models that go beyond the usual quasi-equilibrium assumption. In particular, it appears clear that low-level models based on Reynolds-averaged solutions (typically used at the industrial level to analyse this kind of flows) are not suitable. First, because the unsteady wall stress is critical in determining the onset of particle pick up. Second, because these models cannot take into account the crucial effect that the primary vortex azimuthal instability and the small-scale vortices (near-wall radial vortices in the impingement region, rib-like vortices downstream of the separation region) have on sediment distribution.
This study elucidates the fundamental physical mechanism for full entrainment of particles that are already detached from the bottom surface. However, other important phenomena may influence particle fluxes and particle concentration at different heights. If a quantitatively accurate prediction of these observables is sought, then the physico-chemical interactions governing particle detachment should be accounted for in future analyses. It would be also interesting to analyse two- and four-way coupling effects on pick up and resuspension of multi-layer particle beds. As pointed out by Mulinti & Kiger (Reference Mulinti and Kiger2012), sediment erosion quickly leads to the formation of topographic structures (valleys and ripples) that can alter the condition of plane impingement surface considered here. This might affect vortex dynamics, and in particular the evolution of the small-scale vortices. In addition to modelling related developments, further insight could be gained by assessing the importance of geometrical parameters such as swirling strength, angle of incidence of the impinging jet and nozzle-to-surface distance. Even if the physical mechanisms produced by particles–turbulence interactions are not expected to change with respect to the vertical impingement condition considered here, a quantitative dependence of resuspension and deposition fluxes on these parameters is foreseen (e.g. as a consequence of flow asymmetry in the azimuthal direction). In this respect, the present study provides a baseline test case to assess flow configurations with additional complexities. Another improvement could be to extend the range of simulation parameters such as the jet Reynolds number and the particle diameter beyond laboratory scale. However, this would require extremely expensive simulations of the full rotor at Reynolds numbers at least 20 times higher than that considered in this study to observe significant effects on the development of the large-scale vortical structures in the jet (see Wu & Piomelli (Reference Wu and Piomelli2016) for further details); performed using wall-resolved (rather than wall-modelled) LES to ensure correct prediction of particle removal and initial re-entrainment in the wall-jet region.
Acknowledgements
W.W. would like to thank the ACRI Young Investigator Training Program (YITP) and the Natural Sciences and Engineering Research Council of Canada (RGPIN-2016-04391) for the financial support. G.S. gratefully acknowledges the University of Udine for grant Mobilità Europea ed extra Europea per ricerche per tesi. The authors also thank Dr F. Zonta for fruitful discussions regarding this work. The authors thank the Centre for Advanced Computing for the computational support.
Appendix A. Derivatives in cylindrical coordinates
In cylindrical coordinates, the left-hand side of (2.5) can be rewritten as:
 $$\begin{eqnarray}\displaystyle \frac{\text{d}\boldsymbol{v}_{p}}{\text{d}t} & = & \displaystyle \frac{\text{d}}{\text{d}t}(v_{p,\unicode[STIX]{x1D703}}\hat{\boldsymbol{e}}_{\unicode[STIX]{x1D703}}+v_{p,r}\hat{\boldsymbol{e}}_{r}+v_{p,z}\hat{\boldsymbol{e}}_{z})\end{eqnarray}$$
 $$\begin{eqnarray}\displaystyle & = & \displaystyle \frac{\text{d}v_{p,\unicode[STIX]{x1D703}}}{\text{d}t}\hat{\boldsymbol{e}}_{\unicode[STIX]{x1D703}}+v_{p,\unicode[STIX]{x1D703}}\frac{\text{d}\hat{\boldsymbol{e}}_{\unicode[STIX]{x1D703}}}{\text{d}t}+\frac{\text{d}v_{p,r}}{\text{d}t}\hat{\boldsymbol{e}}_{r}+v_{p,r}\frac{\text{d}\hat{\boldsymbol{e}}_{r}}{\text{d}t}+\frac{\text{d}v_{p,z}}{\text{d}t}\hat{\boldsymbol{e}}_{z}+v_{p,z}\frac{\text{d}\hat{\boldsymbol{e}}_{z}}{\text{d}t},\end{eqnarray}$$
where
 $\hat{\boldsymbol{e}}_{\unicode[STIX]{x1D703}}$
,
 $\hat{\boldsymbol{e}}_{r}$
and
 $\hat{\boldsymbol{e}}_{z}$
are the unit vectors of the polar coordinate system. Because
 $\hat{\boldsymbol{e}}_{\unicode[STIX]{x1D703}}$
and
 $\hat{\boldsymbol{e}}_{r}$
are different from point to point (with respect to the static origin), the time derivatives of
 $\hat{\boldsymbol{e}}_{\unicode[STIX]{x1D703}}$
and
 $\hat{\boldsymbol{e}}_{r}$
are non-zero. The rotation velocity of
 $\hat{\boldsymbol{e}}_{\unicode[STIX]{x1D703}}$
and
 $\hat{\boldsymbol{e}}_{r}$
can be defined as
 $\dot{\unicode[STIX]{x1D703}}=v_{p,\unicode[STIX]{x1D703}}/r$
, and the time derivatives of the unit vectors are:
 $$\begin{eqnarray}\frac{\text{d}\hat{\boldsymbol{e}}_{\unicode[STIX]{x1D703}}}{\text{d}t}=-\dot{\unicode[STIX]{x1D703}}\hat{\boldsymbol{e}}_{r}=-\frac{v_{p,\unicode[STIX]{x1D703}}}{r}\hat{\boldsymbol{e}}_{r},\quad \frac{\text{d}\hat{\boldsymbol{e}}_{r}}{\text{d}t}=\dot{\unicode[STIX]{x1D703}}\hat{\boldsymbol{e}}_{\unicode[STIX]{x1D703}}=\frac{v_{p,\unicode[STIX]{x1D703}}}{r}\hat{\boldsymbol{e}}_{\unicode[STIX]{x1D703}},\quad \frac{\text{d}\hat{\boldsymbol{e}}_{z}}{\text{d}t}=0.\end{eqnarray}$$
Reworking (2.5), (A 1) and (A 3), the particle transport equation becomes:
 $$\begin{eqnarray}\displaystyle & \displaystyle \frac{\text{d}v_{p,\unicode[STIX]{x1D703}}}{\text{d}t}=\sum f_{\unicode[STIX]{x1D703}}-\frac{v_{p,\unicode[STIX]{x1D703}}v_{p,r}}{r}, & \displaystyle\end{eqnarray}$$
 $$\begin{eqnarray}\displaystyle & \displaystyle \frac{\text{d}v_{p,r}}{\text{d}t}=\sum f_{r}+\frac{v_{p,\unicode[STIX]{x1D703}}^{2}}{r}, & \displaystyle\end{eqnarray}$$
 $$\begin{eqnarray}\displaystyle & \displaystyle \frac{\text{d}v_{p,z}}{\text{d}t}=\sum f_{z}, & \displaystyle\end{eqnarray}$$
where
 $f_{\unicode[STIX]{x1D703}}$
,
 $f_{r}$
and
 $f_{z}$
are the azimuthal, radial and wall-normal components of the external forces acting on the particle, respectively; term
 $v_{p,\unicode[STIX]{x1D703}}v_{p,r}/r$
is the force arising from the conservation of the angular momentum and term
 $v_{p,\unicode[STIX]{x1D703}}^{2}/r$
is the centrifugal force.