Anxiety disorders are one of the main diagnostic categories of psychological disorders due to their high prevelance in the general population, and the high frequency with which people seek primary or specialized care to treat them (Barlow, Reference Barlow2002; Goldberg & Huxley, Reference Goldberg and Huxley1990; Haro et al., Reference Haro, Palacín, Vilagut, Martínez, Bernal and Luque2006; Sartorius, Üstün, Lecubrier, & Wittchen, Reference Sartorius, Üstün, Lecrubier and Wittchen1996). Furthermore, anxiety symptoms are early psychopathological manifestations of other disorders, and are often comorbid with them (depression, psychosis, personality disorders, etc.), so availability of instruments to adequately assess the profile and severity of anxiety symptoms is absolutely crucial.
One of the most widely utilized instruments to assess anxiety disorders is the Beck Anxiety Inventory (BAI) (Beck, Epstein, Brown, & Steer, Reference Beck, Epstein, Brown and Steer1988). Its use is widespread; it has been translated into several languages and an array of studies has explored its psychometric properties (Borden, Peterson, & Jackson, Reference Borden, Peterson and Jackson1991; De Ayala, Vonderharr Carlson, & Kim, Reference De Ayala, Vonderharr-Carlson and Kim2005; Fydrich, Reference Fydrich1992; Hewitt & Norton, Reference Hewitt and Norton1993; Kabacoff, Segal, Hersen, & Van Hasselt, Reference Kabacoff, Segal, Hersen and Hasselt1997; Osman et al., Reference Osman, Hoffman, Barrios, Kopper, Breitenstein and Hahn2002; Sica & Ghisi, Reference Sica, Ghisi and Lange2007; Wetherell & Areán, Reference Wetherell and Areán1997). Studies have confirmed its reliability and validity, notwithstanding contraversy about its factor structure (Creamer, Foran, & Bell, Reference Creamer, Foran and Bell1995; Osman, Kopper, Barrios, Osman, & Wade, Reference Osman, Kopper, Barrios, Osman and Wade1997; Osman et al., Reference Osman, Hoffman, Barrios, Kopper, Breitenstein and Hahn2002; Saemundsson et al., Reference Saemundsson, Pórsdóttir, Kristjánsdóttir, Ölason, Smári and Sigurösson2011), discriminant validity (de Beurs, Wilson, Cahmbless, Goldstein, & Feske, 1997; Stulz & Crits-Christoph, Reference Stulz and Crits-Christoph2010), and possible use as a tool to screen for anxiety disorders (Leyfer, Ruberg, & Woodruff-Borden, Reference Leyfer, Ruberg and Woodruff-Borden2006; Magán, Sanz, & García-Vera, Reference Magán, Sanz and García-Vera2008).
In Spain, however, data on the BAI’s psychometric characteristics remain limited. To date, researchers have reported on its properties in university students (Sanz & Navarro, Reference Sanz and Navarro2003), the general population (Magán et al., Reference Magán, Sanz and García-Vera2008), and, though it was specifically designed for clinical populations, only quite recently (Beck & Steer, Reference Beck and Steer2011; Sanz, Garcia-Vera, & Fortún, Reference Sanz, García-Vera and Fortun2012) in a clinical sample. Limited sample size, lack of convergent validity data, and the need to replicate past studies in clinical populations all make it advisable to conduct new research in order to expand our knowledge of this instrument’s psychometric characteristics.
The present study aims to contribute information about the scale’s reliability and validity, and normative data in a clinical population, specifically outpatients in treatment at a community mental health center.
Method
Participants
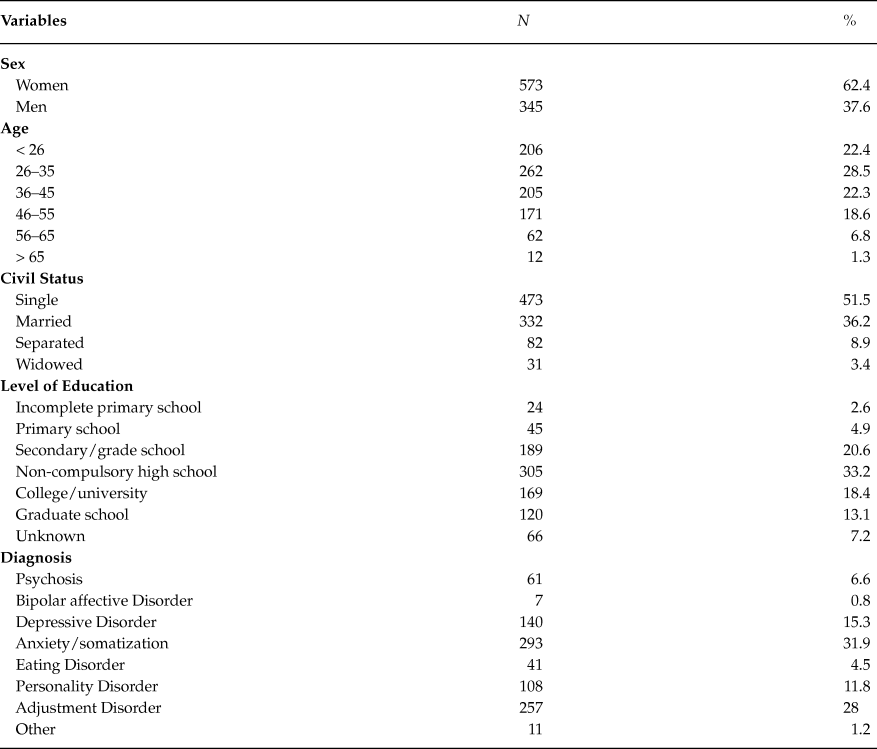
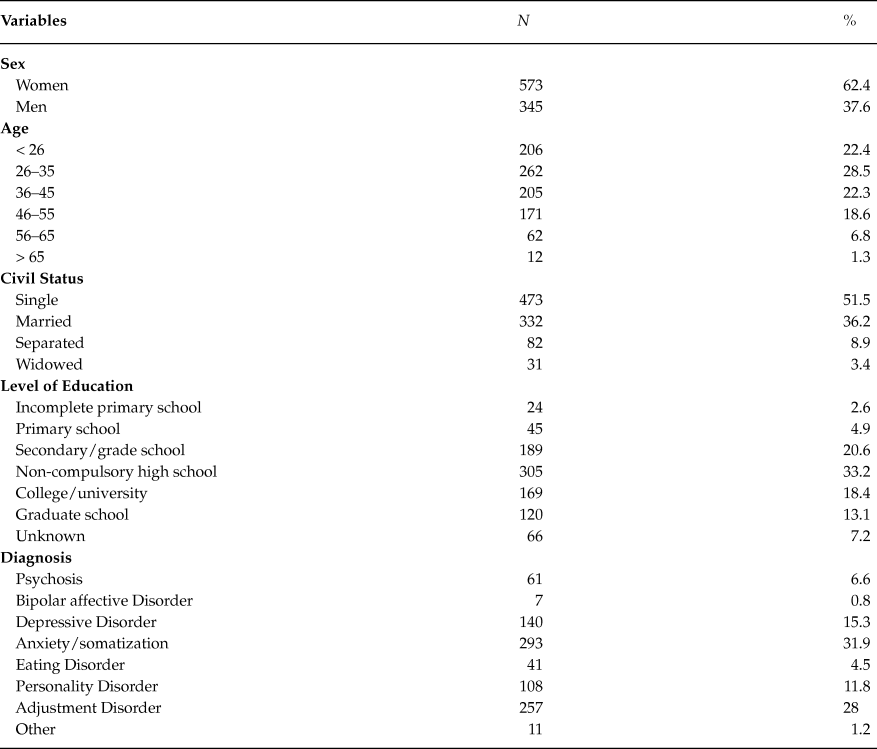
Nine hundred eighteen patients receiving treatment at a community mental health center participated. Their average age was 36.69 years (SD = 12.67; Range = 15–74). Other sociodemographic data appear in Table 1.
Sociodemographic Information. N = 918
Instruments
Beck Anxiety Inventory (Beck et al., Reference Beck, Epstein, Brown and Steer1988)
This scale’s 21 items describe the most typical symptoms of anxiety disorders. It was developed to measure the intensity of anxiety symptoms in clinical populations. It asks respondents to indicate how much they have been affected by each symptom during the last week, on a scale from 0 (Not at all) to 3 (Severely – I could barely stand it). Total scores are the sum of all item scores, and range from 0 to 63; higher scores indicate higher anxiety. When this instrument was developed, the goal was to more easily discriminate between anxiety disorders and depressive disorders, whose symptoms frequently overlap on other assessment tools.
Psychometric studies of the BAI have reported an adequate test-retest reliability coefficient (r = .75) at an interval of one week, and high internal consistency, with alpha coefficients ranging from .90 to .94 in clinical populations (Beck et al., Reference Beck, Epstein, Brown and Steer1988; Beck & Steer, Reference Beck and Steer2011; Fydrich, Reference Fydrich1992). They have also yielded satisfactory coefficients of convergent and discriminant validity (Beck, Reference Beck1991; Fydrich, Reference Fydrich1992).
Studies conducted in Spain among university students (Sanz & Navarro, Reference Sanz and Navarro2003), the general population (Magán et al., Reference Magán, Sanz and García-Vera2008), and in clinical samples (Sanz et al., Reference Sanz, García-Vera and Fortun2012) have likewise reported that the BAI has satisfactory psychometric properties.
The present study employed a translation of the BAI from 1990. The following procedure was followed to create it: two professional psychologists with knowledge of the English language translated it independently of one another. The two translations were compared and any differences between them rectified. This gave way to a single translation that was administered to 15 patients, the goal being to identify potential difficulty understanding the items. After correcting minor details, a final version was created; that version was utilized in the present study.
Comparing this translation to the recent, official Spanish version, it is important to point out that they scarcely differ. Of the BAI’s 21 items, 16 were translated identically, except that in this version, the clarification “sonrojarse” [“flush”] is added to item 20 in parentheses, whereas the official Spanish version adds “sonrojarse, ponerse colorado” [“flush, turn red”] in parentheses. Of the other 5 items, four differ insignificantly in how certain terms are translated: “adormecimiento” [falling asleep, as in a limb] / ”entumecimiento” [numbness] (item 1), “flojedad” [wobbliness] / ”debilidad” [weakness] (item 3), “aceleración del corazón” [heart racing] / ”taquicardia” [tachycardia] (item 7), “en todo el cuerpo” [all over my body] / ”generalizado” [generalized] (item 13), referring to the present study’s translation and the official version, respectively. The translation used in the present study also adds to item 3 the clarification “pies de goma” [rubbery feet], and the expression “sobresaltado” [startled] to item 17, which do not appear in the official version. Finally, how the second half of item 6 is translated (vértigo/aturdimiento [vertigo/confusion]) in the two versions differs significantly, so researchers should explore possible differences in item 6’s behavior from one study to the next.
Instructions for completing the scale are almost identical in the two versions, but note the following differences: a) In this study, “indicate how much you have been bothered” is translated “indique el grado de molestia,” whereas the official translation reads “indique el grado en que se ha visto afectado” [affected]; b) Like in the present study, in the first samples it anayzed, the official adaptation ommitted a clarification from the original English version – “including today” – to avoid confusion; ultimately, though, the authors chose to include it, probably so results could more easily be compared internationally; and c) The term “severely” is translated “severamente” here, whereas in the official version, it is translated “gravemente” [seriously].
Symptom Checklist-90-Revised – SCL-90-R – (Derogatis, Reference Derogatis1977)
This self-report scale is comprised of 90 items, with content covering various manifestations of psychopathology. Each item is scored on a scale from 0 to 4 (0 = not at all, 1 = a little bit, 2 = moderately, 3 = quite a bit, 4 = extremely) according to how much the respondent has experienced each one in the week before the test. The results generate a symptom profile and three indices of overall discomfort. It assesses the following nine dimensions: Somatization, Obsessive-compulsive, Interpersonal Sensitivity, Depression, Anxiety, Hostility, Phobic Anxiety, Paranoid Ideation, Psychoticism, and an Additional category. We utilized a Spanish adaptation by González de Rivera, de las Cuevas, Rodríguez Abuín, and Rodríguez Pulido (Reference González de Rivera, de las Cuevas, Rodríguez Abuín and Rodríguez Pulido2002). Its internal consistency in the sample those authors used indicated high reliability, with a Cronbach’s alpha of .94 for the test’s 90 items. Cronbach’s alpha for the subscales Somatization (.82), Obsession (.79), Anxiety (.67), and Phobia (.82) indicate adequate reliability as well.
Anxious Thoughts Inventory–AnTI- (Wells, Reference Wells1994, Reference Wells2000)
This is a multidimensional measure made up of 22 items and three dimensions. It taps the content and process of worrying: Social Worry, Health Worry, and Meta-worry. Each item is scored on a scale from 1 (almost never) to 4 (almost always). This generates a total score – the sum of all item scores – and three dimension scores.
Psychometric studies of the original version in English have reported very satisfactory reliability and validity measures. Here we utilized a Spanish adaptation (Vázquez Morejón, Jiménez García, & Vázquez-Morejón Jiménez, Reference Vázquez Morejón, Jiménez García-Bóveda and Vázquez-Morejón Jiménez2007) with equally good psychometric properties. Its internal consistency in the sample its authors utilized indicated high reliability, with an alpha coefficient of .89 for its 22 items. By the same token, alpha values each of the subscales, Social Worry (.81), Health Worry (.85), and Meta-worry (.82) are also indicative of high reliability.
Procedure
Between 2002 and 2005, at their first appointment at the Community Mental Health Center at Virgen del Rocío Hospital in Sevilla, Spain, in addition to the scales typically used at intake assessment, one in five patients was also administered the Beck Anxiety Inventory. They were asked to fill out the scale at home and return it before their next scheduled appointment at the center.
Each participant was assessed by a clinical psychologist in an initial clinical interview lasting 45–60 minutes. It covered clinical history and a mental state exam. That information was used to arrive at a diagnosis according to ICD-10 criteria.
At their initial interview, the last 230 participants were administered the SCL-90-R and the Anxious Thoughts Inventory (AnTI) together, always following the same procedure. However, only the data from 207 respondents (SCL-90-R) and 219 respondents (AnTI) were ultimately included. We excluded the remaining participants’ data because they either failed to return a scale, or to complete it.
Of the 230 patients, 50 were selected at random and in a second interview 8–10 weeks later, were asked to complete the BAI a second time. We explained that the reason for administering it again was to study the test’s reliability, and informed them that participation was completely voluntary. Ultimately only 48 of those participants’ data could be used, because the other 2 did not answer all items.
Now that all tests had been administered, we proceeded to analyze the data using SPSS version 15, along with sociodemographic variables and diagnoses taken from the mental health provider’s database.
The scale’s internal consistency was determined using Cronbach’s alpha coefficient. Item-total correlations were computed for each item as well.
Pearson’s r correlation was used to analyze test-retest reliability and convergent validity. In the case of convergent validity, the correlation between BAI scores and their corresponding AnTI and SCL-90-R scores (dimensions related to anxiety: somatization, obsession, anxiety, and phobic anxiety) were analyzed.
To explore the BAI’s factor validity in this sample, principal axis factoring was conducted, following a similar methodology as the official Spanish adaptation did. First, we determined whether or not a first-order factor existed, then went on to test a solution with two symptom factors (somatic and affective-cognitive), applying promax oblique rotation to the two extracted factors.
To determine the instrument’s test-retest reliability and convergent validity, we used total BAI scores, and scores on its two dimensions (Somatic and Affective-cognitive). Those dimensions were confirmed through factor analysis as described above.
Finally, before determining this clinical population’s normative data, given several earlier studies’ findings in the general population (Magán et al., Reference Magán, Sanz and García-Vera2008), samples of university students (Borden et al., Reference Borden, Peterson and Jackson1991; Sanz & Navarro, Reference Sanz and Navarro2003), and clinical samples (Hewit & Norton, Reference Hewitt and Norton1993), we tested for differences in BAI scores according to sex, using Student’s t test for independent samples.
Results
Factor Validity
We used the Kaiser-Meyer-Olkin (KMO = .93) test and Bartlett’s test of sphericity (chi-squared = 7,211.90, p < .001) to establish sampling adequacy, then applied principal axis factoring to the matrix of correlations among the 21 items on the scale. At first, four factors were extracted with eigenvalues over one. The first factor, with an eigenvalue of 7.67, explained 36.53% of variance. It was followed at a considerable distance by 3 other factors explaining, with eigenvalues of 1.33, 1.21, and 1.12, 6.33%, 5.76%, and 5.35% of variance, respectively. On another note, our visual examination of Cattell’s scree plot suggested one anxiety factor, or two at the most.
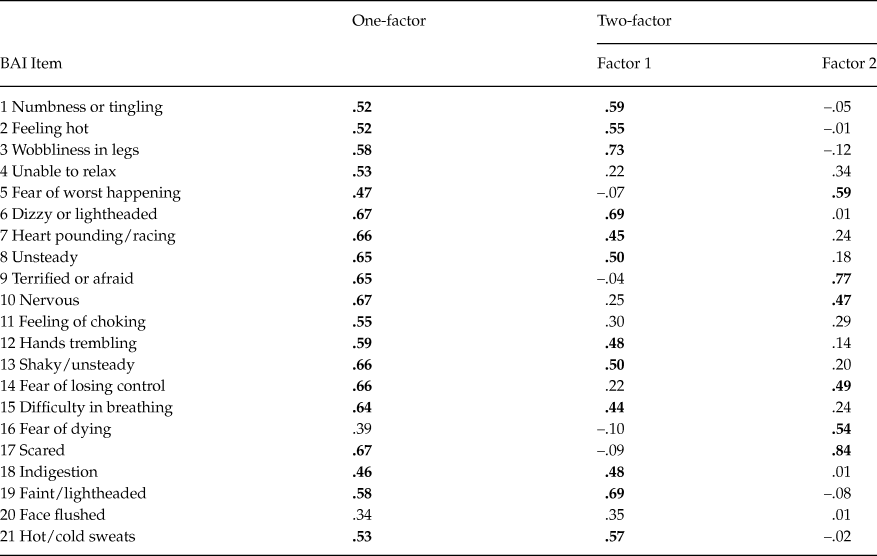
Those one- and two-factor solutions are displayed in Table 2. In the one-factor solution, all items’ factor loadings were well above .40 on their respective factors. The only exceptions were items 16 and 20, whose factor loadings were still relatively high: .39 and .34.
BAI Factor Analysis Through Principal Axis Factoring
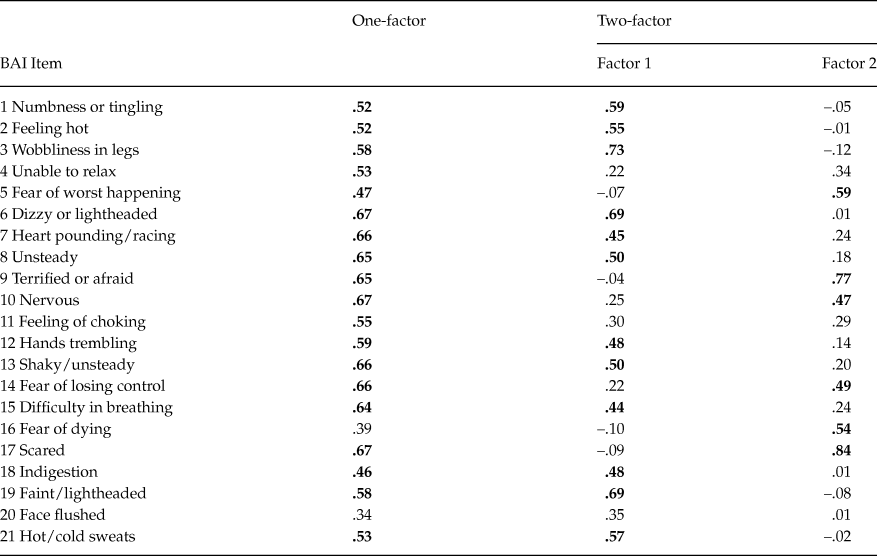
Factor loadings > .40 appear in bold.
Principal axis factoring with promax rotation for two factors revealed that the items loaded onto two factors that, given their content, are much like the ones Beck et al. (Reference Beck, Epstein, Brown and Steer1988) reported: somatic and subjective anxiety/panic.
All items in the first factor (1, 2, 3, 6, 7, 8, 11, 12, 13, 15, 18, 19, 20, and 21) had significant factor loadings (> .40) onto that factor, and negligible factor loadings (≤ .25) onto the second factor, except items 11 and 20. Item 11’s factor loadings were very similar for factors 1 (.30) and 2 (.29); and item 20 loaded slightly less (.35) onto the first factor. Likewise, all items included in the second factor (4, 5, 9, 10, 14, 16, and 17) loaded significantly (> .40) onto that factor, and neglegibly (≤ .25) onto the first, except item 4. Item 4 had a slightly lower factor loading (.34) onto Factor 1, where it was ultimately included.
The two factors together explained 42.86% of total variance. Scores on the two factors were highly correlated (r = .70).
Descriptive Statistics
The average total score on the BAI was 26.14 (s.d. = 13.82, range = 0–59). On its two dimensions, an average score of 15.55 (s.d. = 9.29, range = 0–40) was found for Somatic Symptoms, and of 10.60 for Cognitive Symptoms (s.d. = 5.63, range = 0–21).
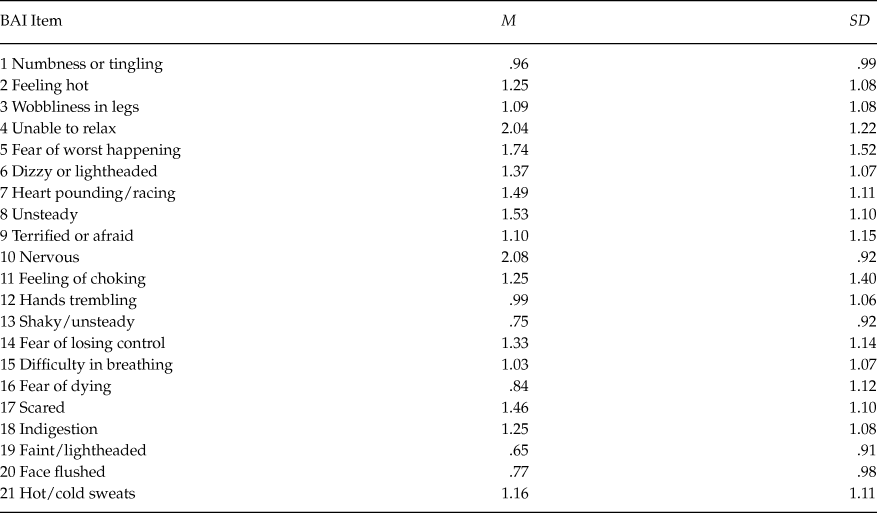
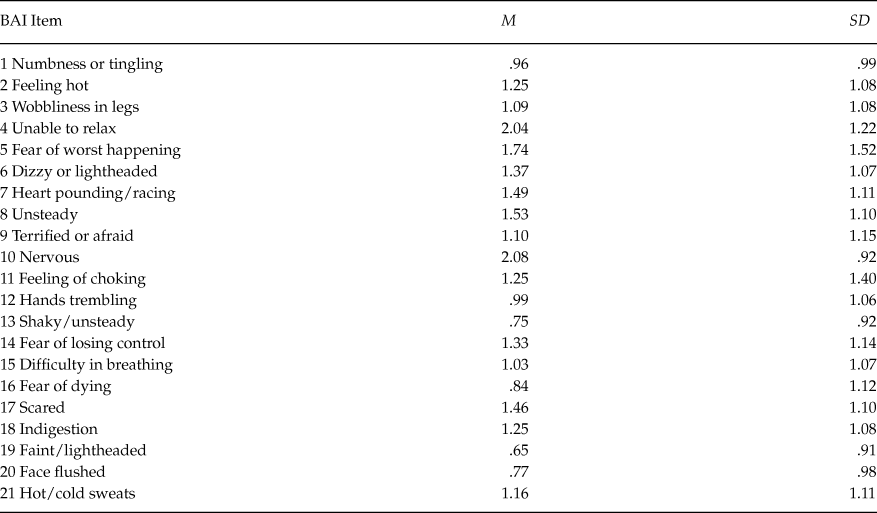
The items’ means and standard deviations appear in Table 3. Item 10, “nervous,” had the high score, and item 19 “Faint/lightheaded” the low score.
Means and Standard Deviations of All BAI Items
Normative Data
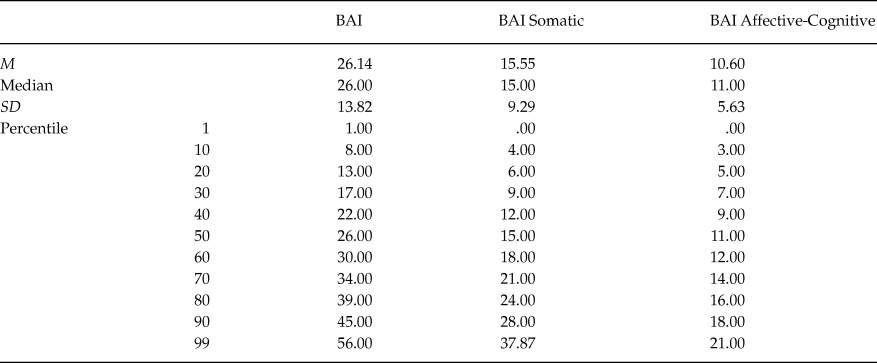
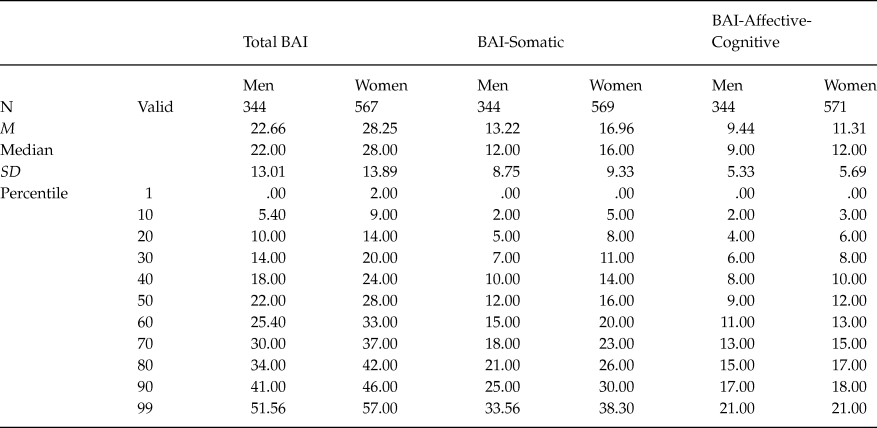
Table 4 presents the percentiles corresponding to total BAI scores, and scores on its somatic and cognitive dimensions.
BAI Score Means, Medians, Standard Deviations, and Percentiles. (N = 918)

Significant differences between men’s and women’s BAI scores were found, whether looking at total scores (t(908) = 6.03, p < .001) or Somatic (t(910) = 6.01, p < .001) and Cognitive (t(914) = 4.94, p < .001) dimension scores. Therefore, Table 5 presents average scores and percentiles for men and women separately. Women scored higher across the board.
BAI Score Means, Standard Deviations, and Percentiles by Sex

Reliability
Internal Consistency
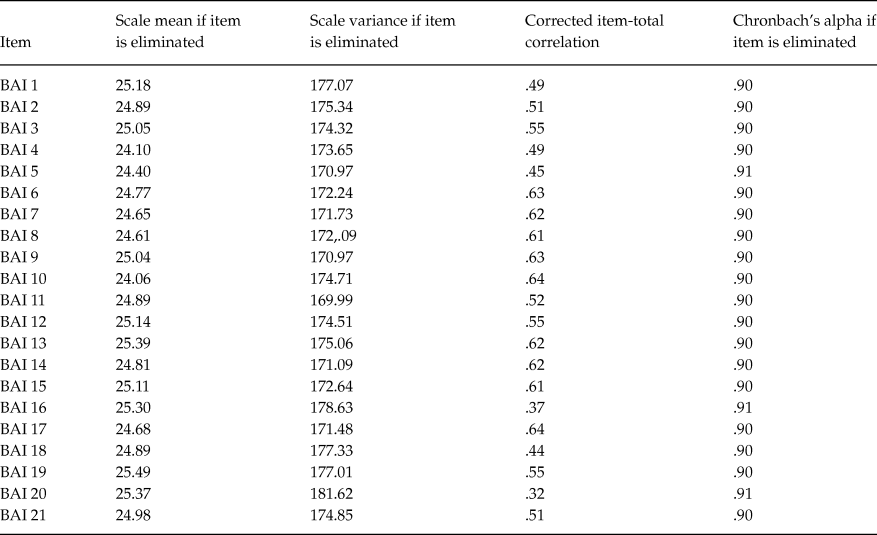
Cronbach’s alpha was very high for the overall scale (α = .91), somewhat higher than for the Somatic (α = .87) and Cognitive (α = .81) subscales.
Item-total correlations appear in Table 6, and ranged from .32 (item 20) to .64 (item 17).
BAI Item-total Statistics

Test-retest Reliability
We examined temporal reliability in 48 participants at an interval of 8–10 weeks. Total scores were found to be highly stable (r = .84). The mean BAI score the first time it was administered was 27.58 (SD = 13.83); the second time it was 26.79 (SD = 14.73).
Scores on the BAI’s two dimensions were also very stable (.85 and .77 for Somatic and Cognitive Symptoms, respectively). The mean scores on the Somatic dimension were 16.81 (SD = 9.70) and 15.79 (SD = 10.52) at T1 and T2, respectively. On the Cognitive dimension, they were 10.77 (SD = 5.07) and 11.00 (SD = 5.04), respectively.
Convergent Validity
The 207 participants’ total BAI scores were highly, significantly correlated (Table 7) with their scores on the SCL-90-R dimensions most directly related to anxious symptomatology: Somatization, Obsessive-compulsive, Anxiety, and Phobic Anxiety. The Anxiety and Somatization dimensions’ correlations were especially high.
Correlations between Scores on the BAI and on Anxiety Dimensions of the SCL-90-R. (N = 207)

** The correlation is significant to the level of 0.01 (two-tailed).
BAI dimension scores were also significantly correlated with scores on the SCL-90-R dimensions relating to anxiety. We observed that BAI-Somatic scores were highly correlated with SCL-90-R Somatization scores. Meanwhile, BAI-Cognitive scores were most highly correlated with the SCL-90-R Anxiety dimension.
As for the correlation between BAI and AnTI scores, for the 219 participants who were assessed using both, total BAI scores were substantially, significantly correlated (r = .57, p < .01) with total AnTI scores, and with scores on its dimensions: Social Worry (r = .46, p < .01), Health Worry (r = .37, p < .01), and Meta-worry (r = .55, p < .01).
Discussion
Generally speaking, these results confirmed the satisfactory psychometric properties of this Spanish version of the Beck Anxiety Inventory in a clinical Spanish population.
Beck (Reference Beck1991) proposed that BAI scores fall into four ranges. According to those ranges, this sample’s mean score (26.14) reflects moderate to severe anxiety, which is to be expected in a clinical population. It is similar to the means Fydrich (Reference Fydrich1992) and Beck et al. (Reference Beck, Epstein, Brown and Steer1988) reported in clinical populations with anxiety disorders: 23.9 and 25.8, respectively. Moreover, it is far from the means that Sanz and Navarro (Reference Sanz and Navarro2003) reported in a population of university students (9.6), and Magán et al. (Reference Magán, Sanz and García-Vera2008) reported in the general population (11.2). Nevertheless, this score is somewhat higher than the one obtained (18.9) in the official Spanish adaptation (Beck & Steer, Reference Beck and Steer2011), and the mean (18.3) Sanz et al. (Reference Sanz, García-Vera and Fortun2012) referred to in their review of eight studies conducted in patients with various psychological disorders. The reason participants scored higher, on average, in this study could be the sample’s composition: these patients were all selected from the primary mental health care system. This entails that: 1) their cases were beyond the scope of basic primary care, so from the outset, their symptoms must be more severe; and 2) they did not respond to initial treatment in basic primary care, so their mental illness is more chronic and/or complex. Also bear in mind the sample’s distinctive composition in terms of diagnostic groups. The present study found a higher incidence of personality disorders and psychotic disorders than in the clinical samples used in creating the official Spanish adaptation. That, too, could explain the sample’s somewhat higher average score, reflective of more severe anxiety symptomatology in this population.
Average item scores ranged from .65 to 2.08, with the highest scores on items 10 (“nervous”), 4 (“unable to relax”), and 5 (“fear of worst happening”). That order is consistent with other studies’ findings (Beck et al., Reference Beck, Epstein, Brown and Steer1988; Creamer et al., Reference Creamer, Foran and Bell1995; Osman et al., Reference Osman, Kopper, Barrios, Osman and Wade1997; Sanz & Navarro, Reference Sanz and Navarro2003; Sanz et al., Reference Sanz, García-Vera and Fortun2012).
An in-depth analysis of the inventory’s psychometric characteristics revealed that its internal consistency, with an alpha of .91, was very similar to what (∝ = .92) Beck et al. reported in their original study (1988), as well as what was reported in several studies in the general population (Magán et al., Reference Magán, Sanz and García-Vera2008), university students (Sanz & Navarro, Reference Sanz and Navarro2003), and in other clinical samples (Beck & Steer, Reference Beck and Steer2011; Fydrich, Reference Fydrich1992; Hewitt & Norton, Reference Hewitt and Norton1993; Sanz et al., Reference Sanz, García-Vera and Fortun2012), where alpha coefficients ranged from .88 to .94.
By the same token, the item-total correlations we observed, ranging from .32 (item 20) to .64 (item 17), all exceeded the minimum proposed by Nunnally and Bernstein (Reference Nunnally and Bernstein1995), and were very similar to the correlation ranges Beck et al. (Reference Beck, Epstein, Brown and Steer1988) and Sanz and Navarro (Reference Sanz and Navarro2003) reported: .30 to .71, and .36 to .61, respectively. Item 20 (“face flushed”) had the lowest correlation (r = .37), which is consistent with Magán et al.’s results (2008). Those authors suggested that item be reexamined in the Spanish version, particularly how the symptom is translated; the expression may not be suitable for people with lower educational levels, so an alternate phrasing should be explored. The translation employed in the present study clarifies that item by including the expression “sonrojarse” [“flushed”] in parentheses. Nevertheless, either that clarification is not enough, or the item behaves differently for some other reason, because these results show a similarly low item-total correlation, although it did exceed the minimum standard described above.
Regarding factor structure, it is interesting that all items had significant factor loadings onto a single factor, ranging from .34 (item 20) to .67 (item 10) and supporting a one-factor solution. That finding is consistent with what was reported in a clinical sample when the official Spanish adaptation of the BAI was created. Those authors reported factor loadings between .34 (item 20) and .71 (item 10). The percentage of variance explained by the single factor was also quite similar in the two samples (36.5% and 35.1%, respectively).
To test a two-factor solution, conversely, factor loadings were computed following promax oblique rotation of the two extracted factors. In the results, we were able to identify two factors that, given their content, correspond to the ones several authors have found in clinical populations (Beck et al., Reference Beck, Epstein, Brown and Steer1988; Beck & Steer, Reference Beck and Steer2011; Hewitt & Norton, Reference Hewitt and Norton1993): a somatic dimension, and a cognitive-affective dimension. The two factors’ results were very similar to the official Spanish adaptation’s results in terms of composition and factor loadings, but basic differences were observed on two items: 4 and 8. In this study, item 4’s factor loadings were .22 onto Factor 1, and .34 onto Factor II. Thus, it was included in Factor II. However, in the official adaptation, those values were .35 and .32, so it was included by a narrow margin in Factor I. As for item 8, on the official adaptation, its factor loadings were .29 onto Factor I and .38 onto Factor II, so it was included in Factor II. Conversely, in the present study, those values were .50 and .18, so it was included in Factor I. Yet another difference was observed on item 11, though less pronounced. Using the official adaptation, it clearly loaded onto Factor I (.48), while in the present study, its factor loadings were very similar on factors I (.30) and II (.29). That being said, it was included in Factor I in both studies.
Hewitt and Norton (Reference Hewitt and Norton1993), also in a clinical, heterogeneous sample, obtained very similar results in terms of the composition of the two factors, with all items coinciding except 12 and 13. In their case, those two items ended up in Factor II even though they loaded almost identically onto the two factors. However, in both the present study and the official adaptation, they clearly loaded onto Factor I.
Item 6, as described in the Instruments section above, is the only item whose translation differed significantly from the official Spanish adaptation. Nevertheless, it loaded onto Factor II in both studies, and with similar values (.64 vs .69). There was no discernable difference in the item’s behavior in the two translations.
Furthermore, the two factors appear to be highly correlated. Very similar correlations were observed in the present study (r = .70) as in the official adaptation (r = .73), which supports a one-factor solution. Nevertheless, as indicated in the manual of the official Spanish adaptation of the BAI (Beck & Steer, Reference Beck and Steer2011), these two different factor solutions are not necessarily contradictory. They might instead reflect an overarching anxiety dimension (common factor) comprised of two symptomatic dimensions (somatic and affective-cognitive) that are highly correlated.
Regarding test-retest reliability over a period of 8–10 weeks, the correlation observed between total scores was remarkably high (r = .84), even higher than other authors have reported (Beck et al., Reference Beck, Epstein, Brown and Steer1988; Fydrich, Reference Fydrich1992; Osman et al., Reference Osman, Hoffman, Barrios, Kopper, Breitenstein and Hahn2002) after a one-week interval in clinical populations, between .71 and .75.
This high correlation between test and retest scores warrants consideration. First of all, the scale itself refers to a one-week period, but administering it over a longer interval would not necessarily diminish its reliability. Perhaps it could then reflect shifts in the state of a construct that is defined as variable and episodic.
Some explanation is needed for our relatively stable scores, compared to earlier research findings. To a large extent, these differences could be due to the characteristics of this particular sample. As we described above, we were referred to these patients by the Primary Care (PC) system. They were selected either because their anxiety profiles were more severe than PC (the first, most basic healthcare level) could take on, or because they were originally treated in PC and were referred for specialized Mental Health services, either because either they were unresponsive to treatment, or their symptoms worsened. Accordingly, these patients’ anxiety evolved over a longer period of time and a high percentage had undergone pharmacological therapy, which implies a waiting period between the first and second assessments, the purpose being to determine the patient’s response to initial treatment before starting additional treatment. Therefore, in contrast to Beck et al.’s (Reference Beck, Epstein, Brown and Steer1988) sample, which had direct access to treatment at a mental health center, these patients’ anxiety had been developing for longer, and/or was more severe. Those are common features of populations receiving specialized mental health services.
Convergent validity results indicated BAI scores were intensely, significantly correlated (r = .86) with scores on the SCL-90-R Anxiety dimension. That correlation was very close to the one (r = .81) reported in Steer & Ranieri, (Reference Steer and Ranieri1993), who also utilized the SCL-90-R Anxiety dimension. High correlations were also observed with the other SCL-90-R dimensions most closely linked to anxious symptomatology (Somatization, Obsessive-compulsive, and Phobic Anxiety), further evidence of the scale’s convergent validity.
Though to a lesser extent, BAI scores correlated substantially with AnTI scores. That correlation was very close to the .51 that Beck et al. (Reference Beck, Epstein, Brown and Steer1988) reported using the Hamilton Rating Scales for Anxiety, and the .56 Creamer et al. (Reference Creamer, Foran and Bell1995) found using the State-Trait Anxiety Inventory (STAI). This corroborates the BAI’s convergent validity.
The difference in correlation between BAI scores and scores on other anxiety scales could reflect higher or lower consistency in their composition. In that vein, some authors (Cox, Cohen, Direnfeld, & Swinson, Reference Cox, Cohen, Direnfeld and Swinson1996) have suggested that the BAI is limited by the range of symptoms it includes, which less often detect anxiety disorders other than Panic Disorders. In its attempt to discriminate clearly between anxiety and depression, it does not cover symptoms that may overlap with depression. However, some such symptoms are also part of other anxiety profiles, like Obsessive-Compulsive Disorder and Generalized Anxiety Disorder. Therefore it stands to reason that the BAI’s correlation with the AnTI was lower, in that the AnTI specifically assesses a basic component of Generalized Anxiety Disorder: worry.
In terms of this study’s limitations, one is the provisional nature of normative data. The sample utilized, while diverse enough and representative of the variety and severity of disorders treated on an outpatient basis in mental health centers, is by no means representative of the clinical Spanish population at large. Therefore, these data are no more than an approximation of normative findings.
While the Spanish version utilized was not translated through the most optimal methodology – back translation and item equivalence – it differs from the official Spanish translation only minimally. Furthermore, their similarity is probably due to characteristics of the items themselves, which aim to capture common symptoms in a brief, yet descriptive manner.
Despite these data’s goodness of fit to the proposed factor solutions, additional studies should be conducted, with new analyses, given the following: here we initially found four factors, and several other authors have reported the same (Beck, Reference Beck1991; Osman et al., Reference Osman, Kopper, Barrios, Osman and Wade1997); we observed differences between segregated samples of men and women to the extent that different factor structures were found according to sex (Osman et al., Reference Osman, Hoffman, Barrios, Kopper, Breitenstein and Hahn2002); and finally, it would be best for future studies to use more rigorous tests to identify optimal factor solutions (Ledesma & Valero-Mora, Reference Ledesma and Valero-Mora2007).
With respect to this study’s contributions to research on this scale, it would be interesting to corroborate this factor structure through Confirmatory Factor Analysis, as Sanz and Navarro (Reference Sanz and Navarro2003) suggest. Also, in light of differences that have been repeatedly observed as a function of sex (Beck & Steer, Reference Beck and Steer2011; Borden et al., Reference Borden, Peterson and Jackson1991; Hewit & Norton, Reference Hewitt and Norton1993; Magán et al., Reference Magán, Sanz and García-Vera2008; Sanz & Navarro, Reference Sanz and Navarro2003), research should explore the possible influence of sex on how people score on this scale, and on its factor structure.
Also in clinical Spanish populations, future studies should examine the scale’s convergent validity using other anxiety instruments, its validity in different diagnostic groups, and its sensitivity to change. To address those questions would encourage its use as an anxiety measure in treatment programs.
In summary, these results attest to the instrument’s validity and reliability at quickly and reliably assessing anxiety profiles and symptom severity in the clinical Spanish population.