Introduction
While one intuitively expects quality of life to decline in older age due to diminishing social resources, and declining cognitive and physical abilities, previous empirical studies reported a relative stability of quality of life over old age (Gwozdz and Sousa-Poza Reference Gwozdz and Sousa-Poza2010; Kunzmann, Little and Smith Reference Kunzmann, Little and Smith2000; Von dem Knesebeck et al. Reference Von dem Knesebeck, Wahrendorf, Hyde and Siegrist2007). Some attribute this stability to psycho-social adjustment mechanisms: over the process of ageing individuals would use social and temporal comparisons to interpret and cope with their progressively declining situation. Others emphasise the importance of social resources expected to influence lifecourse trajectories differently as successive cohorts grow old. Assessing these different perspectives requires disentangling age, cohort and period effects. In this paper, we examine the distribution and trajectories of life satisfaction (LS) among elderly women living in Switzerland, comparing specific age groups and cohorts.
Literature review
Quality of life among elderly people
Old age is a priori a vulnerable stage of the lifecourse: over that period, individuals are potentially more exposed to loss, isolation, and declining cognitive and physical abilities than younger age groups (Grundy Reference Grundy2006; Kunzmann, Little and Smith Reference Kunzmann, Little and Smith2000; Netuveli and Blane Reference Netuveli and Blane2008). Along this ‘paradigm of decline’ that used to predominate in gerontological research (Higgs et al. Reference Higgs, Hyde, Wiggins and Blane2003), theories of ‘disengagement’ and ‘structured dependency’ emphasised the marginalisation from society of retired people (Baltes and Lang Reference Baltes and Lang1997; Blane et al. Reference Blane, Higgs, Hyde and Wiggins2004). In this perspective, ageing is negative and old age is seen as a problem (Walker Reference Walker2005). Quality of life of elderly people is, therefore, expected to be low and measuring it of little interest.
Recent perspectives developed more positive images of ageing, as a response to increased longevity and the changing characteristics of the elderly. The distinction between a third age (‘young old’) and a fourth age (‘old old’) is emblematic of this shift (Baltes and Smith Reference Baltes and Smith2003; Blane et al. Reference Blane, Higgs, Hyde and Wiggins2004). Emphasising the benefits of economic, social and cultural transformations on the ‘young old’, notions of positive or successful ageing developed (Hambleton, Keeling and McKenzie Reference Hambleton, Keeling and McKenzie2009; Von dem Knesebeck et al. Reference Von dem Knesebeck, Wahrendorf, Hyde and Siegrist2007). This led to an increasing interest in the quality of life of elderly people (Zaninotto, Falaschetti and Sacker Reference Zaninotto, Falaschetti and Sacker2009).
Indeed, empirical research suggests that there is no age-related decline in quality of life among elderly people (Gwozdz and Sousa-Poza Reference Gwozdz and Sousa-Poza2010; Kunzmann, Little and Smith Reference Kunzmann, Little and Smith2000; Von dem Knesebeck et al. Reference Von dem Knesebeck, Wahrendorf, Hyde and Siegrist2007). The relative continuity of quality of life over old age has been associated with the ‘satisfaction paradox’ (Walker Reference Walker2005) or ‘response shift’ (Wilhelmson et al. Reference Wilhelmson, Andersson, Waern and Alleberck2005) which highlights the adaptation mechanisms used by individuals to review their own standards and values as their individual situation evolves. Psycho-social adjustment mechanisms, based on social and temporal comparisons, would allow individuals to cope with a progressively declining situation (Henchoz, Cavalli and Girardin Reference Henchoz, Cavalli and Girardin2008).
Traditionally, quality of life among elderly people was narrowly associated with health-related measures and assessed by professionals (Hambleton, Keeling and McKenzie Reference Hambleton, Keeling and McKenzie2009; Walker Reference Walker2005). However, it has been shown that quality of life measures are often inconsistent with objective parameters (Allison, Locker and Feine Reference Allison, Locker and Feine1997), e.g. declining LS was associated with low levels of self-assessed health but not with objective health measures (Gwozdz and Sousa-Poza Reference Gwozdz and Sousa-Poza2010). Furthermore, while ageing is encompassing a biological process of progressive decline, socio-economic factors are also expected to play an important role in quality of life trajectories. A range of quality of life determinants, including social participation, family and social support, activities, psycho-social and socio-economic circumstances (Grundy Reference Grundy2006; Netuveli et al. Reference Netuveli, Wiggins, Hildon, Montgomery and Blane2006; Von dem Knesebeck et al. Reference Von dem Knesebeck, Wahrendorf, Hyde and Siegrist2007; Walker Reference Walker2005; Wilhelmson et al. Reference Wilhelmson, Andersson, Waern and Alleberck2005; Zaninotto, Falaschetti and Sacker Reference Zaninotto, Falaschetti and Sacker2009) have been shown to affect LS.
Even though older women are disadvantaged compared to older men in several respects (lower socio-economic resources, worse health status, widowhood, etc.), the former report only slightly lower levels of wellbeing compared to the latter (Gaymu and Springer Reference Gaymu and Springer2010; Pinquart and Sörenson Reference Pinquart and Sörensen2001). This led to the assumption ‘that wellbeing models do not apply in the same way to older men and women, and that gender-specific models are needed’ (Gaymu and Springer Reference Gaymu and Springer2010: 1154). It has been suggested that their quality of life evaluations are influenced by specific dimensions, in particular social relationships would have a more significant impact on women's wellbeing (Bourque et al. Reference Bourque, Gold, Bonneville and Béland2005).
While social policy has recently highlighted the importance of elderly wellbeing, the complexity and limitations of the concept itself are rarely discussed. Criticising the emphasis on individual and objective measures, Barnes, Taylor and Ward (Reference Barnes, Taylor and Ward2013) suggest that it is important to take into account people's interpretations of wellbeing and their strategies to ‘be well’, considering how these interpretations and strategies are influenced by social circumstances and relationships, which provide specific resources patterns. These elements suggest that, based on specific expectations and contexts, individuals might report on LS in quite contrasted ways.
Quality of life dynamics
Research has often considered elderly people as an homogeneous category, foremost defined by its age (Kahn and Rowe Reference Kahn and Rowe1987; Walker Reference Walker2005). Old age has typically been seen as a distinct phase of the lifecourse disconnected from previous life stages. However, when they turn old, people convey with them the social positioning they experienced throughout their life. A lifecourse perspective takes into account ‘the changing contexts of lives and their consequences for human development and ageing’ (Elder and Kirkpatrick Johnson Reference Elder, Kirkpatrick Johnson and Settersten2003: 52). This perspective combines individual choices over time but also the social influences and constraints that shape opportunities (Elder and Kirkpatrick Johnson Reference Elder, Kirkpatrick Johnson and Settersten2003; Walker Reference Walker2005). Consequently, the quality of life dynamics should be observed at two different levels (Allison, Locker and Feine Reference Allison, Locker and Feine1997): as ‘within-subject change’, it refers to the evolution of the individual's quality of life over his or her lifecourse; as ‘between-subject difference’, it considers differences among social groups, but also among different birth cohorts who are born and age in specific social contexts. Such an approach allows changing expectations, at the social and individual levels, to be taken into account. In his analysis of the living conditions of successive cohorts, Chauvel (Reference Chauvel1998) emphasises how much members of the cohort born just after 1945 benefited from a very positive socio-economic context in their young age and as they entered the workforce in the late 1960s. By contrast, those belonging to previous cohorts, born in the period covering both wars, clearly had less favourable trajectories. These contrasted experiences are likely to affect their expectations in regards to old age, more specifically the rather low expectations of former cohorts' members could lead them to rate their lives as better than those belonging to more recent cohorts (Bowling 2004, cited in Walker Reference Walker2005).
Social trajectories of men and women who are now over 65 have been clearly differentiated. The environment in which they grew up defined specific opportunities in their adult life, with men endorsing the traditional role of breadwinners and women dedicating themselves to the family and domestic work (Bourque et al. Reference Bourque, Gold, Bonneville and Béland2005). Such gender differences in socialisation and adult life patterns are likely to produce distinct expectations in regard to wellbeing in later life (Della Giusta, Jewell and Kambhampati Reference Della Giusta, Jewell and Kambhampati2011). Adopting a lifecourse perspective thus confirms the importance of considering men's and women's experiences separately.
The Swiss context
Comparatively to other countries, the Swiss population benefits from good social conditions and a high life expectancy. In 2013, Switzerland came out first in the ranking of the World Economic Forum Human Capital Index, with high scores on the four pillars of the index (health, wellness, workforce and employment) (World Economic Forum 2013). The Organisation for Economic Co-operation and Development (OECD) Better Life Index confirms the high level of wellbeing in Switzerland, showing the highest LS score among OECD countries (on a scale of 0–10, 7.8 versus 6.6 on average in OECD countries).Footnote 1 However, social inequalities do exist in that context and indicators suggest that they tend to be increasing (Levy Reference Levy2010). In regard to the Esping-Andersen typology of welfare systems, the Swiss system can be considered as a mix of the conservative model (focused on the protection of work, generous regimes in terms of old age, unemployment and disability, a model which includes France and Germany) and the liberal model (emphasising the role of the private sector while limiting its help to the most poor people, as is the case in the United Kingdom and the United States) (Bertozzi, Bonoli and Gay-des-Combes Reference Bertozzi, Bonoli and Gay-des-Combes2008). The cohorts now aged over 65 have all experienced during most of their adult lives the benefits associated with the economic boom of the three decades following 1945. A recent analysis concluded that the financial situation of the elderly in Switzerland is fairly good, even though their income is lower than that of the working population (Wanner and Gabadinho Reference Wanner and Gabadinho2008). Furthermore, retired people benefit from important levels of wealth (higher than among those younger than 65). However, there also exist some groups of poor elderly, especially those receiving only the national retirement pension and having no professional pension.
Research questions and hypotheses
In this paper, we examine (a) the distribution of LS among elderly women living in Switzerland and the dynamics of their LS trajectories on age across cohorts and periods; and (b) the influence of social determinants on LS distribution and LS trajectories.
Confirming international observations, a recent Swiss report showed that in both the community-dwelling population and in institutions, elderly men are slightly more satisfied with life than elderly women (Zimmermann-Sloutskis, Moreau-Gruet and Zimmermann Reference Zimmermann-Sloutskis, Moreau-Gruet and Zimmermann2012). Knowing that men and women had differentiated lifecourse experiences that are likely to influence both their quality of life and its determinants in older age, we consider it necessary to analyse men and women separately. Rather than providing a gender analysis, comparing men and women, we choose here to focus on women only in order to document how their LS trajectories relate to specific determinants.
LS dynamics
From a lifecourse perspective, the study of LS must combine factors of change over time, at both the individual and social levels (Elder and Kirkpatrick Johnson Reference Elder, Kirkpatrick Johnson and Settersten2003). Differences observed in the comparison of age groups might not be solely attributable to individual ageing, but rather to differences across cohorts, associated with changing social conditions. Studies on quality of life are usually based on cross-sectional surveys, which do not allow these effects to be differentiated (Zaninotto, Falaschetti and Sacker Reference Zaninotto, Falaschetti and Sacker2009). To disentangle age, period and cohort effects, we compare here two age categories – the ‘young old’ (65–74 years) and the ‘old old’ (75–84 years) – and within each of these, two successive cohorts while controlling for period (calendar year).
In terms of LS distribution, we hypothesise that, within an identical age category, more recent cohorts of elderly women, who benefited more from the post-war economic boom and transformations of values, have higher expectations in regards to the retirement period, and especially over the third age part of the lifecourse. As a consequence, their satisfaction with life should be comparatively lower than that observed among women of identical age belonging to former cohorts.
We also analyse LS trajectories in a longitudinal perspective, looking at its evolution at the individual level over a ten-year period. In that respect, we hypothesise that LS should decrease progressively as women get older and encounter more difficult situations, in relationship to health and social integration in particular. We expect LS to decline faster among the older old due to poorer health. Besides, we assume that more recent cohorts have accumulated more resources to cope with changes in their individual situation and therefore they should present more stable evaluations of LS than members of former cohorts.
Determinants of LS
We expect higher education and socio-economic resources, better social integration (social support, living with a partner) and better health to be associated with higher LS. Differences can be expected across the two observed age categories, i.e. 65–74 and 75–84 years old; older women being more isolated and having fewer available resources should report lower LS. We also examine how these determinants affect LS trajectories, hypothesising that economically and socially advantaged women remain more satisfied with life over time than disadvantaged women.
Method and analysis
Sample selection
The analysis was conducted with the data of the Swiss Household Panel (SHP). This longitudinal data collection started in 1999 with the aim of observing social change, in particular the dynamics of living conditions within the Swiss population (www.swisspanel.ch) (Zimmermann and Budowski Reference Zimmermann, Budowski, Joye, Renschler and Hainard2003; Zimmermann and Tillmann Reference Zimmermann and Tillmann2004). Based on an initial random sample of private households living in Switzerland, all household members, aged 14 and over, are interviewed each year through a computer-assisted telephone interviewing procedure. The initial sample was composed of 5,074 households and 12,931 individuals. In 2004, a complementary sample of 2,538 households and 6,569 individuals was added. The total number of individuals enrolled between 1999 and 2010 is 15,507 (82,146 observations).
Since LS was not recorded in the first SHP wave (1999), we included observations from the 2000–2010 waves. We selected a sub-sample of 1,402 women aged 65–84 years (mean age=69.8±5.5), generating 6,387 observations. The exclusion of those women older than 85 years was motivated by their limited number in the SHP (4% of those over 65) which included only people living at home. In Switzerland, people over 85 years represent 6.5 per cent of the population over 65, among them 27.9 per cent are in institutions (nursing homes) (Höpflinger, Bayer-Oglesby and Zumbrunn Reference Höpflinger, Bayer-Oglesby and Zumbrunn2011).
Out of the 1,402 selected women, 579 entered the survey between ages 54 and 64 years, that is before the age of interest here, but they were included in the analysis when they turned 65. The average participation was 6.6±3.1 waves. Data have been weighted by yearly transversal weights to represent the general population of elderly women at each calendar year.
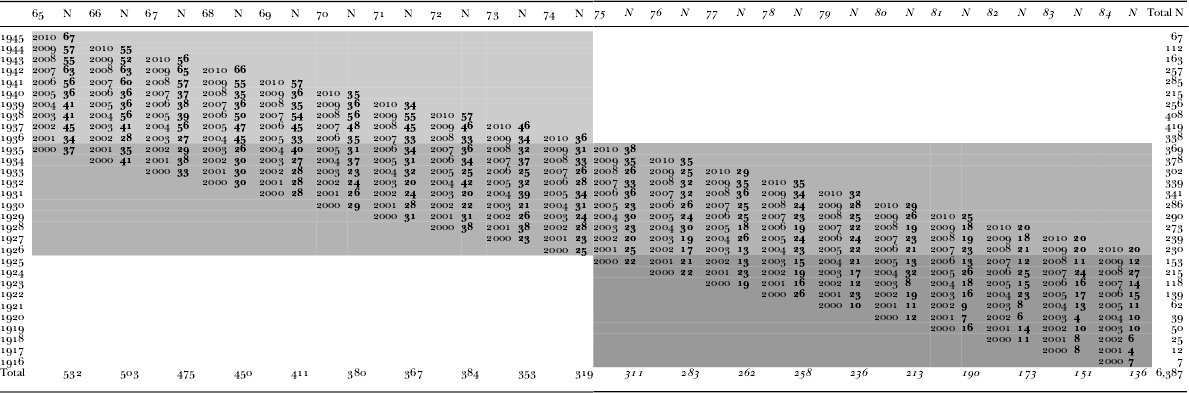
Table 1 presents the number of observations (N=6,387) in the form of an age, period and cohort table with cohorts in rows, ages in columns and periods (year of observation by survey) along diagonals. The three ten-year cohorts are highlighted by corresponding shaded patterns and the two age categories of the ‘young old’ (65–74 years) and the ‘old old’ (75–84 years) are in different fonts (regular and italic). The middle cohort (1926–1935) followed over the full observed age range (65–84) has been divided into two age categories: the 65–74 age range is compared with the more recent cohort (born 1936–1945) and the 75–84 age range with the former one (born 1916–1925). This means that some people were observed twice, once in the 65–74 years age category and once, as they got older, in the 75–84 years category. Respondents followed for a longer period over a larger age span may introduce a selection bias, since healthier and more educated individuals are better compliers in the SHP survey (Zimmermann Reference Zimmermann2008). To assess this bias, we compared the mean LS score and the proportion of satisfied women of the 1926–1935 cohort aged 75–84 years at the end of their trajectory (N=313) and who had entered the study before the age of 75 years, with the newcomers who entered the study after the age of 75 years (N=78). Since the difference was not significant, we considered that taking together ages 75–84 years of the cohort 1926–1935, whether subjects were followed for longer or only since the age of 75, did not represent a selection bias.
Age, period and cohort table matrix for the Swiss Household Panel 2000–2010, sub-sample of women aged 65–84 years

Notes: The table presents birth years (cohort) as rows, age as columns and periods (year of observation by survey) along the diagonals. The three ten-year cohorts are highlighted by corresponding shaded patterns and the two age categories of the ‘young old’ (65–74 years) and the ‘old old’ (75–84 years) are in different fonts (regular and italic). Bold numbers are the N values.
Outcome (dependent variable)
The degree of LS in general was considered here as a proxy measure for quality of life. The question was ‘In general, how satisfied are you with your life if zero means “not at all satisfied” and ten means “completely satisfied”?’ LS was analysed either on a continuous scale or grouped into a binary dummy variable defining high satisfaction as ‘1’ for score values 9–10 and fair or poor satisfaction as ‘0’ for scores 0–8. Distribution and prevalence of LS were reported. LS trajectories were estimated as the individual mean scores over one year of age.
Selected covariates (explanatory variables)
The following social determinants were selected: education and satisfaction with income (socio-economic resources); social support and living with a partner (social integration) and self-perceived health. These indicators are all self-reported. Birth year was used to define cohort affiliation. Birth year (B) and age (A) implicitly define the calendar wave of the study, namely the period (P) (P=B + A) (Table 1). The educational level was reported as the highest education achieved. Compulsory or vocational levels were considered in the analyses as lower education, while maturity and high school or apprenticeship and vocational high or academic as higher education. Satisfaction with the household income was reported on a 0–10 score where zero means completely unsatisfied and ten satisfied. Satisfied was considered as a score of 8–10 and unsatisfied associated with lower values. Satisfaction with household income was considered as a better measure than income itself: first, data on household income was not available for about 10 per cent of participants; second, income itself provides only a rough evaluation of the economic situation during retirement since it does not include the wealth accumulated over the life time. Social support was reported on a 0–10 scale with five psychological support items and five practical support items from partner, relatives, neighbours, friends or colleagues. A mean individual social support score was computed at each period and dichotomised into 5.5–10 for high social support and 0–5.4 for low social support. Self-perceived health was reported as an ordinal five categories scale and dichotomised into excellent and very good (good) versus fair, moderate or poor (poor). Most covariates are time-variant (self-perceived health, social support, satisfaction with income, living with a partner). We considered all the above time-variant covariates as exogenous, namely that each one of them influences later LS score but that LS score does not influence future covariates. Birth year and the highest education level achieved are time-invariant. Period and age are time-variant but fixed by the study design. Age was chosen as a metric for time because our main interest was the ageing process. Two age categories were defined, 65–74 and 75–84 years, and centred to 65 or 75 years, respectively, to get interpretable satisfaction scores at the intercept.
Statistical analysis
LS score distribution is presented as a density function for all women aged 65–84 years between 2000 and 2010, for two age categories (65–74 and 75–84 years) and for three ten-year cohorts (1936–1945, 1926–1935, 1916–1925). For cross-sectional cohort differences, we compared the prevalence (percentage) of satisfied individuals and the prevalence of determinants between successive cohorts of identical age categories. The association between LS and each binomial explanatory variable across the cohorts within two identical age categories was estimated in terms of odds ratios (OR) and their 95 per cent confidence intervals (95% CI). All covariates were dichotomised into ‘1’ for a positive value (high education, satisfaction with household income, high social support, living with a partner and good self-perceived health) and ‘0’ for their corresponding unfavourable value. A high probability of satisfaction for a favourable predictor is expected to result in an OR above one. The generalised estimating equation with conservative standard errors for inference, provided that individual observations are repeated over time, was used. The interpretation of the logistic marginal regression estimates represents the association between a change in the binary LS outcome and a change in the covariate at the population level. We used the SAS Proc Genmod procedure under the assumption of a constant within-subjects OR (logor=exchangeable) for the variable ‘cohort’ (time-invariant) but an independent correlation structure for all time-variant predictors (type=independent) (Diggle et al. Reference Diggle, Heagerty, Liang and Zeger2002) (Table 2).
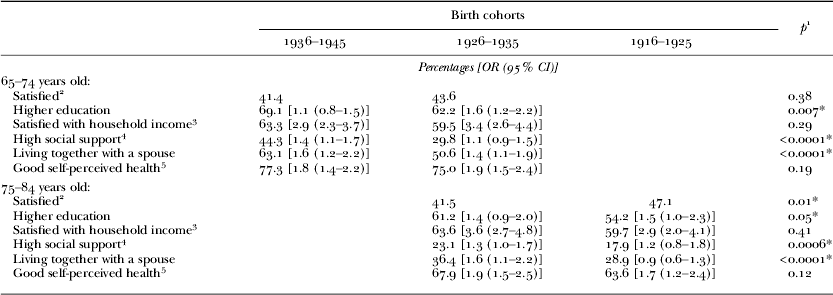
Life satisfaction and social determinants: prevalence (percentage) of covariates by cohorts for the two age categories and odds ratios (OR) with 95 per cent confidence intervals (95% CI) for the probability of being satisfied for each covariate using the generalised estimating equation model with robust standard errors under the assumption of independent correlation structure (for time-variant covariates)
Notes: 1. Value with conservative standard errors (SAS Proc Genmod procedure). 2. Score 9–10 versus 0–8. 3. Score 8–10 versus 0–7. 4. Mean individual score 5.5–10 versus 0–5.4 of ten items of social support. 5. Excellent and very good versus fair, poor and very poor.
Significance level: * p<0.05.
Patterns of LS trajectory as a continuous scale across cohorts of identical age were estimated using (a) the multi-level mixed-unconditional mean model with no covariates in level 1 model and a random intercept for assessing the amount of between subjects variation, and (b) the multi-level mixed-growth model in which we added in level 1 the variable ‘age’, dummies for ‘cohorts’ and ‘age by cohort’ interaction. The unconditional multi-level mixed-mean model was used to separate the amount of variability due to within- (level 1) or to between-subjects (level 2), and was reported as the intra-class correlation coefficient (ρ). The mixed-growth model assessed the intra-individual variability explained by ageing (within-variance) in each cohort and the inter-individual heterogeneity in the intercept and slope (Singer and Willett Reference Singer and Willett2003).
We explored the effect of each covariate on the individual LS trajectory (slope) stratified by age and cohort categories. When the LS slope differed across the levels of the covariate, we tested the interaction term (age by covariate).
Finally, we applied a hierarchical age–period–cohort (HAPC) mixed model with age and cohort as two dummies and all dichotomous covariates as fixed, and subjects and period as random. Adding period as random permitted the age, cohort and period exact linear dependency to be overcome and allowed the unobserved within-subjects heterogeneity to be assessed (Yang and Land Reference Yang and Land2008; Zheng, Yang and Land Reference Zheng, Yang and Land2011). Covariates were added first one by one and then all together. Interactions between covariates and age were assessed and introduced to the full model if they were significant. Estimates indicate the effect of age (ageing) or one or all covariates on LS adjusted for the others.
We hypothesised that LS would vary as individuals get older (within-variance), and that individuals from different cohorts may experience different ageing patterns due to their lifecourse experiences through different periods in a changing society (between variance). Along these hypotheses, we expect former cohorts (less educated and more exposed to cumulative social strains during childhood or early adulthood) to have a higher intercept and a greater decline over age (individuals who are less demanding but less adaptive to harder situations when affected by declining health or social resources in older age). We also expect more recent cohorts to be less satisfied at baseline but probably more adaptive due to their higher education and social status, and therefore to present a lower intercept and a flat LS trajectory over ageing.
All the statistical analyses were carried out using SAS software version 9.2.
Results
LS levels and trajectories of LS
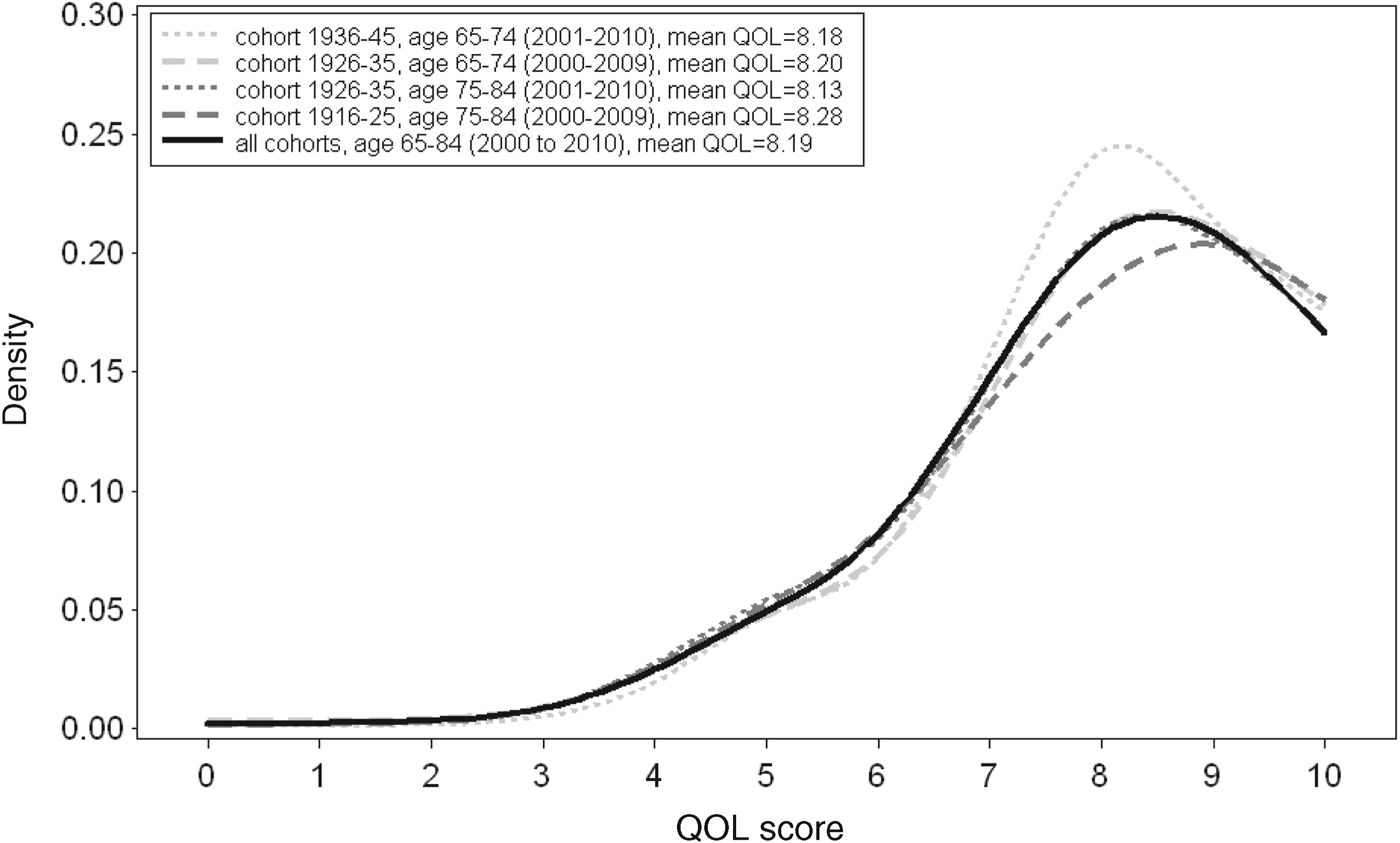
The LS score distribution is left skewed (−1.2) with a median at 8 and an overall mean of 8.2±1.6; 8 per cent of participants had a score below 5. Among the ‘young old’ (65–74 years), the mean LS score does not significantly vary across cohorts (8.2±1.6, p=0.61). Among the ‘old old’ (75–84 years), women from the former cohort (born between 1916 and 1925) are slightly more satisfied (8.3±1.7) than those belonging to the more recent cohort (1926–1935) (8.1±1.7, p=0.10) (Figure 1). Accordingly, the proportions of satisfied subjects are higher in former cohorts, significantly among those 75–84 years old (47.1% versus 41.5%, p=0.001), but not significantly in those aged 65–74 years (43.6% versus 41.4%, p=0.4) (Table 2). Overall, elderly women living in Switzerland are rather satisfied with their life.
Life satisfaction score density distribution, by age categories (65–74 and 75–84 years) and birth cohorts, Swiss Household Panel 2000–2010, women 65–84 years.
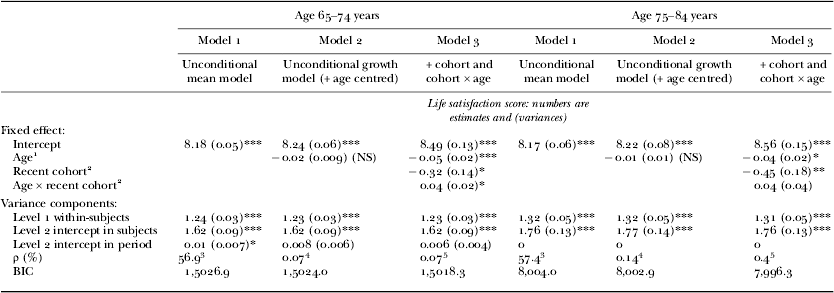
The unconditional mean model shows that, in both age categories, a great deal of the total variance (57%) is due to between-subjects variation (Table 3, Model 1). In the growth model with age centred at the youngest age in each age group (65 or 75 years), the estimate for age (adjusted for the mean period) is slightly negative, but not significant, within both age categories. The part of within-individual variance due to age is very small (about 1%) and not significant in both age categories (Table 3, Model 2). However, after introducing the dummies for cohort, recent cohorts are significantly less satisfied with life in both age categories. In both the ‘young old’ and the ‘old old’, LS scores are significantly lower for the more recent cohorts (1936–1945 versus 1926–1935 and 1926–1935 versus 1916–1925) by about −0.3 or −0.5 LS score units, respectively. At the same time, earlier cohorts show a significant decline of LS with age (around −0.05 per year, p<0.001) (Table 3, Model 3), indicating that the LS decline with age is cohort specific (Figure 2).
Life satisfaction trajectories on age by birth cohort, Swiss Household Panel 2000–2010, women 65–84 years.
Estimates from a mixed unconditional mean model, unconditional growth model and controlled for cohort model of life satisfaction, by age categories net of period effect
Notes: 1. Age centred to 65 years for age category 65–74 and to 75 years for age category 75–84. 2. For age 65–74 years recent cohort is 1936–1945 versus former cohort 1926–1935, and for age 75–84 years recent cohort is 1926–1935 versus former cohort 1916–1925. 3. Part of total variance due to between subjects and periods. 4. Part of variance due to age net of individual and period variances. 5. Part of variance due to age and cohort net of individual and period variances. BIC: Bayesian information criteria.
Significance levels: * p<0.05, ** p<0.01, *** p<0.001, NS: not significant.
Determinants of LS
Distributions of the selected determinants (Table 2) reflect the historical trend in educational attainment across cohorts, with the earliest one having the lowest proportion of higher-educated women (54.2%) and the most recent one (1936–1945) having the highest proportion (69.1%). Regarding the living situation, the ‘old old’ women from the former cohort are the least likely to live with a spouse (28.9%), significantly less than those of the more recent cohort (36.4%). Among the ‘young old’, living with a partner is more prevalent, but again a significant difference exists between the two cohorts (50.6% of the 1926–1935 cohort versus 63.1% of the 1936–1945 cohort). Though the difference is not statistically significant, the satisfaction with income tends to be slightly higher among more recent cohorts; it remains at the same level for both age categories. Social support is significantly higher among women of more recent cohorts and older women (75–84 years) report clearly less support. Self-perceived health is slightly higher among more recent cohorts (not significant); older women (75–84 years) report poorer self-perceived health, but still almost two-thirds of them consider themselves in good health at that age.
All covariates are positively associated with LS (Table 2). High education, high social support, living together as a couple and good self-perceived health increase the probability of LS by about 50–100 per cent and high satisfaction with income by about 300 per cent. The absence of significant interactions between covariates and the cohort categories in both age categories indicates that the main effect of covariates is stable across cohorts and age. These results suggest that it is important to adjust for the effect of covariates when assessing LS age trajectories across cohorts, but that it is not necessary to include interaction terms.
More recent cohorts are in general less satisfied with life than former cohorts of the same age, but they are more educated, more satisfied with their income, have higher social support and are living more often with a spouse, and are slightly healthier (Table 2). Among those 65–74, the unadjusted probability of LS is slightly higher for the former cohort (OR=1.1; 95% CI=0.9–1.4), when adjusted for covariates the OR is higher and significant (OR=1.2; 95% CI=1.0–1.4). Among those 75–84, this difference is higher and significant (adjusted OR=1.4, 95% CI=1.1–1.8 and adjusted OR=1.6; 95% CI=1.2–2.1). The importance of the individual part explaining LS is also evident from the within-individual variance (56%) reported earlier out of the unconditional mean model.
Determinants of LS trajectories
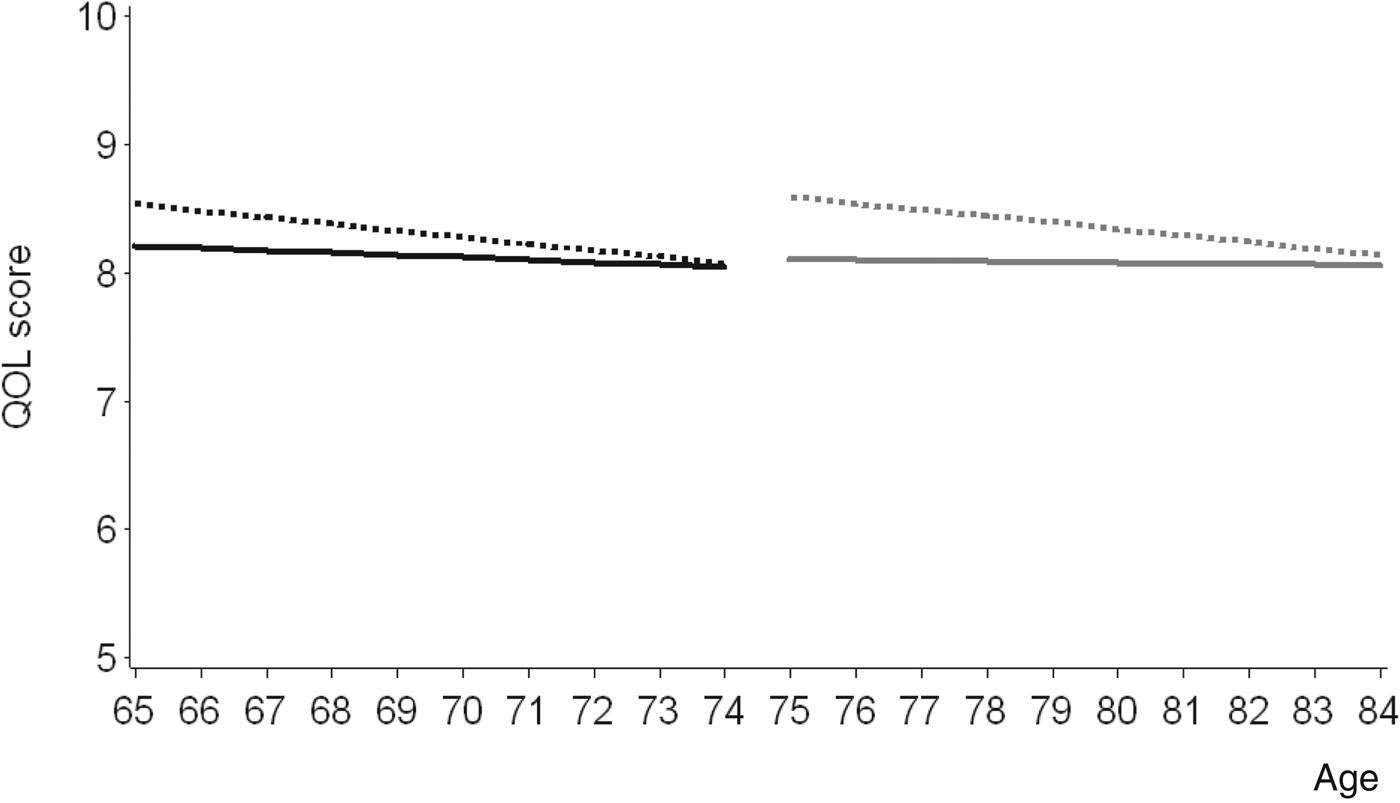
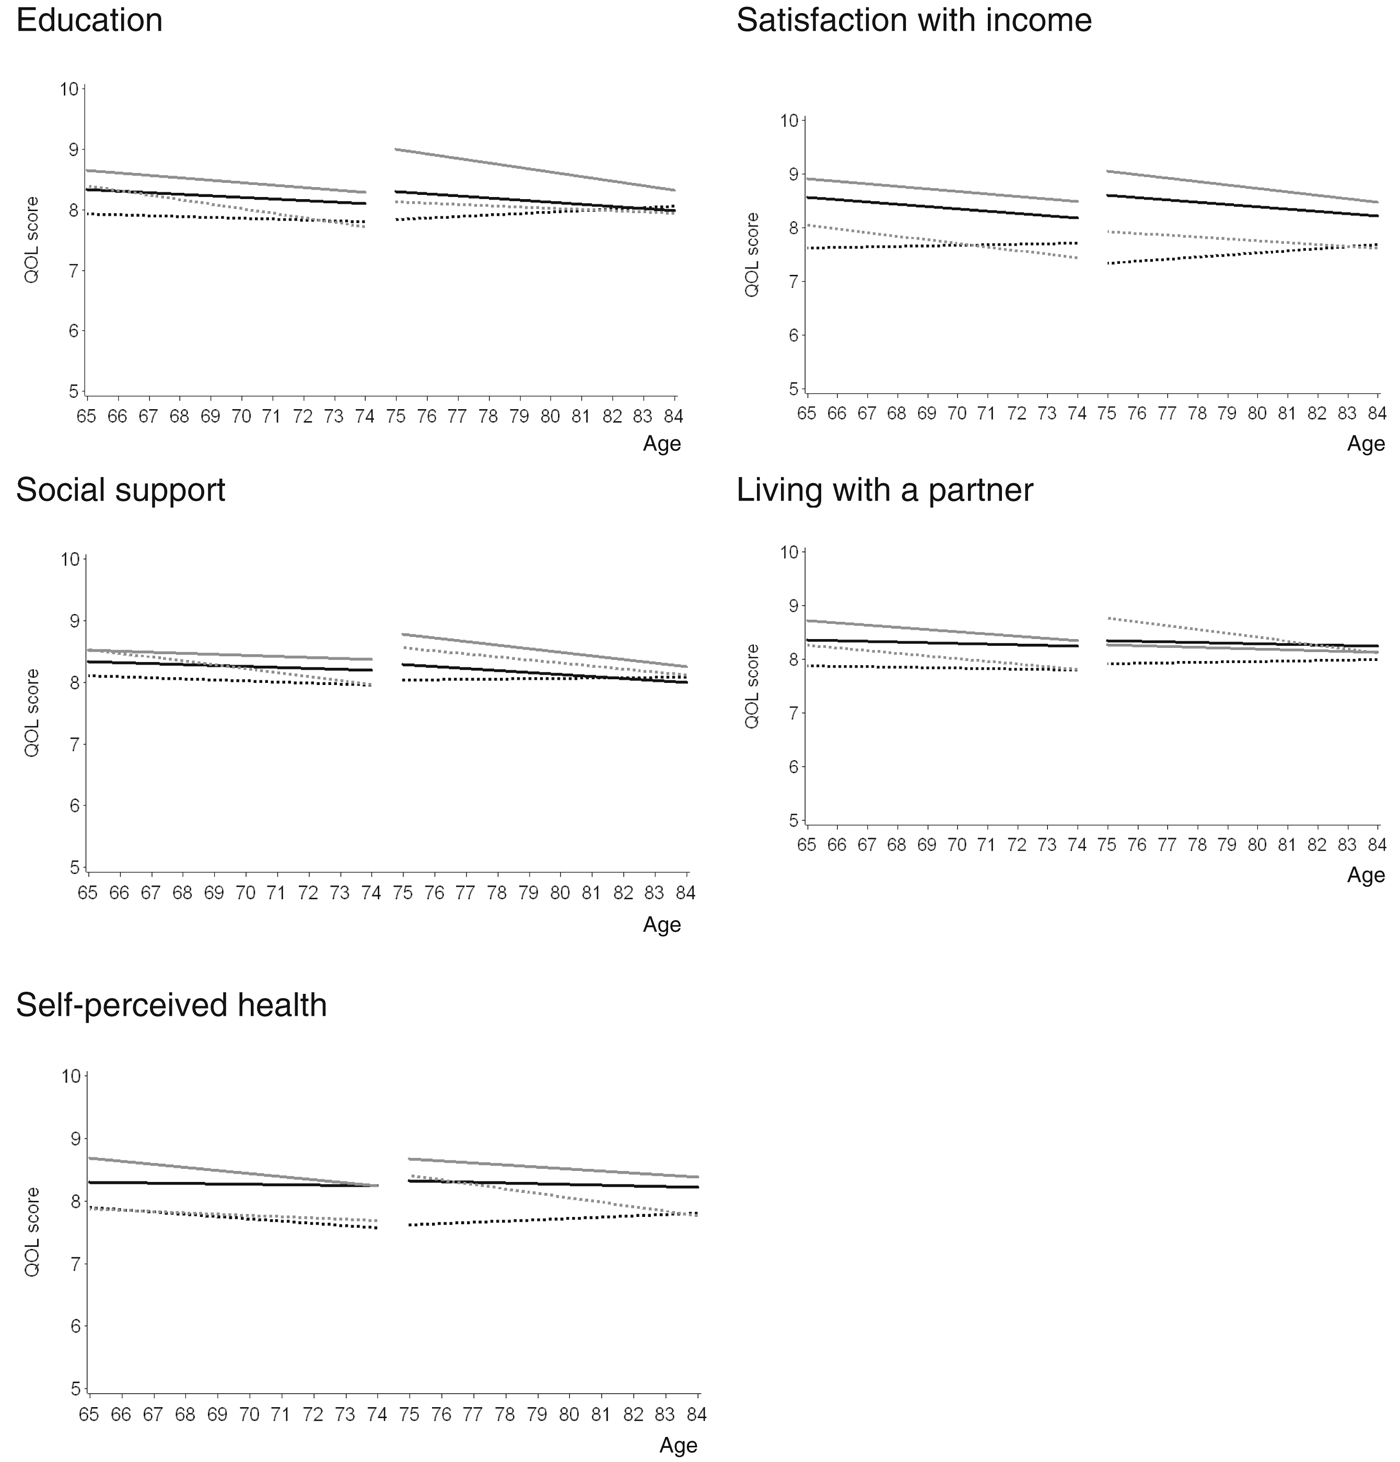
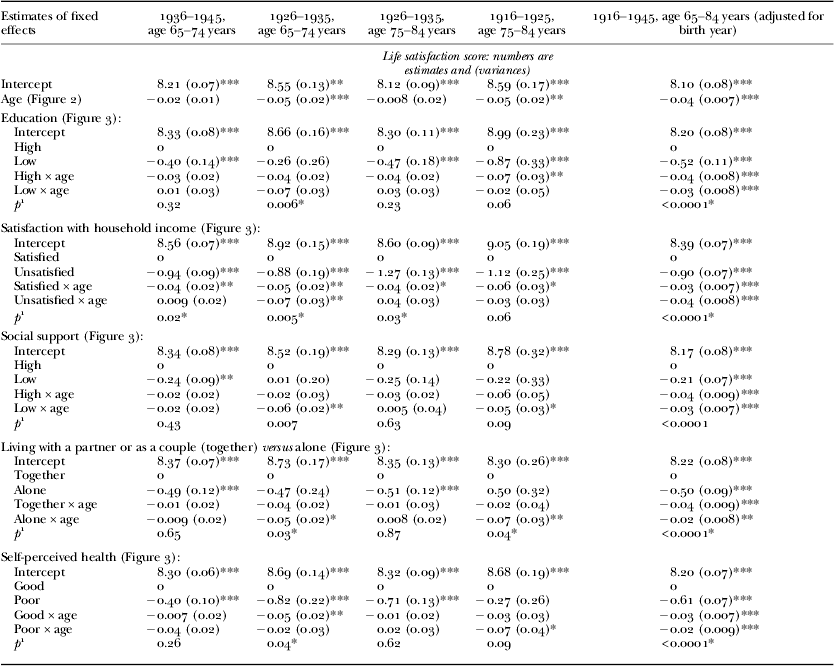
Results regarding the influence of social determinants on LS trajectories are reported along three questions (Figure 3; Table 4): (a) does the level of resources affect LS trajectories? (in the figures, comparison between solid and dashed trajectories); (b) are there differences between cohorts in the evolution of LS? (comparison between black and grey trajectories); (c) are there differences across age categories in regards to the influence of determinants? (comparison between the left and right patterns).
Life satisfaction trajectories on age, by age and birth cohort categories, for selected determinants, Swiss Household Panel 2000–2010, women 65–84 years.
Estimates from mixed models of life satisfaction for age and covariates, by age and cohort categories net of period effect
Note: 1. Value for the covariate and age interaction.
Significance levels: * p<0.05, ** p<0.01, *** p<0.001.
Regarding the level of resources, women having more of them systematically start with higher levels of LS than those with limited resources (with the exception of the women of the 75–84 age category, from the former cohort, living alone who had the highest LS in that age category). Over the process of ageing, the LS of women with positive resources tends to decline, but in a limited way; this is especially the case for those who maintain high social support, live with a partner and are in good health. Among women with limited resources, LS trajectories are more divergent: some experience a slight improvement in their LS over time, in particular those with lower education, less satisfied with their income or living alone. But others, for example some of those living alone or in poor health, experience particularly sharp decline in their LS. Satisfaction with income generates most of the variation among the compared groups, while social support only has a limited influence.
In regards to cohorts, LS trajectories of women belonging to former cohorts are above those of women from more recent cohorts, indicating higher levels of satisfaction. This is especially the case among older women having positive resources: in each age category the LS trajectories of both cohorts run in parallel in most cases. Among women with limited resources, former cohorts also start at a higher level of LS but then experience a faster decline over ageing than those of more recent cohorts. Two specific elements can be further highlighted here. First, among the ‘young old’ (65–74 years old), the former cohort shows the fastest declining LS trajectories, especially among women with lower education, not satisfied with their income, having limited social support and living alone. Among the ‘old old’ (75–84 years old), members of the more recent cohort with limited resources systematically reported a slight improvement in their LS over ageing. This means that ageing is not inevitably linked to declining LS, even among those with limited resources.
In regards to age categories, a greater heterogeneity of trajectories can be observed among the ‘old old’, in comparison to the ‘young old’ along the different determinants. This would suggest that among older women, the amount of available resources have a stronger impact on their LS evaluation. It should also be noted that in the ‘old old’, self-perceived health only has a limited impact on the LS, with stable trajectories for three of the four compared groups.
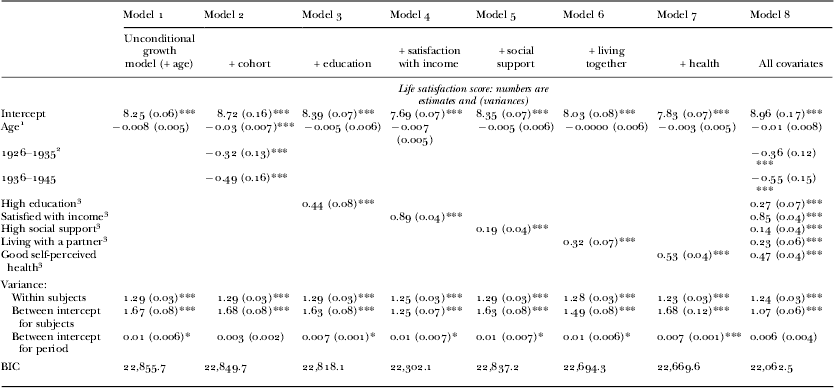
Finally, a HAPC model including age, and successively each covariate net of period effect, was estimated (Table 5). It shows that all positive characteristics are significantly increasing the probability of being satisfied with life, except age. However, the effect of age adjusted for cohort only is significant. The adjustment for the different slopes across the two levels of covariates is cancelling out the differential age effect between them. It is important to report the interaction term between age and each covariate to understand better the specific effect of each group characteristics on LS trajectory. In the multivariate HAPC, all covariates remain significant, except age.
Estimates from hierarchical age–period–cohort mixed models of life satisfaction for age and covariates net of period effect
Notes: 1. Reference age centred to 65 years. 2. Reference former cohort 1916–1925. 3. References for covariates are: low education, not satisfied with household income, low social support, living alone, poor self-perceived health. BIC: Bayesian information criteria.
Significance levels: * p<0.05, ** p<0.01, *** p<0.001.
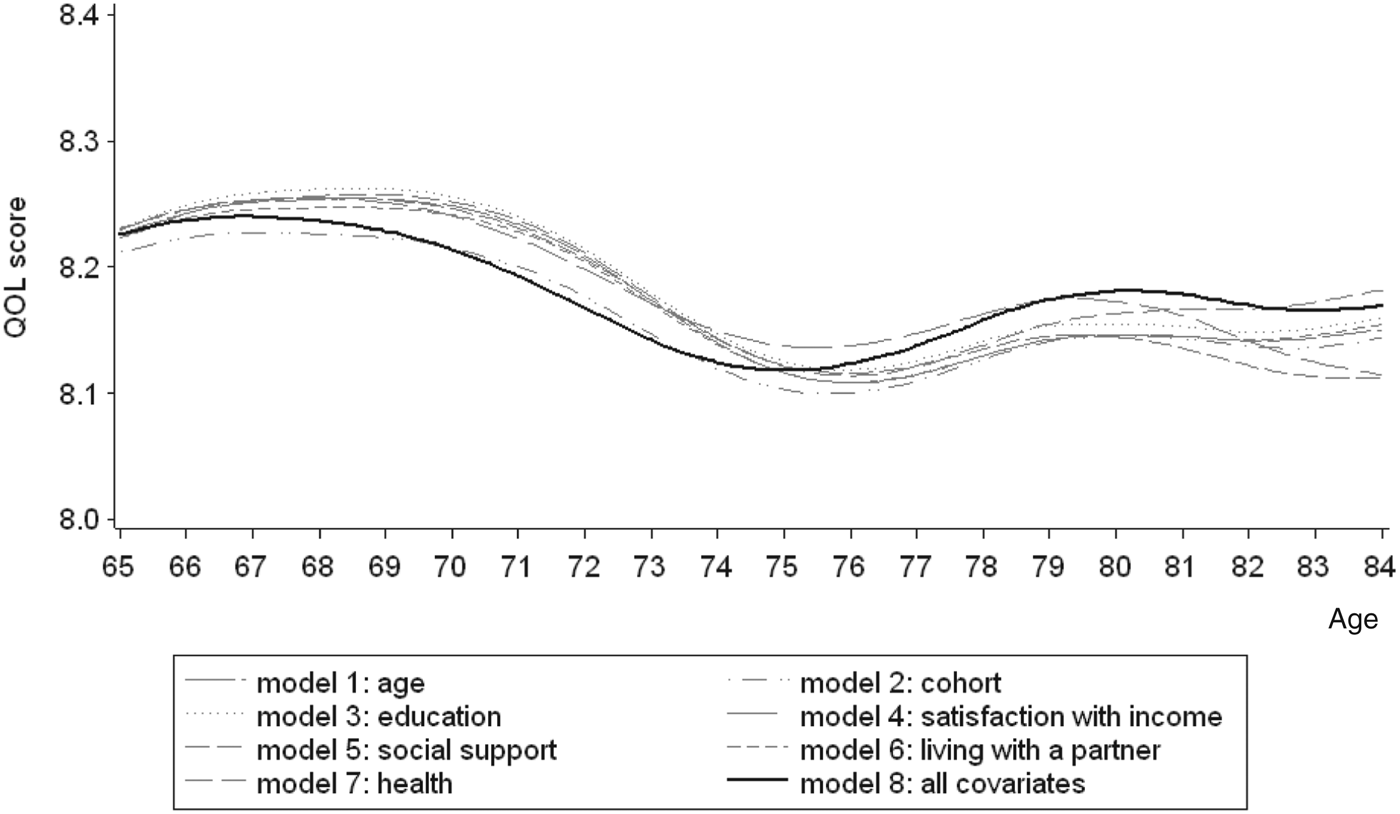
After adjusting for all covariates, the difference between cohorts is larger, with the most recent cohort (1936–1945) even less satisfied than in the crude analysis. Most of the between-variance is due to subjects and cohort, period was of little interest. The within-subjects variance is large and significant, suggesting a substantive contribution of individual traits that are beyond group characteristics like cohort, period and determinants (Table 5). The different curves in Figure 4 visually illustrate changes in levels of LS with progressive ageing in relationship to positive socio-economic resources (covariates). Though each resource appears to have a slightly different impact on LS with age, the overall trends are quite similar. Indeed LS slightly increases from 65 to 70 years, then drops to a somewhat lower stable level starting at age 75. Though elderly women who enjoy the most favourable resource position (all covariates) also show a significant drop in LS during early retirement age, they tend to experience a significantly better LS level after age 75 compared to women who are less well off. This model confirms the positive impact of these combined determinants. In the former cohorts, all the favourable conditions result in a considerable upwards adjustment in LS.
Estimates from hierarchical age–period–cohort mixed models of life satisfaction for age and covariates net of period effect, Swiss Household Panel 2000–2010, women 65–84 years.
Discussion
Overall, about 50 per cent of elderly women in Switzerland are very satisfied with their lives. LS progressive decline over ageing is clearly affected by a cohort effect. In both the ‘young old’ and the ‘old old’, former cohorts are more satisfied with life than more recent cohorts. This could result from changing expectations over time, with women born later having experienced good living conditions during their adulthood and being more demanding in regards to their retirement (Bowling 2004, cited in Walker Reference Walker2005). Another explanation relates to the fact that experiencing some adversity over the lifecourse may reinforce resilience at later stages (Seery, Holman and Silver Reference Seery, Holman and Silver2010). Alternatively, these differences might result from a reporting bias: compared to women of more recent cohorts, those of the former cohorts could be more reluctant to admit in a survey that their LS is low. Indeed our analyses show that LS trajectories are also affected by a cohort effect, with women of former cohorts experiencing a faster decline in LS than women of more recent cohorts. These patterns were observed for the ‘young old’ and the ‘old old’.
LS levels and trajectories are associated with social determinants, confirming previous research (Grundy Reference Grundy2006; Netuveli et al. Reference Netuveli, Wiggins, Hildon, Montgomery and Blane2006; Von dem Knesebeck et al. Reference Von dem Knesebeck, Wahrendorf, Hyde and Siegrist2007; Wilhelmson et al. Reference Wilhelmson, Andersson, Waern and Alleberck2005). High education, satisfaction with income, social support, living with a partner and good self-perceived health are all positive and significant predictors of LS (all OR >1, p<0.05) and these associations were similar across cohorts of similar ages (all interaction terms p>0.05). Satisfaction with income is the most important of the analysed determinants. Positive resources further help maintain LS levels over time, which suggests that benefiting from more resources contributes to better coping with ageing. Women with limited resources showed more diverse patterns, some experiencing a sharp decline and others being able to maintain a stable LS. These patterns confirm the heterogeneity of LS trajectories observed by Netuveli et al. (Reference Netuveli, Wiggins, Hildon, Montgomery and Blane2006). The fact that women with limited resources and older women (75–84 years old) have more heterogeneous LS trajectories could indicate that in such circumstances some are better able to cope with ageing than others. The important part of variance attributed to within-subject changes suggests that within-individual characteristics like psychological adaptation, levels of aspirations and comparisons with peers, as well as other unobserved individual traits, are probably as relevant in LS evaluations. These differences might be particularly important among those having lower social and economic resources, as well as among older ones.
Findings emphasise that there is a significant difference in LS between cohorts of identical ages, with earlier cohorts being more satisfied than more recent cohorts, though the later ones are indeed better off in terms of socio-economic status and health at identical ages. Therefore, analyses that do not adjust for those covariates positively influencing LS bias the association between LS and the cohort category towards the null. The higher satisfaction score among former cohorts should in fact be even higher than observed, had former cohorts enjoyed the same advantages as the more recent ones.
Living conditions have changed in the last decades; these changes have particularly affected baby-boomer cohorts in general, and women's life conditions in particular (Chauvel Reference Chauvel1998). However, our findings suggest that between-individual socio-economic resources may not be the only determinants of LS. Within-individual characteristics are probably as important in the level of LS. We observed that some elderly women are able to maintain their quality of life despite their limited resources.
Limitations
The present study is limited to elderly women born between 1916 and 1945 who in the years 2000–2010 were anywhere from 65 to 84 years old. All three birth cohort groups (1916–1925, 1926–1935 and 1936–1945) might, as children and young adults, have experienced relatively hard economic conditions, but could enjoy during most of their adult life the economic upturn of the 1960s and thereafter. These findings may not be applicable to the upcoming baby-boomer generation now entering the life stage of the ‘young old’. However, all else being equal, this upcoming highly demanding cohort of elderly might experience lower levels of LS despite their enhanced capacity – better educated, higher income and increased relational resources – to cope with old age adversities. Our analyses included women only and therefore we cannot propose any interpretation in regards to the role of gender itself in the observed trends.
Conclusions
We assessed the role of age and cohort effects in regards to LS among elderly women living in Switzerland. Our results suggest that the elderly women born in the early 20th century (years 1916–1925) and consequently exposed during their early adult lives to the harsh social conditions of the years 1925–1945 cope less well with the ageing process. More recent and better educated cohorts, though generally more demanding and less satisfied with life, do indeed adapt better to the disadvantages of old age.
Most of the decline in LS in former cohorts occurs among the less educated, less satisfied with household income, getting less social support or living alone, and being unhealthy. Among more recent cohorts, less satisfied at baseline, LS remains fairly stable over ageing. The decline in LS on age is therefore underestimated by a cohort effect. However, results also indicated that within-subject changes are important, suggesting that individual characteristics – such as psychological adaptation – need to be taken into account.
In conclusion, new cohorts of elderly women tend to report lower levels of LS, which suggests that they are more demanding than their predecessors, even though their living conditions have significantly improved. While this trend could represent an increase in needs expressed by older people, it could also enhance their involvement in their own care planning. Therefore, these findings allow new challenges to be anticipated, but also opportunities in relation to provision of informal and formal care for the elderly.
Acknowledgements
This study has been realised using the data collected by the Swiss Household Panel (SHP), which is based at the Swiss Centre of Expertise in the Social Sciences FORS. The project is financed by the Swiss National Science Foundation. This publication is part of the research works conducted at the Swiss National Centre of Competence in Research LIVES – Overcoming Vulnerability: Lifecourse Perspectives, which is financed by the Swiss National Science Foundation. This project was funded by the Leenaards Foundation, Lausanne, Switzerland. The authors designed the research protocol and wrote the manuscript together; analyses were conducted by DZ-S and CB-J reviewed the literature. Statement of ethical approval: ‘SHP data users and collaborators are to comply with the Swiss Regulations regarding data protection: in particular, users are to refrain from trying to identify a particular household or person and are strictly prohibited from using information for anything other than scientific research purposes. Published results shall not contain any information making it possible to identify any SHP household or interviewed person’ (SHP data users' contract). There are no conflicts of interest.