




No CrossRef data available.
Article contents
Motor learning in children with spina bifida: Dissociation between performance level and acquisition rate
Published online by Cambridge University Press: 01 October 2004
Abstract
The cerebellum is part of a neural circuit involved in procedural motor learning. We examined how congenital cerebellar malformations affect mirror drawing performance, a procedural learning task that involves learning to trace the outline of a star while looking at the reflection of the star in a mirror. Participants were 88 children with spina bifida myelomeningocele, a neural tube defect that results in lesions of the spinal cord, dysmorphology of the cerebellum, and requires shunt treatment for hydrocephalus, and 35 typically developing controls. Participants completed 10 trials in the morning and 10 trials following a 3-hr delay. Although children with spina bifida myelomeningocele were initially slower at tracing and made more errors than controls, all participants improved their performance of the task, as demonstrated by increased speed and accuracy across trials. Moreover, degree of cerebellar dysmorphology was not correlated with level of performance, rate of acquisition, or retention of mirror drawing. The results suggest that congenital cerebellar dysmorphology in spina bifida does not impair motor skill learning as measured by acquisition and retention of the mirror drawing task. (JINS, 2004, 10, 877–887.)
Information
- Type
- Research Article
- Information
- Journal of the International Neuropsychological Society , Volume 10 , Issue 6 , October 2004 , pp. 877 - 887
- Copyright
- © 2004 The International Neuropsychological Society
INTRODUCTION
Learning may involve the acquisition of knowledge or the mastery of skills (Milner et al., 1998). The neuroanatomical substrates are different for the two forms of learning, with the hippocampus being important in the former, and the cerebellum and basal ganglia being important in the latter (Doyon et al., 2003; Milner et al., 1998). For example, patients with damage to the hippocampal region demonstrate selective impairments in acquiring new explicit memories, while still being able to acquire or retain skills (Milner et al., 1998). In contrast, studies of motor skill learning highlight the roles of the basal ganglia and cerebellum (Doyon et al., 2003; Laforce & Doyon, 2001; Thach, 1998). It has been suggested that the hippocampus and the basal ganglia and cerebellar circuits play analogous roles in the acquisition and early expression, although not in the long-term retention, of these two types of learning (Gabrieli et al., 1993).
The cerebellum is important for motor control, for processing visual feedback during visually guided movements, and for predicting the sensory consequences of motor events (Miall & Reckess, 2002), all of which are components of motor skill learning. Neuroimaging studies of normal individuals have shown that the cerebellar involvement in motor skill learning occurs during acquisition and initial performance, with long-term skill retention and performance being mediated by higher cortical brain areas (Desmond & Fiez, 1998; Doyon et al., 2003). Studies of adult patients with brain lesions have identified a cerebellar role in motor skill learning as well. Adult patients with cerebellar lesions exhibit impaired performance on tasks of motor skill learning, including prism distortion (Weiner et al., 1983), serial reaction time (Pascual-Leone et al., 1993) and mirror drawing (Laforce & Doyon, 2001; Sanes et al., 1990; but see Harris et al., 2001, for conflicting results).
Relatively little is known about the effects of developmental cerebellar compromise on those functions normally controlled by the mature cerebellum. Motor and neurocognitive impairments are observed in children with spina bifida, a neural tube defect of the spinal cord associated with profound disturbances of brain development that include abnormal formation and maturation of the cerebellum, midbrain, corpus callosum, and posterior cortex and white matter (Dennis et al., 1999; Fletcher et al., 1992, 2000). Cerebellar dysmorphology and hypoplasia are prominent parts of the neuropathology of spina bifida (Barkovich, 1995). The Arnold-Chiari II malformation, the defining pathology in spina bifida, involves a small posterior fossa in which cerebellar development is restricted, the cerebellar hemispheres are reduced, the vermis is pushed upwards, and the cerebellar tonsils and flocconucular lobe are herniated downwards through the exits of the fourth ventricle. Spina bifida is a heterogeneous disorder and is usually classified on the basis of the spinal dysraphism that is apparent at birth and that is accompanied by a loss of sensory and motor function below the level of the spinal lesion. Spina bifida myelomeningocele is the most common and severe form of the condition. Most children with spina bifida develop hydrocephalus, which involves enlarged cerebral ventricles and produces a range of primary and secondary effects on the brain (del Bigio, 1993; Fletcher et al., 2000).
Limited research has been conducted on motor learning in this population. While it is known that children with spina bifida myelomeningocele are as proficient as typically developing children on visuomotor learning and adaptive reaching tasks, even under conditions of restricted visual feedback (Anderson & Plewis, 1977) or lateral visual displacement by prisms (Colvin et al., 2003), their performance is more variable (Anderson & Plewis, 1977). However, important features of motor learning in children with spina bifida myelomeningocele remain to be studied, including the shape of the curve relating practice to performance, differences in speed and accuracy, and the relation between acquisition and retention.
Mirror drawing is a task in which these features may be studied. Mirror drawing is a motor skill that requires learning new associations between vision and hand and arm movement. Performance improves with repetitions of the task, even in individuals who may not recall or recognize the improvement. For example, patients with Alzheimer's disease and global amnesia acquire mirror drawing as well as controls, despite impaired recall and recognition for the task (Gabrieli et al., 1993; Milner et al., 1998). In this paper, we studied mirror drawing in children with spina bifida myelomeningocele, examining the changes in speed and accuracy of performance over time, and the correlations between measures of motor skill learning and quantitative measures of cerebellar volume, acquired through structural magnetic resonance imaging.
MATERIALS AND METHODS
Research Participants
The participants were 123 children and adolescents between 8–19 years of age. One group (N = 88) had been diagnosed with spina bifida myelomeningocele at birth, and had been treated with a shunt shortly thereafter. Twenty-three of those children had no shunt revision, 28 had 1 revision, 25 had 2–4 revisions, 10 had 5–9 revisions, and 2 children had more than 10 shunt revisions. The other group comprised typically developing, age-matched controls (N = 35). All participants had a score of 70 or greater on at least one of the Verbal Reasoning or the Visual Abstract Reasoning subtests of the Stanford-Binet Test of Intelligence–Revised (Thorndike et al., 1986; group M ± SEM: control: 108.34 ± 1.72; spina bifida: 88.65 ± 1.37). The sample included 89 White, 18 Hispanic, 8 Asian, 5 African American, and 3 children of other ethnicities. Individuals were excluded from participation if they had neurological disorders unrelated to spina bifida myelomeningocele, severe psychiatric disorder that precluded adequate cooperation (autism, psychosis, oppositional–defiant disorder), uncontrolled seizure disorder, uncorrected sensory disorder, or inability to control the upper limbs. The exclusions were ascertained by DSM–IV questionnaires completed by the parents (SNAP–IV; Swanson, 1992) including a DSM–IV checklist for autism and pervasive developmental disorders, a medical history chart reviewed by a research nurse, and observations of the child's behavior when evaluated. Participants in each group were recruited from clinics around two sites, the Hospital for Sick Children in Toronto (N = 73) and the University of Texas–Houston Medical School in Houston (N = 50). Participants and their families gave informed assent/consent in accordance with the guidelines of the research ethics boards at the two sites.
Individuals with spina bifida myelomeningocele have lesions at various levels of the spinal cord, which provides a source of principled, within-group variability. The level of spinal lesion is related to a mutation in methylenetetrahydrofolate reductase (MTHFR), the enzyme that regulates folate-dependent remethylation of homocysteine (Van der Put et al., 2001). The incidence of the MTHFR mutation is higher in mothers of children with upper spinal lesions than in typically developing controls or in mothers of children with lower spinal lesions (Volcik et al., 2001). To explore one source of biological variability, participants with spina bifida myelomeningocele were divided into upper spinal lesion (T12 and higher; N = 19) and lower spinal lesion (L1 and lower; N = 69) groups, according to current taxonomies (Fletcher et al., in press; Park et al., 1992).
Magnetic Resonance Imaging
Fifty-seven children (43 children with spina bifida myelomeningocele, 14 controls) had structural magnetic resonance (MR) brain scans that were artifact-free and had been quantified in a manner suitable for segmentation.
Image acquisition
Three sets of images were acquired, including a T1-weighted coronal series for assessment of white and gray matter and a T2-weighted coronal series for assessment of CSF. To co-register and position normalize the scans, external fiducial markers were placed on the nasion, and external meatus. An initial series (spin echo T1-weighted sagittal localizer, FOV 24, TR 500, TE14, 256 × 192 matrix, 3 mm skip 0.3, two repetitions) was used for anatomical landmark identification. One whole-brain coronal series consisted of a fast spin-echo Proton density and heavily T2-weighted images (FOV20, TR 4000, TE1 15, TE2 112, 256 × 192 matrix, with two repetitions). This series was obtained in contiguous 1.5-mm slices across the whole brain. Another whole-brain coronal series consisted of a 3D-spoiled grass (3D SPGR) gradient echo contiguous 1.5 mm coronal series (TR21, TE4, Flip angle 35°, 124 locations, 256 × 192 matrix, one repetition).
Image preprocessing
Prior to tissue segmentation, each slice series was stored in a single volume file and the pixel gray scale limits were expanded by increasing the gain within the 0 to 255 (byte data) range. Each sequence volume was then reformatted so that voxel dimensions were isotropic. The T1 and T2-weighted reformatted volumes were aligned with each other through the use of the fiducial markers. Rigid-body translation and rotation routines programmed in IDL software were used for the realignment procedure itself, which was manually and visually checked at each step. Each volume was placed within a 256 cubic voxel bounding box with the fiducial marker cross point placed at the center of the volume. The two reformatted and aligned volumes were filtered using a non-linear anisotropic diffusion filter, which increased the overall signal-to-noise ratio of each volume an average of 100% (Gerig et al., 1992). This automated nonlinear filter served to sharpen areas of high intensity gradient (boundaries) and to smooth regions of low-intensity gradient within the tissue borders. Finally, a separate interactive C program operating on the T2-weighted reformatted, aligned, and filtered volume was used to separate the cerebellum using a combination of interactive intensity thresholding and manual delineation. The cerebellum was then filled automatically to its borders, thereby defining an image mask, with the masking process being performed on a slice-by-slice basis. Cerebellum volume measures were computed automatically following mask generation.
Automatic segmentation
The method used a fully automated fuzzy cluster analysis (Pao, 1989) that obtained whole brain and regional brain tissue and CSF volumes (Brandt et al., 1992, 1994, 1996). The T1 weighted scan volume, which provides superior white-gray contrast compared to the T2 weighted scan, was used to obtain white and gray matter tissue volumes. Although it is common to estimate CSF from the T1-weighted scan, this approach is not accurate in identifying volumes of CSF (Fletcher et al., 1996). As increased CSF is a cardinal characteristic of hydrocephalus, the T2-weighted scan was fuzzy clustered separately from the T1-weighted scan to extract CSF volumes, and this was used to adjust the white and gray matter volume measures obtained from the T1-weighted volume.
Derived measures
Solution images were derived from the final computed fuzzy cluster membership values for each voxel, which could then be viewed graphically on screen and compared with the actual scan images. Separate tissue volumes (white matter, gray matter, CSF) were obtained for the whole cerebellum, medial cerebellum, and lateral cerebellum.
The cerebellums of individuals with spina bifida myelomeningocele are highly dysmorphic, which makes it difficult to reliably visualize multiple landmarks and thence to estimate regional cerebellar volumes. We therefore developed an algorithm to estimate volumes that would roughly correspond to medial and lateral cerebellar regions. We identified the midsagittal cerebellum slice from the coronal series and identified the primary fissures to the left and right of the middle cerebellar slice in MR scans from typically developing children. We found that the vermis represented on average 11% of the total cerebellum, and we used this estimate to define a medial cerebellar volume by identifying the areas 5.5% on either side of the midline, with the remainder being defined as the left or right lateral regions. The medial cerebellar volume is therefore a proxy for the vermis volume and may be subject to some error of measurement across cases in precisely defining the vermis. However, the procedures developed do allow reliable estimates of the medial cerebellum in individuals with major dysmorphologies of the cerebellum. Because the primary goal was to differentiate medial and lateral regions of the cerebellum to assess relations with the neurocognitive measures, this procedure appeared to be appropriate.
Mirror Drawing
The mirror draw apparatus was created using a digitized tablet and pressure sensitive pen (PenPartner, Wacom; Vancouver, WA). A five-pointed star (Corel Print House 3.0; 9 cm across × 5.5 cm high) printed on a transparency was attached to the tablet. An adjustable shelf (22 × 27.5 cm) placed parallel to and directly above the tablet blocked the participant's direct view of the star. A mirror (26 × 20 cm) placed behind the tablet, perpendicular to the star, allowed participants to see the reflection of the star in the mirror.
Participants were seated at a table and were instructed to use the PenPartner pen to trace the outline of the star using their preferred hand, starting at the outermost point of the star and, moving in a counter-clockwise direction, trace the entire star, looking at the reflection of the star in the mirror. Subjects completed 10 trials in the morning (learning) and 10 trials in the afternoon, following a 3-hr delay (retention). Participants were instructed to try to trace all points of the star, and not to abandon accuracy for speed. Three measures were calculated for each trial:
- Time: the amount of time required to trace the star.
- Area error: the total area between the boundary lines of the star and the subject's drawing. This includes area created by error both inside and outside the line.
- Cross error: the total number of times the participant's drawing crossed the boundary line of the star.
Model Specification and Data Analysis
Children with spina bifida myelomeningocele have motor deficits, so it is necessary to distinguish between level of performance ability and the rate of change in performance, or skill acquisition (learning). To evaluate mirror drawing skill learning across trials, and to make comparisons between groups, we fitted a linear model of individual change over time to represent the acquisition of mirror drawing skill. Our outcome measure was the time required to complete the trace on each trial. Because skill learning is defined as increased speed without decreased accuracy, we also included either cross error or area error on each trial as a time-varying covariate. That is, we modeled the effect of errors at each trial on drawing time, as opposed to generating a single estimate of errors for each child over the entire time period.
Theoretically, it made sense to estimate parameters separately for the morning trials and afternoon trials because the morning trials correspond to the learning phase of the task, while the afternoon trials correspond to the retention phase. The raw data for the morning trials follow the trajectory of a quadratic curve, while the raw data in the afternoon trials appear to follow a straight line. These observations were confirmed by fit indices that demonstrated mathematically the best fitting model for all 20 trials. We took a mixed model approach to analyzing the data using SAS PROC MIXED. That is, the growth models we used for representing the data had two levels. The Level 1 model was an individual growth model for which each person had his or her own parameter values, and the Level 2 model represented the variation in the individual parameters of Level 1 as random effects. A more detailed description of this kind of model is available in Singer (1998).
In the present context, the random effects are those parameters that are permitted to vary across children. For example, because there was sufficient variability among children in the rate at which they learned to draw the star across the 10 morning trials, the parameter for the slope across morning trials (the rate of improvement in performance) was estimated separately for each child. As such, the slope in the morning is a random effect. The other random effects in this model are initial performance, or performance at Trial 1, and the change in slope, or the change in rate of improvement in performance across trials in the morning. Fixed effects are those that are best estimated by the mean of the child's group, most often because there is little variability among children on the parameter of interest. For example, we found that the best estimate of each child's change in rate of improvement across the afternoon trials was the group mean. The other fixed effects in this model are the drop in performance following the break between the morning and afternoon trials (savings), and the rate of improvement in performance across the afternoon trials. In order to fit the models in SAS PROC MIXED, we constructed independent variables across all 20 trials in such a way that SAS PROC MIXED produced the parameters of greatest interest to us, given our hypotheses, and our decision to represent growth in the morning and afternoon with separate growth curves in order to reflect the two separate phases of learning and retention. Thus, the mathematical model was constructed so as to generate estimates of the mean values of performance, defined as mirror drawing time, taking into account either cross errors or area errors at each trial for the following parameters of interest, as well as estimates of variability in these individual parameters:
Learning phase (Trials 1–10)
- Initial performance at Trial 1
- Acquisition of mirror drawing, measured by the improvement in performance, or slope, across Trials 1–10
- Change in rate of improvement in performance across the morning trials, measured by the change in the slope across Trials 1–10
- Level of proficiency in the morning, measured by performance on Trial 10
Retention phase (Trials 11–20)
- Savings, or the retention of mirror drawing ability from the morning to the afternoon, measured by the decrease in performance from Trials 10–11
- Continued improvement in mirror drawing ability across the afternoon trials, measured by the change in performance, or slope, across Trials 11–20 in the afternoon
- Level of proficiency in the afternoon, measured by performance on Trial 20
We used these parameters to compare mirror drawing in children with spina bifida myelomeningocele to typically developing controls. To evaluate the effects of spinal lesion level, we compared mirror drawing performance in children with spina bifida myelomeningocele with lower spinal lesions (≤ L1) or upper spinal lesions (≥T12), to typically developing control children. Finally, we correlated the cerebellar volumetric data with the random effects parameters on the mirror draw task (performance at Trial 1, rate of improvement in performance, and change in the rate of improvement in performance in the morning) to assess the relationship between measures of mirror learning and measures of brain structure.
RESULTS
Mirror Drawing
Mean values for observed time, area error, and cross error across trials are shown in Figure 1. The derived outcome measure for these analyses was performance, defined as mirror drawing time, taking either cross error or area error into account at each trial (Figure 2). Because cross error was not correlated with area error (p > .05), we analyzed the two performance measures, time taking into account cross error, and time taking into account area error.

Mirror drawing performance in children with spina bifida (filled squares) and in typically developing controls (open squares). Top: Average tracing time per trial (s; M ± SEM). Middle: Average area error on each trial (cm2; M ± SEM). Bottom: Average number of cross errors on each trial (counts; M ± SEM).

Mirror drawing performance in children with spina bifida (filled squares) and in typically developing controls (open squares), based on the linear model of individual change over time fit to the observed data. Top: Predicted values for time in seconds, taking cross errors into account at each trial. Bottom: Predicted values for time in seconds, taking area errors into account at each trial (see Methods).
Learning Phase (Trials 1–10)
Both groups demonstrated improvements in performance (Figure 2). Each became faster across trials [time, covarying for cross error: F(1,121) = 170.20, p < .0001; time, covarying for area error: F(1,121) = 165.80, p < .0001]. However, children with spina bifida myelomeningocele did show impairments relative to controls. Their initial level of performance was significantly slower (time, covarying for cross error: t = −3.97, p < .0001; time covarying for area error: t = −4.07, p < .0001]. Moreover, the two kinds of errors contributed differentially to the initial level of performance in each group. Specifically, the number of cross errors played a significantly larger role in the initial performance of children with spina bifida myelomeningocele compared to controls (t = −2.32, p < .02). In contrast, area error had a larger impact on initial performance in controls compared to children with spina bifida myelomeningocele (t = 2.60, p < .01). By Trial 10, the performance of children with spina bifida myelomeningocele did not differ from controls (p > .1). Children with spina bifida myelomeningocele improved faster than controls across learning trials (time, covarying for cross error: t = 5.04, p < .0001; time, covarying for area error: t = 4.34, p < .0001), and their rate of improvement in performance changed more quickly than those of controls (time, covarying for cross error: t = −5.46, p < .0001; time, covarying for area error: t = −4.60, p < .0001).
Retention Phase (Trials 11–20)
Although children with spina bifida myelomeningocele performed more poorly than controls on the first trial of the afternoon (time, covarying for cross error: t = −3.56, p < .0004; time, covarying for area error: t = −2.71, p < .007), there was no group difference in savings, or in the change in performance from the final trial in the morning (Trial 10) to the first trial of the afternoon (Trial 11; p > .1). On average, all children continued to improve across the afternoon trials (time, covarying for cross error: F(1,2083) = 8.30, p < .004; time, covarying for area error: F(1,2083) = 4.76, p < .029), and children with spina bifida myelomeningocele improved across trials at the same rate as controls (p > .1). By the last trial in the afternoon, children with spina bifida myelomeningocele demonstrated impaired level of performance compared to controls when taking cross error into account, but not when considering area error (time, covarying for cross error: t = −3.07, p < .002; time, covarying for area error: p > .1). The shape of the curves in Figures 1 and 2 depicts the differences in the impact of the two error measures on performance. Measures of cross errors are more variable across trials (Figure 1). In addition, despite the group difference in performance at Trial 20, such differences are not evident across the retention trials in the afternoon (Figure 2). In contrast, the measure of performance taking area error into account appears to discriminate level of performance between groups across the afternoon trials.
Spinal Lesion Level
Observed mean values for time, area error, and cross error during the first and last trials of the learning and retention phases, in children with upper and lower spinal lesions, and in typically developing controls, are given in Table 1.
Observed mirror drawing performance during the first and last trials in the morning and afternoon, in typically developing children (control), children with spina bifida myelomeningocele and lower spinal lesions (SB, ≤ L1) and children with spina bifida myelomeningocele and upper spinal lesions (SB, ≥ T12)

During the learning phase in the morning, the pattern of performance was similar for the group with upper spinal lesions and the group with lower spinal lesions. Spinal lesion level did not affect rate of improvement in performance, change in the rate of improvement in performance, or level of proficiency achieved in the morning (p > .1). Both spinal lesion level groups of children with spina bifida myelomeningocele performed more poorly than typically developing children. In the afternoon, there was no difference in savings from Trials 10–11, or in the rate of improvement across trials (p > .1).
Children with lower spinal lesions made more cross errors overall than children with upper spinal lesions or controls (t = −3.10, p < .002; t = −3.02, p < .003, respectively; data not shown). However, area error had a larger impact on the initial level of performance in controls than in children with lower spinal lesions (t = 2.80, p < .0051). Lesion level effects were also evident in the final level of performance. On Trial 20, children with lower spinal lesions were slower than controls, taking cross error into account (Figure 3; t = −3.19, p < .0015), whereas children with upper spinal lesions were not (Figure 3; p > .05).

Mid-sagittal view of the brain in representative control and spina bifida cases. Top left: representative control (volume = 153.2 cm3); Top right: spina bifida myelomeningocele, smallest cerebellum (volume = 7.8 cm3); Bottom left: spina bifida myelomeningocele, representative cerebellum (volume = 116.8 cm3); Bottom right: spina bifida myelomeningocele, largest cerebellum (volume = 152.9 cm3).
Cerebellar Volumes
Examples of cerebellar dysmorphology in children with spina bifida myelomeningocele are shown in Figure 3. Measures of cerebellar volume by region and tissue type are given in Table 2, which shows that children with spina bifida myelomeningocele have smaller cerebellums than controls. Comparisons of regional differences in cerebellar volumes were made using Group × Region (medial, lateral) × Tissue Type repeated measures ANOVA. Controls had significantly more grey matter and white matter volumes in the lateral cerebellum, and more CSF in the medial cerebellum, compared to children with spina bifida myelomeningocele [repeated measures ANOVA, Group × Region × Tissue Type interaction: F(2,54) = 32.68, p < .001; Bonferroni-corrected post-hoc comparisons, p < .001].
Cerebellar volumes (cm3) by region and tissue type in children with spina bifida myelomeningocele (n = 43) and in typically developing controls (n = 14)

Structure–Function Correlations
In order to assess the relationship between cerebellar dysmorphology and motor skill learning in children with spina bifida myelomeningocele, we used Pearson correlations to compare the individual cerebellar volumetric data with the parameters of the mirror draw model in which individual differences were found. The parameters we correlated were performance on Trial 1, rate of improvement in performance across the morning trials, and the change in rate of improvement in performance across the morning trials. None of these individual learning parameters was significantly correlated with any of the cerebellar volumetric measures.
DISCUSSION
In the present study, we explored performance in a motor skill learning task and its relation to cerebellar dysmorphology in children with spina bifida myelomeningocele. The results bear on the following issues: motor learning and motor execution in children with spina bifida myelomeningocele; importance of methods and analytic procedures to distinguish between learning and performance; genetic–embryological heterogeneity in spina bifida myelomeningocele and motor learning; similarities and differences between children and adults in mirror draw tasks; and the relative roles of the cerebellum and other brain structures in motor learning.
Children with spina bifida myelomeningocele appeared able to acquire and retain the mirror drawing task as well as typically developing children. Despite an initially lower level of performance, they learned normally. Specifically, the children with spina bifida myelomeningocele in our study demonstrated poorer initial performance on the mirror draw task, even though they showed faster changes in the rate of improvement as learning proceeded. To be sure, the change in rate of improvement over time does not represent more efficient learning in children with spina bifida myelomeningocele; rather, the steeper learning curve arose because these children, starting from a relatively lower level than controls, had a greater performance range to traverse in order to reach a developmentally typical performance level.
Distinguishing between learning and performance on tasks such as mirror drawing requires measures that evaluate these constructs separately. Level of performance may be evaluated by measures of speed and/or accuracy on each trial, with the speed–accuracy trade-off being considered to represent learning. To measure learning, increases in speed must not be associated with corresponding decreases in accuracy. However, the speed–accuracy trade-off itself is a measure of performance efficiency, rather than learning. By modeling individual change over time, the present study allows us to compare learning, rate of learning, and performance between groups.
On mirror draw tasks, both learning and performance may be measured in a number of ways. Published studies of mirror drawing operationally define performance accuracy as the number of cross errors per trial. However, cross errors are thought to be related to smoothness of movement trajectories (Sanes et al., 1990), and may reflect the quick continuous movements typically used in other studies. Because we emphasized accuracy rather than speed on this task, the measure of cross error may not be a sufficiently sensitive index of accuracy. Number of cross errors may reflect effortful tracing, and may not be related to an inability to learn the appropriate direction to trace. In contrast, the measure of the area traced outside the borders of the star provides a measure of the adjustment of movement in response to feedback from the reflection in the mirror, and more clearly demonstrates the deficit in level of performance in children with spina bifida myelomeningocele. Our finding that area error has a larger impact on initial performance in typically developing children supports the use of both error measures in studies of mirror drawing.
Children with spina bifida myelomeningocele appear able to learn tasks requiring the integration of proprioceptive information and distorted visual input; for example, they have no deficits relative to controls on two motor adaptation tasks, weight biasing and prismatic distortion (Colvin et al., 2003). The finding of intact learning on the mirror draw task is in agreement with studies showing other forms of motor learning to be appropriately developed in this population. The issue of why children with spina bifida myelomeningocele might be able to learn tasks such as prismatic distortion and mirror drawing may be clarified by our data on group differences by spinal lesion level. Within the spina bifida myelomeningocele population, higher spinal lesions are typically associated with more motor and cognitive deficits than are lower lesions (e.g., Wills, 1993); in addition, children with upper lesions, including those in the present study, have more extensive dysmorphologies of the midbrain and cerebellum than do those with lower lesions (described in detail in Fletcher et al., in press). Despite this, our children with upper spinal lesions performed the task more quickly and made fewer cross errors than those with lower spinal lesions. If the role of the cerebellum is to monitor movement based on proprioceptive feedback (Jueptner & Weiller, 1998), then an attenuated sensitivity to mirror-reversed visual input may perhaps, paradoxically and contrary to our initial hypothesis, result in better task performance. In support of this idea, adult patients with more severe cerebellar disease (olivopontocerebellar atrophy) show smoother mirror drawing than do patients with less severe disease (cerebellar atrophy), perhaps because they have no conflict between proprioceptive input and mirror-reversed visual information (Sanes et al., 1990). However, it should also be noted that the number of participants with upper level lesions was relatively small, and the selection criteria for the study eliminated more children with upper than lower level lesions reflecting the association of higher lesions with poorer cognitive and motor development.
The neural basis of motor learning in children with neurodevelopmental disorders has not been studied as extensively as it has in adult patients with cerebellar lesions. In adults, the cerebellum is reported to be involved in motor learning and timing (Desmond & Fiez, 1998; Doyon et al., 2003; Jueptner & Weiller, 1998; Laforce & Doyon, 2001, 2002; Pascual-Leone et al., 1993; Sanes et al., 1990). Adult survivors of childhood cerebellar tumors have increased psychophysical duration discrimination thresholds in short-duration timing tasks similar to those reported in adults with cerebellar lesions (Hetherington et al., 2000). We have recently shown such impairments in children with spina bifida myelomeningocele as well (Dennis et al., 2004). In contrast, motor learning itself does not seem to be impaired, either on our mirror draw task, or on weight biasing or prism distortion (Colvin et al., 2003), two motor adaptation tasks thought to involve the cerebellum (Weiner et al., 1983). One possibility is that the cerebellar contribution to motor learning differs in children and adults, although two pieces of evidence temper this conclusion. Some reports suggest little cerebellar contribution to motor learning in adults (e.g., Harris et al., 2001; Seidler et al., 2002; Timmann et al., 1996). Perhaps more important, reports in adults have not distinguished performance and learning with sufficient precision to delineate the separate cerebellar contributions to each component. In the present study, this distinction was significant: motor impairment affected level of performance but did not affect learning.
Results of the present study are not consistent with the idea of a simple linear relationship between cerebellar volume and motor learning. To be sure, our measures of the cerebellum concern volumes (i.e., structure) and the relationship between mirror drawing and cerebellar function (e.g., fMRI) remain to be studied. While it is possible that the cerebellum plays a role in the initial level of performance of motor tasks, such as mirror drawing, improvement with practice (i.e., learning) is likely mediated by other brain regions such as the basal ganglia (Doyon et al., 2003; Milner et al., 1998). It is unknown whether these effects on motor learning are specific to mirror drawing and motor adaptation, or can be generalized to other forms of procedural learning. For example, the role of the cerebellum in classical conditioning of the eyeblink reflex has been well-established in both animal and human populations (Clark et al., 2002; Ohyama et al., 2003). Because the cerebellum is involved in perception of short-duration time intervals around .5 s, one possibility is that the cerebellum is necessary for learning tasks that involve coincident detection of stimuli that occur within those time intervals, as is the case with the conditioned eye-blink reflex, or other forms of classical conditioning (Milner et al., 1998). The finding of increased psychophysical duration discrimination thresholds in children with spina bifida myelomeningocele (Dennis et al., 2004) and adult survivors of childhood cerebellar tumors (Hetherington et al., 2000), raises the possibility that deficits in learning associated with eye-blink conditioning are a consequence of the short time interval during which conditioned and unconditioned stimuli are presented, and may not reflect a more general role for the cerebellum in motor learning. Evidence of impaired eye-blink conditioning in adolescent twins with ataxia telangiectasia (Mostofsky et al., 1999), a neurodevelopmental disorder that involves cerebellar degeneration, is consistent with this idea.
Overall, the results of the present study show dissociations between motor performance and motor learning in mirror drawing. Our data add to the information about motor function in children with spina bifida myelomeningocele, who show poorer levels of performance, but intact learning on the mirror drawing task. Furthermore, mirror drawing performance was related to the level of spinal cord lesion, which adds to the emerging information showing that genetic–embryological heterogeneity within the spina bifida myelomeningocele condition is one determinant of neurobehavioral function.
ACKNOWLEDGMENTS
The authors wish to thank Joanne Robitaille, Jennifer Janes, Andrea Martin, Amy Boudousquie, Irene Townsend, and Susan Inwood. This work was funded by the National Institute of Child Health and Human Development Grant P01 HD35946 to Jack M. Fletcher “Spina Bifida: Cognitive and Neurobiological Variability.”
References
REFERENCES
Anderson, E.M. &
Plewis, I.
(1977).
Impairment of a motor skill in children with spina bifida cystica
and hydrocephalus: An exploratory study.
British Journal of Psychology,
68,
61–70.CrossRefGoogle Scholar
Barkovich, A.J.
(1995).
Pediatric neuroimaging
(2nd ed.).
New York:
Raven Press.
Brandt, M.E.,
Bohan, T.P.,
Kramer, L.A., &
Fletcher, J.M.
(1994).
Estimation of CSF, white and gray matter volumes in hydrocephalic
children using fuzzy clustering of MR images.
Computerized Medical Imaging Graphics,
18,
25–34.CrossRefGoogle Scholar
Brandt, M.E.,
Bohan, T.P.,
Thorstad, K.,
Beaver, S.R.,
Davidson, K.C.,
Francis, D.J.,
Kramer, L.A., &
Fletcher, J.M.
(1996).
Reliability of brain structure morphometry in hydrocephalic
children using MR images.
Magnetic Resonance Imaging,
14,
649–655.CrossRefGoogle Scholar
Brandt, M.E.,
Fletcher, J.M., &
Bohan, T.P.
(1992).
Estimation of CSF, white, and gray matter volumes from MRIs of
hydrocephalic and HIV-positive subjects.
Proceedings of SimTec/WNN,
643–650.
Clark, R.E.,
Manns, J.R., &
Squire, L.R.
(2002).
Classical conditioning, awareness, and brain systems.
Trends in Cognitive Sciences,
6,
524–531.CrossRefGoogle Scholar
Colvin, A.N.,
Yeates, K.O.,
Enrile, B.G., &
Coury, D.L.
(2003)
Motor adaptation in children with myelomeningocele: Comparison to
children with ADHD and healthy siblings.
Journal of the International Neuropsychological Society,
9,
642–652.CrossRefGoogle Scholar
del Bigio, M.
(1993)
Neuropathological changes caused by hydrocephalus.
Acta Neuropathologica,
18,
573–585.CrossRefGoogle Scholar
Dennis, M.,
Edelstein, K.,
Hetherington, R.,
Copeland, K.,
Frederick, J.,
Blaser, S.E.,
Kramer, L.A.,
Drake, J.M.,
Brandt, M., &
Fletcher, J.M.
(2004)
Neurobiology of perceptual and motor timing in children with spina
bifida in relation to cerebellar volume.
Brain,
127,
1292–1301.CrossRefGoogle Scholar
Dennis, M.,
Hetherington, C.R.,
Spiegler, B.J., &
Barnes, M.A.
(1999).
Functional consequences of congenital cerebellar dysmorphologies
and acquired cerebellar lesions of childhood. In
S.H. Broman &
J.M. Fletcher (Eds.),
The changing nervous system: Neurobehavioral consequences of early
brain disorders (pp.
172–198).
New York:
Oxford University Press.
Desmond, J.E. &
Fiez, J.A.
(1998).
Neuroimaging studies of the cerebellum: language, learning, and
memory.
Trends in Cognitive Sciences,
2,
355–362.CrossRefGoogle Scholar
Doyon, J.,
Penhune, V., &
Ungerleider, L.G.
(2003).
Distinct contribution of the cortico–striatal and
cortico–cerebellar systems to motor skill learning.
Neuropsychologia,
41,
252–262.CrossRefGoogle Scholar
Fletcher, J.M.,
Bohan, T.P.,
Brandt, M.E.,
Kramer, L.A.,
Brookshire, B.L.,
Thorstad, K.,
Davidson, K.C.,
Francis, D.J.,
McCauley, S.R., &
Baumgartner, J.E.
(1996)
Morphometric evaluation of the hydrocephalic brain: Relationships
with cognitive development.
Child's Nervous System,
12,
192–199.CrossRefGoogle Scholar
Fletcher, J.M.,
Copeland, K.,
Frederick, J.,
Blaser, S.E.,
Kramer, L.A.,
Hannay, H.J.,
Brandt, M.E.,
Francis, D.J.,
Villarreal, G.,
Drake, J.M.,
Laurent, J.,
Townsend, I.,
Inwood, S.,
Boudousquie, A., &
Dennis, M.
(under review).
Spinal lesion level in spina bifida meningomyelocele: A source of
neural and cognitive heterogeneity.
Neurosurgery.
Fletcher, J.M.,
Dennis, M., &
Northrup, H.
(2000)
Hydrocephalus. In
K.O. Yeates,
M.D. Ris, &
H.G. Taylor (Eds.),
Pediatric neuropsychology: Research, theory and practice (pp.
25–46).
New York:
Guilford Press.
Fletcher, J.M.,
Francis, J.,
Thompson, N.M.,
Davidson, K.C., &
Miner, M.E.
(1992).
Verbal and nonverbal skill discrepancies in hydrocephalic children.
Journal of Clinical and Experimental Neuropsychology,
14,
593–609.CrossRefGoogle Scholar
Gabrieli, J.D.E.,
Corkin, S.,
Mickel, S.F., &
Growdon, J.H.
(1993).
Intact acquisition and long-term retention of mirror-tracing skill
in Alzheimer's disease and in global amnesia.
Behavioral Neuroscience,
107,
899–910.CrossRefGoogle Scholar
Gerig, G.,
Kubler, O.,
Kikinis, R., &
Jolesz, F.A.
(1992).
Nonlinear anisotropic filtering of MRI data.
IEEE Transactions Medical Imaging,
11,
221–232.CrossRefGoogle Scholar
Harris, I.M.,
Fulham, M.J., &
Miller, L.A.
(2001).
The effects of mesial temporal and cerebellar hypometabolism on
learning and memory.
Journal of the International Neurosychological Society,
7,
353–362.CrossRefGoogle Scholar
Hetherington, R.,
Dennis, M.,
Spiegler, B.
(2000).
Perception and estimation of time in long-term survivors of
childhood posterior fossa tumors.
Journal of the International Neuropsychological Society,
6,
682–692.CrossRefGoogle Scholar
Jueptner, M. &
Weiller, C.
(1998).
A review of differences between basal ganglia and cerebellar
control of movements as revealed by functional imaging studies.
Brain,
121,
1437–1449.CrossRefGoogle Scholar
Laforce, R. &
Doyon, J.
(2002).
Differential roles for the striatum and cerebellum in response to
novel movements using a motor learning paradigm.
Neuropsychologia,
40,
512–517.CrossRefGoogle Scholar
Laforce, R. &
Doyon, J.
(2001).
Distinct contribution of the striatum and cerebellum to motor
learning.
Brain and Cognition,
45,
189–211.CrossRefGoogle Scholar
Miall, R.C. &
Reckess, G.Z.
(2002).
The cerebellum and the timing of coordinated eye and hand tracking.
Brain and Cognition,
48,
212–226.CrossRefGoogle Scholar
Milner, B.,
Squire, L.R., &
Kandel, E.R.
(1998).
Cognitive neuroscience and the study of memory.
Neuron,
20,
445–468.CrossRefGoogle Scholar
Mostofsky, S.H.,
Green, J.T.,
Meginley, M.,
Christensen, J.R., &
Woodruff-Pak, D.S.
(1999).
Conditioning in identical twins with ataxia-telangiectasia.
Neurocase,
5,
425–433.CrossRefGoogle Scholar
Ohyama, T.,
Nores, W.L.,
Murphy, M., &
Mauk, M.D.
(2003).
What the cerebellum computes.
Trends in Neurosciences,
26,
222–227.CrossRefGoogle Scholar
Pao, Y.H.
(1989).
Adaptive pattern recognition and neural networks.
Reading, MA:
Addison Wesley.
Park, C.H.,
Stewart, W.,
Khoury, M.J., &
Mulinare, J.
(1992).
Is there etiologic heterogeneity between upper and lower neural
tube defects?
American Journal of Epidemiology,
136,
1491–1493.Google Scholar
Pascual-Leone, A.,
Grafman, J.,
Clark, K.,
Stewart, M.,
Massaquoi, S.,
Lou, J.S., &
Hallett, M.
(1993).
Procedural learning in Parkinson's disease and cerebellar
degeneration.
Annals of Neurology,
34,
594–602.CrossRefGoogle Scholar
Sanes, J.N.,
Dimitrov, B., &
Hallett, M.
(1990).
Motor learning in patients with cerebellar dysfunction.
Brain,
113,
103–120.CrossRefGoogle Scholar
Seidler, R.D.,
Purushotham, A.,
Kim, S.-G.,
Ugurbul, K.,
Willingham, D., &
Ashe, J.
(2002).
Cerebellum activation associated with performance change but not
motor learning.
Science,
296,
2043–2046.CrossRefGoogle Scholar
Singer, J.D.
(1998).
Using SAS PROC MIXED to fit multilevel models, hierarchical models,
and individual growth models.
Journal of Educational and Behavioral Statistics,
24,
323–355.CrossRefGoogle Scholar
Swanson, J.M.
(1992).
School-based assessments and interventions for ADD students.
Irvine, CA:
KC Publishing.
Thach, W.T.
(1998).
What is the role of the cerebellum in motor learning and
cognition?
Trends in Cognitive Sciences,
2,
331–337.Google Scholar
Thorndike, R.L.,
Hagen, E.P., &
Sattler, J.M.
(1986).
The Stanford-Binet Intelligence Scale
(4th ed.).
Itasca, IL:
Riverside.
Timmann, D.,
Shimansky, Y.,
Larson, P.S.,
Wunderlich, D.A.,
Stelmach, G.E., &
Bloedel, J.R.
(1996).
Visuomotor learning in cerebellar patients.
Behavioral Brain Research,
81,
99–113.CrossRefGoogle Scholar
Van der Put, N.M.,
van Straaten, H.W.,
Trijbels, F.J., &
Blom, H.J.
(2001).
Folate, homocysteine and neural tube defects: An overview.
Experimental Biological Medicine,
226,
243–270CrossRefGoogle Scholar
Volcik, K.A.,
Blanton, S.H., &
Northrup, H.
(2001).
Examinations of methylenetetrahydrofolate reductase C677T and
A1298C mutations and in utero viability.
American Journal of Human Genetics,
69,
1150–1153.CrossRefGoogle Scholar
Weiner, M.J.,
Hallett, M., &
Funkenstein, H.H.
(1983).
Adaptation to lateral displacement of vision in patients with
lesions of the central nervous system.
Neurology,
33,
766–772.CrossRefGoogle Scholar
Wills, K.E.
(1993).
Neuropsychological functioning in children with spina bifida
and/or hydrocephalus.
Journal of Clinical Child Psychology,
22,
247–265.CrossRefGoogle Scholar

Mirror drawing performance in children with spina bifida (filled squares) and in typically developing controls (open squares). Top: Average tracing time per trial (s; M ± SEM). Middle: Average area error on each trial (cm2; M ± SEM). Bottom: Average number of cross errors on each trial (counts; M ± SEM).
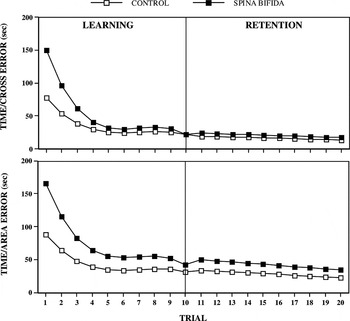
Mirror drawing performance in children with spina bifida (filled squares) and in typically developing controls (open squares), based on the linear model of individual change over time fit to the observed data. Top: Predicted values for time in seconds, taking cross errors into account at each trial. Bottom: Predicted values for time in seconds, taking area errors into account at each trial (see Methods).

Observed mirror drawing performance during the first and last trials in the morning and afternoon, in typically developing children (control), children with spina bifida myelomeningocele and lower spinal lesions (SB, ≤ L1) and children with spina bifida myelomeningocele and upper spinal lesions (SB, ≥ T12)
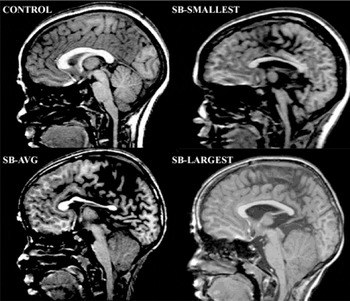
Mid-sagittal view of the brain in representative control and spina bifida cases. Top left: representative control (volume = 153.2 cm3); Top right: spina bifida myelomeningocele, smallest cerebellum (volume = 7.8 cm3); Bottom left: spina bifida myelomeningocele, representative cerebellum (volume = 116.8 cm3); Bottom right: spina bifida myelomeningocele, largest cerebellum (volume = 152.9 cm3).
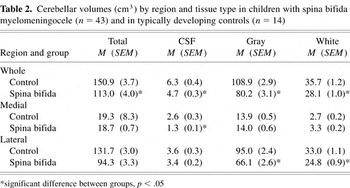
Cerebellar volumes (cm3) by region and tissue type in children with spina bifida myelomeningocele (n = 43) and in typically developing controls (n = 14)
 You have
Access
- 33
- Cited by