1. Introduction
The new mechanists in philosophy of science emphasize the role of mechanisms in generating biological phenomena. They have commonly construed mechanisms as discrete entities that operate individually to generate a given phenomenon (e.g., the synthesis of proteins). But these primary mechanisms are often subject to control by other mechanisms. The activity of some mechanisms exercising control over other mechanisms often becomes apparent in the context of disease in which changes in control mechanisms cause primary mechanisms to behave in aberrant ways. This is especially true in the case of cancer. Cancer cells maintain themselves as living systems in a radically transformed state not by creating new primary mechanisms but by taking advantage of already existing primary mechanisms and controlling them in new ways.Footnote 1 By directing researchers to the control mechanisms that are altered in cancer, cancer research has highlighted just how abundant and complex these control mechanisms are. In this article I draw upon cancer research to develop the distinction between primary and control mechanisms, characterize how the two types of mechanisms are related, and argue for the importance of understanding control mechanisms within a network perspective.
To understand the role of mechanisms performing control operations on other mechanisms requires expanding the characterization of mechanisms as parts and operations organized to generate a phenomenon. In section 2 I offer a framework for understanding the components of mechanisms as constraints, some of which are flexible and able to be operated on and altered by other mechanisms. In section 3, I provide a characterization of cancer as manifest in the altered control of ordinary cell mechanisms, drawing on what Hanahan and Weinberg (Reference Hanahan and Weinberg2000, Reference Hanahan and Weinberg2011) termed the hallmarks of cancer. In section 4 I develop how these hallmarks stem from alterations in control systems operative in cells that in turn act on the constraints in primary mechanisms. In section 5 I focus in greater detail on the particular control systems affecting glucose metabolism in cancer cells. The individual control pathways discussed in sections 4 and 5 interact with each other in numerous ways. Thus, in section 6 I turn to how this points to a need to shift from a focus on control pathways that are individually interpretable as mechanisms to a focus on control networks in which multiple control mechanisms are embedded.
2. Rethinking Biological Mechanisms: Constraints and Control
The now standard view of biological mechanisms construes them as consisting of entities or parts, each performing an activity or operation, organized so as to produce a phenomenon (Machamer, Darden, and Craver Reference Machamer, Darden and Craver2000; Bechtel and Abrahamsen Reference Bechtel and Abrahamsen2005). On this view, a biological mechanism, much like human-made machines, is an enduring system that awaits its start-up conditions and then carries out its activities until it reaches its termination condition. The only changes are the regular changes that occur along the way from start to termination conditions. In previous work (Bechtel and Abrahamsen Reference Hieke2010, Reference Hieke2013), I have emphasized the dynamic character of mechanisms—they are not static systems awaiting input but endogenously change states due to the nonlinear, nonsequential organization implemented in them. None of these discussions, however, have emphasized that biological mechanisms are highly controlled systems. Some accounts have described control mechanisms, such as neural mechanisms (Craver Reference Craver2007) or circadian clocks (Bechtel and Abrahamsen Reference Bechtel, Abrahamsen, Leitgeb and Hieke2009), but these accounts have simply looked at control mechanisms in their own right and have not emphasized how they exercise control over other mechanisms.
To characterize control, it is helpful to begin with a modified perspective on mechanisms. Mechanisms perform work, and this requires both a source of free energy and ways to direct it so as to carry out work. Adopting the language of classical mechanics, several theorists have characterized what directs the flow of free energy as constraints (Pattee and Rączaszek-Leonardi Reference Pattee and Rączaszek-Leonardi2012; Hooker Reference Hooker2013). The concept of constraints was introduced into classical mechanics to account for the behavior of macroscale objects. Constraints, generally in the form of chemical bonds between particles, reduce the degrees of freedom in which individual particles can move, either by eliminating motion along one or more degrees of freedom or by coupling values that can be taken on two or more degrees of freedom. In contexts in which there is a source of free energy, such constraints can serve to channel the flow of free energy. For example, a pipe can restrict water, which would otherwise spread, to flow in one direction. If a pipe is directed downward toward the earth’s surface, then the free energy available in water entering the top of the pipe can perform the work of carving out a gully at the bottom.
As Hooker (Reference Hooker2013) emphasizes, although the term constraint connotes restriction or limitation, constraints also create possibilities. In the previous example, a further series of pipes can constrain the flow of water so as to rotate a mill wheel and perform the work of grinding grain. Likewise, the constraints that fix the structure of a protein enable it to catalyze specific reactions by bringing reactants into close proximity so that available free energy creates or breaks chemical bonds. In general, components of biological mechanisms (as well as human-built machines) serve to constrain the flow of available free energy so that work is performed. When enzymes bind with adenosine triphosphate (ATP), for example, they hydrolyze it and direct the free energy that is released to carry out coupled reactions. Stated in the more traditional vocabulary introduced by the mechanists in philosophy of science, the organization of components into mechanisms constrains free energy so as to perform the work required to generate particular phenomena.
Machines and biological mechanisms constrain free energy to perform work, but unless this activity can be controlled, the work will not be useful. If a user cannot turn off a machine, it will continue to perform its activity, even if that is no longer useful, until it depletes the source of free energy. To control a machine, some constraints in it must be flexible, capable of being operated on by something external. Most machines include switches that allow users to turn them off by stopping the flow of free energy. A switch is a constraint that can be altered by work performed on it. In human-made machines, the human user typically performs the work of flipping a switch. Some constraints may take a continuum of values as work is performed on them, leading to variable activity of the machines. For example, how far the driver of a car depresses the accelerator pedal determines the opening of the valve that constrains the flow of gasoline into the engine and consequently how fast the car moves. In some human-built machines the control process is internalized. The governor Watt designed for the steam engine, for example, relies on negative feedback to alter the flexible constraint realized in a valve in the steam pipe, reducing or increasing the flow of steam so as to keep the engine operating at the same speed. Control, then, requires a second mechanism (e.g., the driver of the car or the Watt governor) to operate on a flexible constraint in the primary mechanism that is directing the flow of free energy. The control mechanism itself requires constraints that direct free energy to perform its work, although it generally requires much less energy than the primary mechanism employs to do its work.
As important as control mechanisms are in human-built machines, they are even more important in the case of biological mechanisms. Organisms are far-from-equilibrium systems that, unless they perform the work required to build and repair their own parts, will dissipate (Moreno and Mossio Reference Moreno and Mossio2015). Specialized mechanisms carry out the construction and repair processes. If they are to keep the organism functioning, these mechanisms must be controlled so as to perform their activities when they are needed. Doing so at other times can be just as bad as not performing them when they are required. An effective control mechanism, accordingly, does not just operate on a flexible constraint in another mechanism but must do so in response to a condition that requires the primary mechanism to operate in a particular manner. A control mechanism thus contains a detector that constrains its operation.
An important challenge in understanding the functioning of biological mechanisms is to figure out how they are controlled by other mechanisms that perform work on the flexible constraints within them. However, identifying control mechanisms is often difficult.Footnote 2 There are well worked out heuristics for decomposing and explaining the functioning of primary mechanisms (Craver and Darden Reference Craver and Darden2013), and mechanistic philosophers have discussed these in their accounts of discovering the mechanisms of protein synthesis (Darden and Craver Reference Darden and Craver2002) and metabolism (Bechtel Reference Bechtel2006). These accounts, however, have been silent about control processes, in part because they are typically not active in the experimental setups used to study primary mechanisms. These procedures keep conditions constant and prevent control from altering the mechanism’s operation. Diseases, however, are contexts in which these control mechanisms are often manifest, as a diseased cell is typically one in which a control system has been altered. Recent research on cancer is unusually informative in this regard, so I turn to it in the next section.
3. Cancer and Its Hallmarks
The role of control operating on constraints leading to abnormal operation of cell mechanisms can be seen by examining what Hanahan and Weinberg (Reference Hanahan and Weinberg2000, Reference Hanahan and Weinberg2011) characterize as “six hallmarks of cancer—distinctive and complementary capabilities that enable tumor growth and metastatic dissemination”: (1) sustaining proliferative signaling, (2) evading growth suppressors, (3) resisting cell death, (4) enabling replicative immortality, (5) inducing angiogenesis, and (6) activating invasion and metastasis. Each hallmark involves a phenomenon exhibited in normal cells but which occurs with increased or decreased frequency in cancer cells because of altered control operating on the responsible mechanism.
The first hallmark is perhaps the most widely recognized characteristic of cancer—cancer cells proliferate, replicating in an uncontrolled fashion. Normal somatic cells divide as well, but after the developmental stage, they reach a homeostatic state. Control mechanisms shut down division unless the cell receives a signal, such as TGF-α, indicating a need for the cell to replicate. In cancer cells this control is removed, and cells continue to proliferate independently of such signals. The second hallmark is closely related. Cells in normal tissue do not just fail to receive signals to proliferate but actively suppress proliferation in response to other signals, such as TGF-β. Antigrowth signals can block proliferation through a control mechanism that forces cells into a quiescent state in which the cell cycle stops except when the cell receives a signal to proliferate. By altering control mechanisms, cancer cells not only initiative division on their own but also escape the effects of mechanisms that would normally suppress proliferation.
The third hallmark is that cancer cells shut down normal cell processes that enable recycling of damaged or unneeded biological structures. When a cell is too disrupted to continue normal function, control mechanisms typically activate primary mechanisms that perform apoptosis or programmed cell death. Over the course of 30–120 minutes, a bevy of these mechanisms within the cell are turned on to dismantle the cell by disrupting its membrane, breaking down the cytoplasmic and nuclear skeletons, extruding the cytosol, degrading the chromosomes, and fragmenting the nucleus. Nearby cells then engulf the remains. While apoptosis and necrosis eliminate cells, the process of autophagy recycles components within cells either when they are no longer needed or when they are damaged (Feng et al. Reference Feng, He, Yao and Klionsky2014). In the course of autophagy, intracellular vesicles, autophagosomes, envelop organelles such as mitochondria and ribosomes and then merge with lysosomes that degrade the enclosed organelle into its molecular components, which are then reused in biosynthetic processes. By interfering with the control mechanisms that activate these processes, cancer cells avoid these fates that normally befall disrupted cells and cell components and continue to maintain themselves and proliferate.
The fourth and fifth hallmarks involve altering control mechanisms to reactivate cellular processes that are normally down-regulated in mature somatic cells. In multicellular organisms, Hayflick and Moorhead (Reference Hayflick and Moorhead1961) discovered that human embryonic cells only divide a limited number of times and then enter into a senescent state. The number of possible divisions is known as the Hayflick limit, which was subsequently found to correlate with an already known process of telomere shortening. In each cell replication, telomere repeats are removed. When the last telomeres are removed, the ends of chromosomal DNA fuse. Stem cells provide an exception to the progressive removal of telomeres. In stem cells, the enzyme telomerase adds rather than removes telomeres. Telomerase is down-regulated in most somatic tissue, but in cancer, as in stem cells, telomerase is activated, allowing cells to acquire replicative immortality.
The fifth hallmark involves inhibiting the control mechanism that in mature cells turns off the embryonic processes of generating new vasculature, needed to provide oxygen and nutrients and remove waste products. One of these processes, angiogenesis, involves sprouting new vessels from ones already generated. Once development is complete, control mechanisms generally block angiogenesis, allowing it to occur only transiently in contexts such as wound healing and female reproductive cycling. When this suppression is inhibited in cancer, the mechanism of angiogenesis continually generates new vessels to support the ongoing proliferation of cells.
The last hallmark of cancer, invasion of other tissue and metastasis, reverses the control mechanisms that keep somatic cells in a quiescent state adhering to epithelial cell sheets. This enables the cancer cell to reactivate mechanisms that are normally active only in development. Since these control mechanisms were mostly discovered by developmental biologists, not cancer researchers, I will not focus on this hallmark.
4. Cancer Hallmarks Reveal Control Mechanisms in Normal Cells
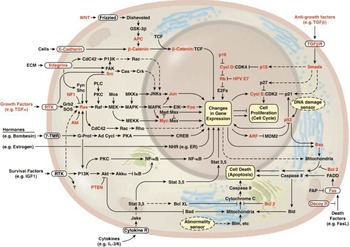
So far I have appealed to the hallmarks of cancer to identify the existence of control mechanisms that are altered in cancer, without going into any details about how they operate. But cancer research has also revealed many of the parts and operations constituting these control mechanisms. In this section I discuss how, starting from identification of genes that are often mutated in cancer, researchers identified the parts and operations of numerous of these control mechanisms. (The control mechanisms consist of proteins coded for by the genes, but researchers often find it convenient to skip over the steps of transcription and translation and simply slide between referring to genes and proteins. I follow that practice.) As a reference point for subsequent discussions, I reproduce a wiring diagram of the most prominent control circuits (from Hanahan and Weinberg Reference Hanahan and Weinberg2000, fig. 2; see fig. 1) that presents the largely sequential pathways of reactions that constitute the control mechanisms that regulate particular primary cell mechanisms in normal cells that are altered in the hallmarks of cancer.
Hanahan and Weinberg’s representation of pathways regulating normal cells that are mutated in cancer. The proteins coded by the best known oncogenes (Ras, Myc) and tumor suppressor genes (p53 and PTEN) are shown in red. Reprinted with permission from Elsevier (Hanahan and Weinberg Reference Hanahan and Weinberg2000, fig. 2).

Discovery of these mechanisms began with the discovery of a few genes that were frequently mutated in cancer cells. Research in the 1960s–80s resulted in the identification of Hras and Kras as the first oncogenes—genes that when mutated initiate the progression into cancer (Ellis et al. Reference Ellis, Defeo, Shih, Gonda, Young, Tsuchida, Lowy and Scolnick1981). Other research during the same time identified different genes, starting with Rb, whose products normally serve to suppress development of cancer but when mutated allow cancer to develop (Murphree and Benedict Reference Murphree and Benedict1984). These came to be known as tumor suppressor genes. In the attempt to understand how those genes functioned in control mechanisms, research revealed many other genes/proteins with which they interacted, ultimately identifying pathways—sequences of reactions, each producing a product that is an input to the next reaction. These pathways correspond closely to philosophical accounts that view mechanisms as proceeding from “start or set-up to finish or termination conditions” (Machamer et al. Reference Machamer, Darden and Craver2000, 3). Research on other biological mechanisms, such as those involved in extracting energy from metabolites, also revealed pathways. The pathways consisting of the proteins coded for by genes mutated in cancer, however, are not involved directly in metabolizing foodstuffs or synthesizing biological structures but in controlling these primary mechanisms.
I begin with control mechanisms that normally prevent cell division except when the cell receives signals from its environment that indicate a need for division. Mutations to the two oncogenes Hras and Kras led to proliferation. To determine how, researchers first identified a number of other proteins with which they interact: Raf, MEK, MAPK, and so on. These interact sequentially in the pathway shown on the left in figure 1. For signaling along this pathway to result in proliferation, the signal must be maintained. This challenged researchers to determine how the Ras proteins generate a sustained signal. They discovered that Ras proteins actively transduce signals when they form complexes with guanosine triphosphate (GTP). Normal Ras proteins function as GTPases and hydrolyze bound GTP into guanosine diphosphate (GDP). When GDP replaces GTP, Ras no longer transduces signals. This reveals that Ras normally exercises control by functioning as a switch that turns itself off by hydrolyzing GTP to GDP, thus ensuring that the proliferation signal is active for only a short period (Vetter and Wittinghofer Reference Vetter and Wittinghofer2001). The mutations that turn Ras genes into oncogenes impair the ability of the resulting proteins to function as GTPases, thus blocking the switching operation that would normally abort signaling. A switch operates on a flexible constraint through which the work of a mechanism can be changed. This is the first of several switches revealed by cancer research that, when disrupted, result in the hallmarks of cancer.
Another example of a switch is found in the control mechanism shown in the lower left in figure 1. When survival factors such as the insulin-like growth factor-1 receptor (IGF1) bind to receptor tyrosine kinase (RTKs), they activate Phosphoinositide 3-kinase (PI3-kinase), which in turn initiates separate proteolytic cascades leading to replication and angiogenesis. Normally PTEN (phosphatase and tensin homologue) degrades the immediate product of PI3-kinase, phosphatidylinositol (3,4,5) trisphosphate (PIP3) to PIP2, switching off the signaling. When PTEN is mutated, however, this switching does not occur, leading to continual replication and angiogenesis.
Research on tumor suppressor genes—genes whose products normally prevent development of tumors but when mutated allow tumors to develop—revealed other control mechanisms disrupted in cancer. Two of the best studied tumor suppressor proteins are Rb (retinoblastoma associated) and TP53. Rb (shown center top of the nucleus in fig. 1) integrates signals mostly from extracellular sources (especially growth inhibitory signals) and gates whether the cell can proceed through the cell cycle (Burkhart and Sage Reference Burkhart and Sage2008). TP53 (right side of the nucleus in fig. 1, where it is designated just as P53), however, responds to stress and indicators of abnormal operation of cell mechanisms and, depending on severity, blocks further progression of the cell cycle (senescence) or initiates apoptosis.
To illustrate this process in more detail, I focus on control over apoptosis, for which research has revealed a complex control system. The components of the apoptosis mechanism (the proteases caspase 3–7) are already in place in mitochondria in normal cells but limited by a flexible constraint from initiating their apoptotic activities until they bind with either Caspase 8 or Caspase 9. The availability of Caspase 9 is further controlled by another flexible constraint, an “apoptotic trigger” involving counterbalanced pro- and anti-apoptotic members of the Bcl-2 family of regulatory proteins. Members of the Bcl-2 family inhibit Caspase 9 by binding to and suppressing the activity of Bax and Bak. Bax and Bak are embedded in the outer mitochondrial membrane and, when not suppressed, disrupt the integrity of the outer mitochondrial membrane. This causes the release of cytochrome c and Apaf-1 that together activate Caspase 9. More recent research has revealed even more complexity in the mechanism. Both Bcl-2, which suppresses the trigger, and Bax and Bak, which activate the trigger, possess protein-protein interaction domains known as BH3 motifs (Lowe, Cepero, and Evan Reference Lowe, Cepero and Evan2004). The proteins that determine the setting of the switch and thus whether apoptosis occurs each contain a single BH3 that enables them to bind either with Bcl-2 or with Bax and Bak (Willis and Adams Reference Willis and Adams2005; Adams and Cory Reference Adams and Cory2007). Control is thus achieved by proteins operating on flexible constraints in the control mechanisms that subsequently affect flexible constraints in the mechanisms carrying out apoptosis.
Whereas apoptosis dismantles whole cells to provide resources to other cells, autophagy dismantles and recycles organelles such as mitochondria and ribosomes within cells. Like apoptosis, it is a process that can contribute to fighting cancer. The autophagy mechanism normally operates at a low level, only dismantling poorly functioning organelles by enveloping them and then fusing with a lysosome to dismantle them. Control mechanisms operate on the autophagy mechanism to increase its activity under stress conditions such as nutrient deprivation (Mizushima Reference Mizushima2007). Beclin-1, a member of the BH3-only family discussed above as controlling apoptosis, is also a key element in controlling autophagy. It is normally bound to Bcl-2, but when its stress sensors are activated, it uncouples from Bcl-2 to initiate autophagy. Thus, stress conditions in the cell resulting from early progression to cancer can trigger autophagy as a defense mechanism. Accordingly, one of the common steps in the development of cancer involves disabling the control mechanisms that initiate autophagy (White et al. Reference White, Karp, Strohecker, Guo and Mathew2010). But ironically, autophagy can also be invoked to protect cancer cells when they are placed in stress conditions as a result of nutrient deprivation, radiotherapy, or cytotoxic drugs. This can result in cancer cells shrinking into a state of reversible dormancy, enabling tumors to grow again after treatment with anticancer drugs has ceased (White and DiPaola Reference White and DiPaola2009).
In this section I have identified several control mechanisms of normal cells that, when altered, result in particular hallmarks of cancer. Except for the last, each of these involves control pathways shown in figure 1. Two central points emerge from this discussion. In each case the mechanisms being regulated reside in normal cells and are active in appropriate conditions in these cells. Turning these mechanisms on in cancer requires modifying the control mechanisms that normally turn them off. Second, in each case there are multiple control factors, typically operating sequentially in pathways that result in altering the functioning of the primary cell mechanisms.
5. Cancer and Metabolic Regulation
Several of the control mechanisms I have discussed so far operate several steps removed from the primary mechanisms they control. Glucose metabolism provides a useful example in which research has revealed how control mechanisms act on primary mechanisms. The primary mechanism for metabolizing glucose was largely characterized in the 1930s through the work of Embden, Meyerhof, and others (Needham Reference Needham1971; Fruton Reference Fruton1972; Bechtel Reference Bechtel2006). (The key operations are shown in the vertical pathway of reactions in fig. 3.) Clues to its altered functioning in cancer were already available when Warburg (Reference Warburg1930, Reference Warburg1956) reported that cancer cells exhibit a marked increase in glucose consumption compared with normal cells. Moreover, Warburg noted that cancer cells often secrete large quantities of lactate, a product of glucose metabolism that is usually depleted through the subsequent mechanism of oxidative metabolism.Footnote 3 Since glycolysis only generates two molecules of ATP per molecule of glucose compared with the 36 molecules of ATP generated in oxidative metabolism, the energy harvested is massively reduced in cancer cells. Warburg assumed that mitochondria, in which oxidative metabolism is carried out through the tricarboxylic acid (TCA) cycle, are damaged in cancer cells and that this forced cancer cells to rely totally on glycolysis. However, subsequent studies found that the mitochondria in most cancer cells are fully functional. This revealed that the reliance on glycolysis without continuing to oxidative metabolism was due to altered control in the case of cancer.Footnote 4
Cancer researchers have identified two points at which the glycolytic mechanism is altered in cancer. At the beginning of the pathway the uptake of glucose by the cell is increased, and at the end of the process the products of glucose metabolism are redirected away from the TCA cycle. These are two points at which there are flexible constraints that are the target of control processes. I focus now on control at the beginning of the pathway and return to control at the end of the pathway below.
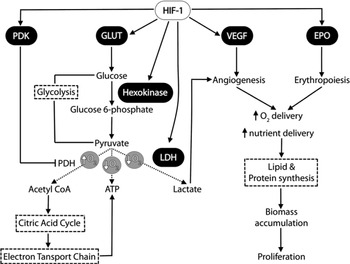
Glucose transporter 1 (GLUT1) is the enzyme that transports glucose across the cellular membrane. The rate at which it does so is controlled by hypoxia inducible factor-1 (HIF-1), which alters the rates both of the expression and the translocation of the GLUT1 protein from the endomembrane to the cell surface. This, however, is not the only point at which HIF-1 alters constraints in glycolysis. As shown in figure 2, it also binds to and so alters the operation of many of the enzymes in the glycolytic pathway itself (Semenza Reference Semenza2010; I return to the other functions of HIF-1 shown in fig. 2). In normal cells, oxygen, when it is available, renders HIF-1 unstable so that it is broken down by the ubiquitin-proteasome pathway. As a result, glucose uptake is normally reduced when oxygen is available. The lack of oxygen in hypoxia leaves HIF-1 in place, resulting in an increase in glycolysis. Thus, HIF-1 operates as a switch controlled by oxygen, yielding increased glycolysis in conditions in which it is the only source of free energy. In cancer this control process is disrupted so that HIF-1 is no longer degraded by oxygen and continues to maintain high rates of glycolysis.
Role of HIF-1 in regulating cell process. Reprinted by permission from Springer Nature (Courtnay et al. Reference Courtnay, Ngo, Malik, Ververis, Tortorella and Karagiannis2015, fig. 2).

The reliance on the far less efficient process of glycolysis rather than oxidative metabolism in cells needing energy to proliferate at first seems counterintuitive. Potter (Reference Potter1958) proposed an explanation: the intermediates of glycolysis also figure in metabolic reactions that produce other molecules used to synthesize various biological compounds (e.g., fatty acids, cholesterol, nucleotides) needed in proliferating cells. Vander Heiden, Cantley, and Thompson (Reference Vander Heiden, Cantley and Thompson2009) have revived and further developed Potter’s proposal. The arrows projecting horizontally from the intermediates glucose-6-phosphate, fructose-6-phosphate, dihydroxyacetone-phosphate (DHA-P), and 3-P-glycerate in figure 3 indicate reactions that synthesize other biological compounds. For example, the first reaction product in the pathway, glucose-6-phosphate, feeds into the pentose phosphate pathway (PPP), in which glucose-6-phosphate becomes partially oxidized to yield ribose-5-phosphate, which in turn is a constituent of nucleotides. The alteration of the control mechanisms that initiate glycolysis also increases the generation of these other products (Pavlova and Thompson Reference Pavlova and Thompson2016). Cancer, once again, alters control mechanisms to increase reliance on primary mechanisms that normal cells also use, albeit more sparingly.
Glycolytic pathway and the tricarboxylic acid cycle. GLUT1 transports glucose into the cytoplasm where it can enter the glycolytic pathway. Red horizontal arrows identify alternative pathways from key intermediates in glycolysis that are activated in aerobic glycolysis. Other key regulators such as PKM2 are shown in blue. Reprinted with permission from Elsevier (Pavlova and Thompson Reference Pavlova and Thompson2016, fig. 4).

I have focused on only one of several points of control in the glycolytic mechanism that are altered in cancer. Individual enzymes in the glycolytic pathway are also regulated, including phosphofructokinase, which catalyzes the key irreversible step from fructose-6-phosphate to fructose-1,6-pyrophosphate. Rather than developing these, I turn briefly to regulation at the end of the pathway. Even with control mechanisms that increase the shunting of glycolytic intermediates into alternative pathways, a good deal of phosphoenolpyruvate is dephosphorylated into pyruvate. If pyruvate dehydrogenase were then to convert pyruvate to acetyl-CoA, it would proceed through the TCA cycle, generating ATP. This would inhibit the action of phosphofructokinase, an allosteric enzyme that is inhibited by ATP, while it also consumed ATP to phosphorylate fructose-6-phosphate. A further function of HIF-1, as shown in figure 2, is to up-regulate pyruvate dehydrogenase kinase 1 (PDK1). As shown in figure 3, PDK1 inhibits pyruvate dehydrogenase and stops entry into the TCA cycle. HIF-1 also up-regulates lactate dehydrogenase (LDH), which converts pyruvate to lactate. This accounts of the accumulation of lactate and its transport out of the cell in cancer.
Research on the control processes through which glucose metabolism is altered in the course of cancer has thus revealed a host of flexible constraints in the glycolytic mechanism on which control can be exercised by other molecules such as HIF-1. In normal cells this control serves to reduce the rate of glycolysis and to direct the product, pyruvate, into the TCA cycle. These control mechanisms are altered by the failure to degrade HIF-1 in the presence of oxygen. As a result, the rate of glycolysis is increased in cancer, and many of its intermediates are used to synthesize other compounds required in cancer cells. By revealing these flexible constraints and the control that can be exercised on them, cancer research provides a different perspective on the glycolytic mechanism. Rather than operating from start to termination conditions whenever glucose is available (and not suppressed by already accumulated ATP),Footnote 5 the glycolytic mechanism is seen to contain a host of flexible constraints that are operated on by various control processes.
6. An Integrated Network of Controllers
The research discussed so far shows that investigating cancer has revealed a plethora of control pathways that when disrupted lead to hallmarks of cancer. As is common in mechanistic research, the investigation started by identifying individual genes that are frequently mutated in cancer (Bechtel and Richardson Reference Bechtel and Richardson2010) and then reasoned forward and backward (Craver and Darden Reference Craver and Darden2013) to identify operations in the control mechanisms. Researchers attempted to organize these operations into pathways characterized by sequences of reactions and then to link these pathways to flexible constraints in primary mechanisms. But this research also reveals that these pathways interconnect. Although figures 1–3 show pathways, they also reveal numerous points of connection. If one follows these out, it becomes apparent that in fact the control systems are not independent but integrated into a single network. In this section I will note a couple of these points of integration and then demonstrate how network analyses are now playing crucial roles in advancing the understanding of both cancer and control in normal cells.
Above I focused on the roles mutated Ras proteins play in promoting proliferation, but they also regulate many other mechanisms responsible for hallmarks of cancer. When the signal they produce is too strong, apoptosis is induced by activating Rb and TP53. In addition, Ras proteins, as well as other proteins coded by oncogenes, up-regulate the gene coding for GLUT1 (Murakami et al. Reference Murakami, Nishiyama, Shirotani, Shinohara, Kan, Ishii, Kanai, Nakazuru and Ebina1992), thereby increasing glycolysis. Ras proteins also figure in the key alternative pathways in glycolysis—in the pentose phosphate pathway, they up-regulate two key enzymes, transketolase-like 1 (TKTL1) and transaldolase (TALDO). These enzymes are in turn suppressed by TP53, so when Ras proteins are sufficiently active so as to activate TP53, it down-regulates these enzymes. Thus, Ras proteins are implicated in proliferation, apoptosis, and altered metabolism.
HIF-1 also figures in control of many cell mechanisms. Above I only addressed the pathways on the left side of figure 2 through which HIF-1 operates to control glycolysis. But the figure also indicates that HIF-1 plays a role in regulating vascular endothelial growth factor (VEGF), which encodes ligands that control new blood vessel growth during embryonic and postnatal development and is up-regulated in hypoxia and cancer (Ferrara Reference Ferrara2009). Thus, it also helps explain the hallmark of angiogenesis. Angiogenesis is also controlled by lactate resulting from the altered control HIF-1 exerts over glycolysis in cancer cells (Végran et al. Reference Végran, Boidot, Michiels, Sonveaux and Feron2011). Finally, HIF-1 up-regulates erythropoietin (EPO), which stimulates production of red blood cells. By controlling these two processes, HIF-1 functions to increase oxygen and nutrient delivery beyond what is required in normal cell function. This research has revealed that HIF-1 performs control operations with respect to a diverse range of cell mechanisms.
Yet another example in which research has pointed to the interaction of control processes is provided by the protein subunit of telomeres, telomere reverse transcriptase (TERT). In addition to its role in adding telomeres and thus defeating the Hayflick limit on cell replication noted above, TERT functions as a cofactor of β-catenin/LEF transcription factor complex that figures in the Wnt pathway (not discussed above but shown in the upper left of fig. 1). The Wnt pathway is important in regulating the cell cycle as it activates replication in stem cells (Park et al. Reference Park, Venteicher, Hong, Choi, Jun, Shkreli, Chang, Meng, Cheung, Ji, McLaughlin, Veenstra, Nusse, McCrea and Artandi2009; Bryja, Červenka, and Čajánek Reference Bryja, Červenka and Čajánek2017). TERT has also been shown to have effects on regulating apoptosis (Kang et al. Reference Kang, Choi, Hong, Kim, Woo, Won, Kim, Jeon, Jo, Kim, Bachoo, Reynolds, Gwag and Lee2004) and DNA-damage repair (Masutomi et al. Reference Masutomi, Possemato, Wong, Currier, Tothova, Manola, Ganesan, Lansdorp, Collins and Hahn2005).
These various findings illustrate something that is already apparent in figure 1: the different pathways involved in control of cell processes are not independent but interact at numerous points. Although the notion of pathway plays an important role when tracing out the individual steps in specific control mechanisms, it does not provide the best way to understand these interactions. Conceptualizing control in terms of networks provides an alternative framework that is increasingly being employed in cancer research to understand control systems that are operative in both cancer and normal cells. Network diagrams consist of nodes and edges, in which nodes stand for various kinds of entities (genes, proteins, etc.), and edges, for various types of interactions between nodes. Pathway analyses can be transformed into network diagrams by abstracting from specific details (fig. 1 effectively does that), but there are other strategies for constructing network models that can yield additional insights into control systems.
Researchers working on model organisms such as yeast have created network diagrams based on a variety of types of gene and protein interaction data. For example, the yeast two-hybrid technique reveals which proteins in a cell are able to form complexes, whereas investigations of synthetic lethality indicate genes that interact in the generation of traits. In Bechtel (Reference Bechtel2017a, Reference Bechtel2017b) I have shown how analyses of these networks have provided new insights into the mechanisms involved in yeast cells.Footnote 6 Similar data are now being generated for human cells, but in the meantime investigators have also found it productive to predict gene and protein interactions on the basis of homology between model organisms and humans. These networks alone do not provide information about where proteins are expressed in cells or the biological processes to which they contribute, crucial for a mechanistic understanding. However, network researchers have developed strategies for annotating these networks with this type of information using resources such as gene ontology (GO; Ashburner et al. Reference Ashburner, Ball, Blake, Botstein, Butler, Cherry, Davis, Dolinski, Dwight, Eppig, Harris, Hill, Issel-Tarver, Kasarskis, Lewis, Matese, Richardson, Ringwald, Rubin and Sherlock2000).Footnote 7
Given the number of interactions between genes and proteins that these techniques reveal, the resulting network diagrams initially appear as hair balls in which no interpretable patterns can be identified. Network researchers have developed a number of analytical tools, available in network representation platforms such as Cytoscape (Shannon et al. Reference Shannon, Markiel, Ozier, Baliga, Wang, Ramage, Amin, Schwikowski and Ideker2003), to make sense of networks. A particularly useful type of analysis that Cytoscape facilitates is identifying clusters in networks—sets of nodes that are especially densely interconnected. Network researchers often interpret dense clusters of highly interconnected nodes in protein-protein interaction networks as mechanisms engaged in particular tasks, whereas connections between these modules are interpreted as vehicles of control. Other tools in Cytoscape that help turn hair balls into interpretable networks are layout algorithms (such as force-based ones that treat edges like springs, pulling connected nodes situated far from each other together and pushing those very close to each other slightly apart) and filtering tools to look selectively at particular nodes and edges.
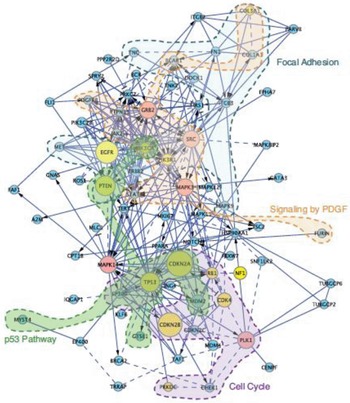
I will present one example in which researchers extended a pathway analysis into a network analysis. From Reactome, a database of pathways, and a variety of resources providing protein and gene interaction data, Wu, Feng, and Stein (Reference Wu, Feng and Stein2010) developed a large network of 10,956 proteins and 209,988 interactions, which they termed the Functional Interaction (FI) network. They used this network to interpret glioblastoma data compiled in the Cancer Genome Atlas’s (TCGA) characterization of 206 glioblastomas (Cancer Genome Atlas Research Network 2008). The researchers identified those proteins in FI that corresponded to genes identified as mutated in at least two TCGA samples. They then included the fewest additional proteins in FI to create a connected network including at least 70% of these altered genes. They proposed that the resulting network, shown in figure 4, is the core subnetwork of mutations in glioblastoma. Since they had begun with a pathway analysis from Reactome, they were able to identify those proteins in their proposed core subnetwork that belonged to four pathways—p53, focal adhesion, signaling by PDGF, and cell cycle pathways. These are shown in shading in figure 4. The figure reveals both that many of the proteins in the network belong to these four pathways and also that these pathways are highly intertwined.
Core subnetwork Wu, Feng, and Stein extracted from the Cancer Genome Atlas’s (TCGA) glioblastoma data with identification of genes in four pathways shown in shaded regions. The color of the nodes indicates genes shared in another sample of glioblastoma tumors (yellow) or not shared (blue). Red indicates those nodes added to connect the network.Node size indicates frequency of mutation in TCGA sample. Reprinted from BioMed Central under the Creative Commons Attribution (CC-BY) license (Wu, Feng, and Stein Reference Wu, Feng and Stein2010, fig. 8A).

Network analyses go beyond the pathway analyses in revealing the interconnected nature of the control mechanisms operative in normal cells and disrupted in cancer. In particular, they provide a strategy to avoid thinking of control in purely hierarchical terms, with controllers residing at a higher level than the processes they control. As noted above, in human-made machines, control processes are organized hierarchically to enable human operators to determine the activity of the machine. But in biological organisms, control mechanisms generally terminate within the organism. Different components of the organism initiate control processes that regulate other components, but this does not lead to a top-level controller overseeing the whole operation. Instead, the research reveals a network in which multiple control mechanisms are embedded and through which they interact. As a result of their interactions, when a gene is mutated, as in cancer, it does not alter the behavior of just one primary mechanism but often a wide range (giving rise to the multiple hallmarks of cancer discussed above).
7. Conclusion
I have presented a range of examples of research on cancer as a way to make clear how complex the control processes operating on mechanisms in living cells are. The hallmarks of cancer identified by Hanahan and Weinberg all involve altered deployments of primary mechanisms that figure in normal cell life. Altered deployment results from changes in control mechanisms that determine when these various primary mechanisms operate. These control mechanisms are productively analyzed in terms of pathways consisting of components that act sequentially on each other. But, as I have tried to illustrate, these pathways often interact with one another, constituting networks. In addition to the primary mechanisms that are responsible for phenomena such as energy procurement and protein synthesis, cells contain complex networks of control mechanisms that operate on flexible constraints in the primary mechanisms. Changes in control mechanisms result in the redeployment of the primary mechanisms to maintain the altered life of a cancer cell.
Philosophical accounts of biological mechanisms have not emphasized control, instead treating mechanisms as operating whenever their start-up conditions are realized (Machamer et al. Reference Machamer, Darden and Craver2000). In this article I have advanced a perspective in which the parts and operations of mechanisms provide constraints that direct the flow of free energy, enabling the mechanism to perform work. Many of the constraints in mechanisms are flexible, capable of being altered through work performed by other mechanisms. These other mechanisms exercise control. They too involve flexible constraints that are capable of being operated on by yet other mechanisms. In human-built machines, such a hierarchy of control mechanisms typically tops out when human agents alter constraints to exercise control. But in biological organisms control processes originate within organisms and enable the primary mechanisms they control to operate appropriately to maintain the organisms. Since these control mechanisms are interconnected, it is helpful to represent them in a network, not a strict hierarchy.
A fundamental lesson to be learned from cancer research is that there is a complex web of control operative on biological mechanisms. The philosophical analysis of mechanisms needs to be extended from focusing exclusively on how primary mechanisms produce the phenomenon for which they are responsible to how they are controlled. This involves identifying flexible constraints and then looking beyond the primary mechanisms to the other mechanisms that operate on those constraints. This presents a challenging new task for those interested in mechanistic explanations in biology: characterizing how control networks are organized in a manner that primary mechanisms produce their phenomena in ways appropriate to maintaining an organism.