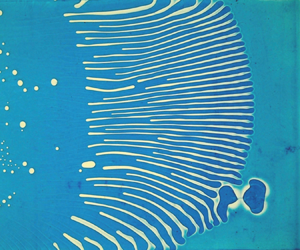



1. Introduction
Adhesion processes are key in numerous engineering and biological situations. The quality of adhesion is generally characterized through the separation of adjacent surfaces linked by a layer of bonding material. Such probe tack tests enable one to extract the rate-dependent work of adhesion (Creton & Ciccotti Reference Creton and Ciccotti2016). The separation process often involves instabilities when the adhesive layer is pulled apart, such as cavitation bubbles (Chiche, Dollhofer & Creton Reference Chiche, Dollhofer and Creton2005) or viscous fingering patterns (Roy & Tarafdar Reference Roy and Tarafdar1996; Nase, Lindner & Creton Reference Nase, Lindner and Creton2008). Viscous fingering has been well documented since the seminal works from Saffman & Taylor (Saffman & Taylor Reference Saffman and Taylor1958; McCloud & Maher Reference McCloud and Maher1995). This instability occurs when a viscous fluid is pushed away by a fluid of lower viscosity in a confined environment such as porous media or parallel plates (Hele-Shaw cell). The morphology of such patterns relies on confinement geometry (Rauseo, Barnes & Maher Reference Rauseo, Barnes and Maher1987; Al-Housseiny, Tsai & Stone Reference Al-Housseiny, Tsai and Stone2012), fluid rheology (Bonn & Meunier Reference Bonn and Meunier1997; Lindner, Coussot & Bonn Reference Lindner, Coussot and Bonn2000; Divoux et al. Reference Divoux, Shukla, Marsit, Kaloga and Bischofberger2020) or surface anisotropy (Ben-Jacob et al. Reference Ben-Jacob, Godbey, Goldenfeld, Koplik, Levine, Mueller and Sander1985). A closely related phenomenon is known as the printer's instability, which consists in the formation of ribbing patterns at the exit of the thin gap between two contra-rotating cylinders coated with a thin liquid film (Pearson Reference Pearson1960; Pitts & Greiller Reference Pitts and Greiller1961; Rabaud, Couder & Michalland Reference Rabaud, Couder and Michalland1991; Rabaud Reference Rabaud1994). Analogous instabilities are also observed when plates separated by a layer of soft elastic material are pulled apart (Adda-Bedia & Mahadevan Reference Adda-Bedia and Mahadevan2006; Biggins et al. Reference Biggins, Saintyves, Wei, Bouchaud and Mahadevan2013). In contrast, the dynamics of formation of adhesive contact has been overlooked. In a series of pioneering observations Zeng et al. (Reference Zeng, Zhao, Tian, Tirrell, Leal and Israelachvili2006, Reference Zeng, Tian, Zhao, Tirrell and Israelachvili2007a,Reference Zeng, Tian, Zhao, Tirrell and Israelachvilib) report the emergence of original fingering patterns during the contact of two spheres coated with a viscous polymer film. However, no quantitative prediction and measure of the fingers’ size was provided. In the past decades, different studies have nevertheless been dedicated to the static pattern exhibited by a thin elastic film joining two solid surfaces (Ghatak et al. Reference Ghatak, Chaudhury, Shenoy and Sharma2000; Mönch & Herminghaus Reference Mönch and Herminghaus2001; Ghatak & Chaudhury Reference Ghatak and Chaudhury2003; Davis-Purcell et al. Reference Davis-Purcell, Soulard, Salez, Raphaël and Dalnoki-Veress2018). As we shall discuss later, the propagation of such fronts may be limited by the amount of fluid available in the thin films. This feature shares some similarity to diffusion-limited combustion fronts which also develop fingering patterns (Zik, Olami & Moses Reference Zik, Olami and Moses1998; Zik & Moses Reference Zik and Moses1999).
In the present paper, we focus on an experiment where two glass plates coated with a thin layer of viscous liquid are brought in contact. Once contact has nucleated, an unstable front propagates. What sets the adhesion dynamics? What are the characteristic size and time scales involved in the transient pattern? We address these questions through model experiments and scaling law analysis. We first present the experimental set-up and typical patterns of the adhesion front, and propose a qualitative mechanism to explain the formation of fingers. We then describe the geometric features of the observed patterns. We finally discuss the characteristic sizes and time scales involved in the dynamics of the adhesion front.
2. Experimental set-up
2.1. Preliminary experiment: contact of two adhesive plates
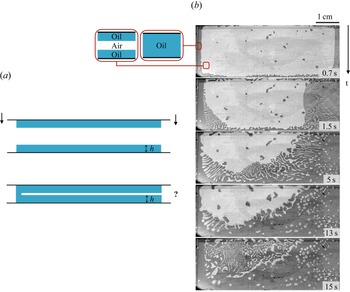
We first conduct the preliminary experiment depicted in figure 1(a) (see supplementary movie 1 available at https://doi.org/10.1017/jfm.2022.789): two glass plates both covered with a thin film of silicone oil are brought into contact in a roughly parallel fashion. The fluid layers have a thickness  $h \sim 100\,\mathrm {\mu }$m and the oil viscosity is
 $\eta = 50$ mPa s. When put into contact, the oil layers start bridging in random places and the boundaries of the merged regions progressively invade the whole domain. Figure 1(b) shows successive top views of the experiment. In this configuration, the set-up is lit from above and image contrast results from reflection: the areas where oil layers have merged appear dark, while clear regions correspond to the remaining air gap. Shortly after contact, the front destabilizes into oil fingers separated by air channels. As these fingers propagate, the apparent area of air reduces gradually, leaving trapped bubbles at the end of the experiment. In this uncontrolled set-up, the patterns appear disorganized, both in time and space. Although locally regular, the propagation direction of the fingers is random on a large scale. Moreover, the dynamics is unsteady: in this particular example, the adhesion front almost stops after
 $13$ s, before suddenly restarting. Nevertheless, this preliminary experiment reveals a regular pattern formation at small scale. In order to study quantitatively this new fingering phenomenon, we propose a better controlled wedge geometry for which the space–time dynamics is regular at large scale.
Preliminary experiment. (a) Side view: two glass plates covered with a thin layer of silicone oil of thickness  $h$ (in blue) are brought into contact. (b) Top view: areas where oil layers have merged appear dark, while clear regions correspond to the remaining air gap (see supplementary movie 1). The time since the first contact is indicated on the bottom right of the images.

2.2. Controlled experiment: adhesion front in a wedge
The controlled set-up (figure 2a) is composed of two glass plates of thickness  $4$ mm, length
 $20$ cm and width
 $10$ cm, forming a wedge of angle
 $\alpha$. The plates are covered with a thin layer of silicone oil of surface tension
 $\gamma \simeq 20\,{\rm mN}\,{\rm m}^{-1}$ and viscosity
 $\eta$ ranging from 50 to
 $1000$ mPa s. The coating is prepared by spreading a puddle of oil with a threaded roll along lateral adhesive tapes used as spacers. The uniformity of the coating is controlled with a confocal displacement sensor (CL-PT010 from Keyence). The thickness
 $h$ of the oil layer is adjusted by varying the number of adhesive tapes separating the roll from the plate. In order to limit squeeze flows when the opposite plates are put in contact, a band of width
 $19$ mm along the edge of the plates is not coated. This pristine region is obtained by placing a tape before coating and removing it prior to experiment. At the beginning of an experiment, the upper plate is placed over the lower one along one edge, while the plates are separated by a spacer at the opposite extremity (figure 2a).
(a) Side view of the experimental set-up. Two glass plates covered with a thin layer of silicone oil of thickness  $h$ (in blue) form a sharp wedge of angle
 $\alpha$ adjusted with a spacer. An adhesion front immediately forms at a distance
 $x_0$ from the apex of the wedge. For
 $x > x_0$, the viscous films are separated by an air layer of thickness
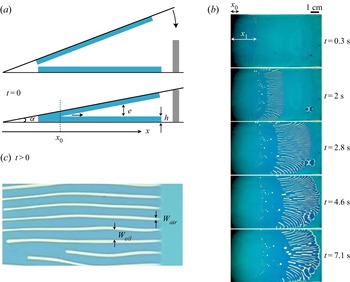
 $e(x)\simeq \alpha (x-x_0)$ that has to be filled to achieve the adhesion. (b) Successive top views of an experiment conducted with dyed silicone oil of viscosity
 $\eta \simeq 50$ mPa s with layers of thickness
 $h \simeq 100\,\mathrm {\mu }$m (see also supplementary movie 2). The apex of the wedge of angle
 $\alpha \simeq 0.07{{}^{\circ } }$ is located along the left boundary of the pictures. The front quickly destabilizes into oil fingers separated by air channels. This pattern propagates towards the right and grows in length before slowly relaxing, eventually trapping small air bubbles between the plates. (c) Zoom on the destabilized front region, with the definitions of the widths
 $W_{oil}$ and
 $W_{air}$ of the oil fingers and air channels, respectively.

Experimentally, the coating of the upper plate is prone to destabilization through Rayleigh–Taylor instability with a typical time scale  $\tau _{RT}\sim {12\eta \gamma }/{h^{3}\rho ^{2} g^{2}}$ where
 $\rho$ is the density of the fluid and g is the acceleration of gravity (Fermigier et al. Reference Fermigier, Limat, Wesfreid, Boudinet and Quilliet1992). In order to study the adhesion front dynamics without any interference from Rayleigh–Taylor instability, we chose our parameters such that the time scale for an experiment is much shorter than
 $\tau _{RT}$. As a consequence, the maximum thickness of the coating films and the minimum viscosity were selected to be
 $h=125\,\mathrm {\mu }$m and
 $\eta =50$ mPa s, leading to
 $\tau _{RT}\sim 60$ s, much larger than the instability time scale (of the order of a few seconds). Moreover, gravity drainage along the upper plate of length
 $L$ occurs at even larger time scale
 $\eta L/\rho g h^{2} \sin \alpha \sim 5$ h. Within this range of thickness, we observed regular instability patterns for wedge angles typically lower than
 $0.3 {{}^{\circ } }$, while the lowest angle that could be achieved with our set-up was of the order of
 $0.07 {{}^{\circ } }$. For thick films and angles larger than
 $0.3 {{}^{\circ } }$, the instability starts, but the fingers barely grow. In the following study, we focus on the regime of well-developed patterns for
 $\alpha \leq 0.25 {{}^{\circ } }$.
Figure 2(b) shows successive top views of an experiment performed with silicone oil coloured with blue dye from Esprit Composite (see also supplementary movie 2). The plates are coated with films of initial thickness  $h \simeq 100\,\mathrm {\mu }$m and viscosity
 $\eta \simeq 50$ mPa s. The apex of the wedge of angle
 $\alpha \simeq 0.07{{}^{\circ } }$ is located along the left boundary of the images. When the plates are brought into contact, the layers merge rapidly within a region of finite size
 $x_0$ from the apex. Although a stripe of width
 $19$ mm has been carefully left pristine in the vicinity of the wedge to limit the overlap between the opposing layers, the position of the initial contact
 $x_0$ is prone to scatter due to unavoidable squeeze flow in this region. From there on, an air layer of thickness
 $e(x) \simeq \alpha (x-x_0)$ separates the facing layers, and the adhesion front moves forward from
 $x_0$ away from the apex. This front quickly destabilizes at a position
 $x_1$ from the apex, and leads to the formation of oil fingers separated by air channels of widths
 $W_{oil}$ and
 $W_{air}$ respectively, as depicted in figure 2(c). In this configuration, the set-up is lit from underneath. The intensity of the oil colouring reflects the local oil thickness: deep blue corresponds to merged layers while light blue corresponds to the initial oil layers and white to air channels or bubbles.
As the tips of the fingers move faster than their rear, the length of the fingers increases. Later on, the tips of the fingers decelerate and eventually stop. In the meantime, the rear of the fingers keeps moving forward, reducing gradually the length of the fingers. At the end of the experiment the adhesion front recovers a smooth profile. During the retraction process, air channels tend to breakup into small bubbles, due to Rayleigh–Plateau instability, as often seen in microfluidic devices (Hashimoto et al. Reference Hashimoto, Garstecki, Stone and Whitesides2008; Guillot et al. Reference Guillot, Ajdari, Goyon, Joanicot and Colin2009). These bubbles tend to slowly escape the most confined region of the wedge (Reyssat Reference Reyssat2014).
3. Results and discussion
At first glance, this instability could seem similar to the classical Saffman–Taylor instability, as suggested by Zeng et al. (Reference Zeng, Zhao, Tian, Tirrell, Leal and Israelachvili2006, Reference Zeng, Tian, Zhao, Tirrell and Israelachvili2007a). However, the standard criterion for viscous fingering would lead to a stable front since, here, viscous oil pushes away a low viscosity fluid (Saffman & Taylor Reference Saffman and Taylor1958; Pelcé Reference Pelcé2012). Moreover, in our configuration, the plates are not parallel as in the usual Hele-Shaw cell configuration. The effect of gradients of confinement in viscous fingering has recently been explored. When the displaced fluid does not wet the wall (as air in our situation), an opening gap tends to stabilize the front (Al-Housseiny et al. Reference Al-Housseiny, Tsai and Stone2012). Classical printer's instability also leads to ribbing patterns when a roller or spreader pushes a slab of viscous fluid at a fixed distance from a plane (Pearson Reference Pearson1960) or when a fluid is entrained between counter-rotating cylinders (Pitts & Greiller Reference Pitts and Greiller1961; Rabaud Reference Rabaud1994). However, this instability, as well as viscous fingering, is triggered by an imposed pressure gradient, which is not the case in our configuration. Beyond viscous fingering or printer's instabilities, detergency effects in a gradient of confinement may also induce a capillary instability (Keiser et al. Reference Keiser, Herbaut, Bico and Reyssat2016). However, this last mechanism is not relevant to the current configuration as oil perfectly wets the wall and tends to remain trapped in the wedge. The formation of fingers is therefore driven by a mechanism distinct from the Saffman–Taylor or confinement gradient instabilities.
3.1. Qualitative mechanism
In order to bridge opposing surfaces, liquid must creep from ahead of the front to fill the air gap between the plates. If the front remained straight, its propagation would require the suction of fluid further ahead of the front. In this scenario, the thin coating films would soon become depleted ahead of the front, whose propagation would be severely hindered. Conversely, the formation of oil fingers leads to a partial bridging of the facing plates, which only requires local motion of the liquid from the films to the fingers. Indeed, we observe (figure 2c) that the regions between adjacent oil fingers appear clearer, indicating that the initial oil coating has been extracted laterally to form fingers. As the fingers propagate, the coating liquid separating them tends to drain out, leading to air channels. We do not observe any appreciable depletion of the coating films ahead of the tips when fingers move forward. However, a depleted zone quickly appears when the fingers cease to progress, as evidenced by the white line in the vicinity of the tips in the bottom image of figure 2(b).
This fingering mechanism is reminiscent of another instability observed by Zik et al. in the diffusion-limited combustion of sheets of paper confined in a horizontal Hele-Shaw geometry (Zik et al. Reference Zik, Olami and Moses1998; Zik & Moses Reference Zik and Moses1999). As our adhesion front requires liquid to fill the air gap, the propagation of a combustion front relies on oxygen feeding. When the flux of oxygen is high enough, a straight front can propagate regularly, consuming oxygen ahead of it. However, reducing the flux prevents complete combustion from occurring and can induce the formation of ‘paper fingers’. Similarly to our mechanism, such fingers consume the oxygen available at the side of their tip and leave unconsumed ‘paper channels’ as they propagate.
3.2. Pattern geometry
As illustrated in figure 2(c) two main length scales describe the pattern morphology: the width  ${W_{{oil}} }$ of the oil fingers and the width
 ${W_{{air}} }$ of the air channels.
3.2.1. Width of oil fingers
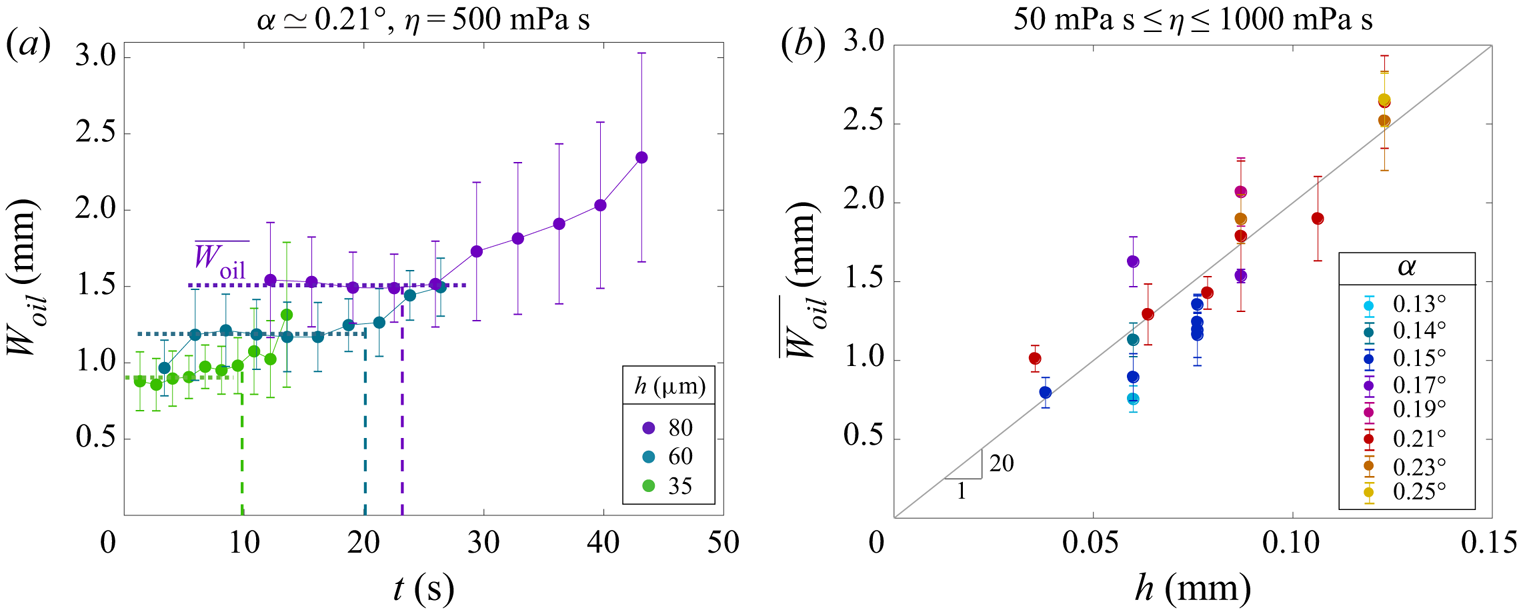
Figure 3(a) shows the width of the oil fingers  $W_{{oil}}$ as a function of time for experiments conducted with a wedge of angle
 $\alpha \simeq 0.21 {{}^{\circ } }$ and layers of thickness
 $h \simeq$ 35, 60 and
 $80\,\mathrm {\mu }$m. The vertical dashed lines indicate the time at which the fingers cease to extend. Beyond this point, the fingers begin to retract and their length decreases. As shown in figure 3(a), the width is approximately constant during the extension phase. It seems that the time-averaged width
 $\overline {W_{{oil}}}$ is of the order of 20
 $h$, as seen in figure 3(b). Once the fingers have reached their maximum position, their tip tends to retract and widen. Eventually fingers coalesce, leaving entrapped bubbles (figure 2b).
(a) Finger width  ${W_{{oil}} }$ averaged over several fingers as a function of time for experiments conducted with an angle
 $\alpha \simeq 0.21{{}^{\circ } }$, layers of thickness
 $h \simeq 35\,\mathrm {\mu }$m (green),
 $60\,\mathrm {\mu }$m (blue) and
 $80\,\mathrm {\mu }$m (purple), of viscosity
 $\eta = 500$ mPa s. The vertical dashed lines indicate the time at which the fingers have ceased to extend. As their width is nearly constant during the extension phase, the corresponding mean value
 $\overline {W_{{oil}}}$ is computed for each experiment. (b) Mean finger width
 $\overline {W_{{oil}}}$ during the extension phase as a function of the layer thickness
 $h$ for experiments performed with angles
 $\alpha$ ranging from 0.13
 ${{}^{\circ } }$ to 0.25
 ${{}^{\circ } }$, layers of thickness
 $h$ ranging between 60 and
 $123\,\mathrm {\mu }$m and viscosity
 $\eta$ = 50, 500 or
 $1000$ mPa s. The continuous line has a slope of 20.

3.2.2. Width of air channels
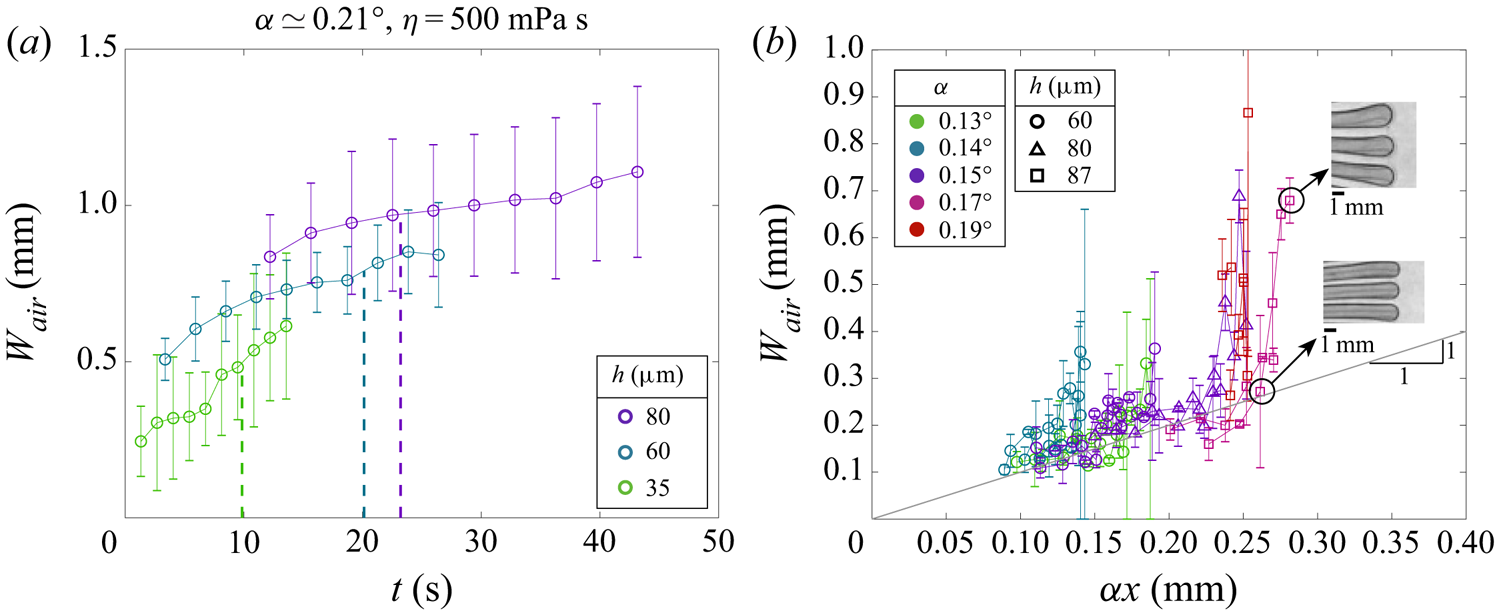
Figure 4(a) shows the width of the air channels  ${W_{{air}} }$ as a function of time for an angle
 $\alpha \simeq 0.21 {{}^{\circ } }$ and different layer thicknesses. For a given time and a given thickness of the coating layer, we observe that air channels are narrower than fingers. Contrary to the fingers, the width of air channels
 ${W_{{air}} }$ increases over time. When
 ${W_{{air}} }$ is plotted as a function of the distance from the apex, we evidence that the width of the channels is set by the local distance between the plates
 \begin{equation} {W_{{air}} } \simeq \alpha x. \end{equation}
In other words, the section of air channels is basically circular in the stage when the front propagates. These channels eventually tend to widen after the front reaches its maximal position.
(a) Width of air channels averaged over several channels  ${W_{{air}} }$ as a function of time for experiments performed with
 $\alpha \simeq 0.21 {{}^{\circ } }$ and layers of thickness
 $h \simeq 35\,\mathrm {\mu }$m (green),
 $60\,\mathrm {\mu }$m (blue) and
 $80\,\mathrm {\mu }$m (purple). (b) Width of air channels displayed as a function of the spacing of the plates
 $\alpha x$ at the tip of the fingers. When the fingers stop their progression, the average width of the air channels tends to increase, as illustrated in the upper snapshot, which results in vertical spikes in the plot.

3.3. Speculative scenario
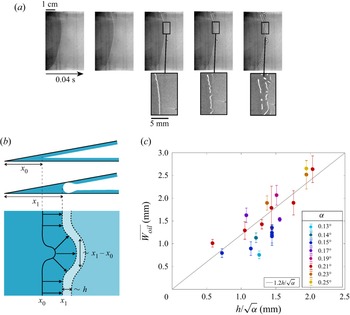
In this section, we suggest a preliminary explanation for the selection of the oil and air finger widths based on our experimental observation of the initial steps of the propagation of the front (figure 5a).
(a) Starting from an initial contact point of position  $x_0$, an initially smooth adhesion front propagates. As the front feeds from the liquid films coating the plates, these films are quickly depleted. White stripes are observed in the vicinity of the front beyond the position
 $x_1$. (b) Top: ideal configuration where the liquid films form a perfect wedge at a distance
 $x_0$ from the apex of the cell. A straight front then propagates, feeding itself from the films up to a distance
 $x_1$ where the films neighbouring the front are depleted. Beyond
 $x_1$, the front is expected to propagate through fingers feeding laterally and leaving air channels. Bottom: growth of a circular protrusion emerging as a perturbation, viewed from above. The maximum width of this protrusion is proportional to the displacement of the front
 $x_1-x_0$. (c) Experimental values of
 $\overline {W_{{oil}}}$ as a function of
 $h/\sqrt {\alpha }$.

A front initiates at a finite distance  $x_0$ from the apex of the wedge. In the very first stages of its progression, the front may remain smooth while a depleted region forms ahead of it (white stripe in transmitted light imaging). The front destabilizes at a position
 $x_1$ close to
 $x_0$ and organized lateral fingers progressively emerge. This pattern later evolves into more regular longitudinal fingers.
To interpret this sequence, we consider an ideal configuration where the liquid coatings initially form a perfect wedge (figure 5b, top). In this ideal geometry, the oil layers merge at a distance  $x_0$ from the edge of the plates, where the distance between the glass plates is
 \begin{equation} x_0 = \frac{2 h}{\alpha}. \end{equation}
From this position, a smooth front propagates, until the formation of fingers at a distance  $x_1$ from the apex. This distance can be understood as the distance at which the propagation of a straight front is expected to stop. We would expect the front to stop when the size of the dimple becomes comparable to
 $h$. Assuming a circular dimple (figure 5b, bottom), the total liquid volume (per unit width) used to reach this configuration is of the order of
 $h^{2}$. Moreover, a volume fills the initial air gap between
 $x_0$ and
 $x_1$ that is of the order of
 $(x_1-x_0)^{2} \alpha / 2$, leading to a scaling
 \begin{equation} x_1 - x_0 \sim \frac{h}{\sqrt{\alpha}}. \end{equation}
With typical values  $h = 100 \,\mathrm {\mu }$m and
 $\alpha = 0.2^{\circ }$, we obtain
 $x_1-x_0 \sim 2$ mm, which is much smaller than
 $x_0 \sim 60$ mm. If a protrusion emerges spontaneously as a perturbation of the front profile and grows as a portion of a disk by feeding on the surrounding film, the maximum width of this protrusion should be also set by the distance
 $x_1-x_0$. Beyond
 $x_1$, the only possibility for the front to progress is to form oil fingers separated by air channels. We thus expect the width of the growing fingers to follow the same scaling
 \begin{equation} {W_{{oil}} } \sim \frac{h}{\sqrt{\alpha}}. \end{equation}
In figure 5(c),  $\overline {W_{{oil}}}$ is plotted as a function of
 $h/\sqrt {\alpha }$. Although data are still scattered as in figure 3(b), the slope is now of order 1, in agreement with (3.4). Probing this scenario more thoroughly would require experiments over a wider range of
 $\alpha$ (in particular smaller values), which is beyond our experimental capabilities. Numerical simulation could be an interesting tool to further explore this prediction.
3.4. Finger dynamics
We now focus on the dynamics of the fingers. The time evolution of the distance  $x$ from the edge of the plates to the tip of the fingers is plotted in figure 6(a) for an experiment conducted with
 $\eta = 500$ mPa s,
 $\alpha \simeq 0.21 {{}^{\circ } }$ and
 $h \simeq 80\,\mathrm {\mu }$m. The fingers initially move relatively rapidly and progressively slow down until reaching a maximum position
 ${x_{max} }$ at a characteristic rest time
 $\tau$. The front starts at a finite distance
 $x_0$ from the apex that will be taken as a reference position for the front.
(a) Position  $x$ of the front as a function of time for an experiment performed with
 $\eta = 500$ mPa s,
 $\alpha \simeq 0.15 {{}^{\circ } }$ and
 $h \simeq 80\,\mathrm {\mu }$m. The initial position of the front
 $x_0$ is geometrically set by the overlap of the coating layers when the wedge is closed at the beginning of the experiments. The fingers’ tips reach their maximum position
 ${x_{max} }$ at a characteristic time
 $\tau$. (b) Relative position
 $x - x_0$ of the front as a function of time for experiments conducted with
 $\eta =500$ mPa s,
 $\alpha \simeq 0.15 {{}^{\circ } }$ and layers of thickness
 $h \simeq$ 35, 60 and
 $80\,\mathrm {\mu }$m. The continuous line in this log–log scale has a slope 1/2.

In an ideal configuration,  $x_0$ should follow (3.2). Due to imperfections of the coating of the plates, the experimental value of
 $x_0$ tends to differ from this geometrical definition. Figure 6(b) compares the finger dynamics, relative to
 $x_0$, for experiments performed with
 $\eta = 500$ mPa s,
 $\alpha \simeq 0.15 {{}^{\circ } }$ and layers of thickness
 $h \simeq$ 35, 60 and 80
 $\,\mathrm {\mu }$m. For each experiment, we observe that the relative position evolves as
 $t^{1/2}$ before saturation. Moreover, the relative position
 $x(t)-x_0$, the maximal position
 ${x_{max} }-x_0$ and the saturation time
 $\tau$ all increase with the layer thickness
 $h$.
We interpret these observations with simple scaling arguments. The capillary pressure  $-\gamma /h$ in the fingers acts over a scale
 $h$ in the thin film, leading to a typical pressure gradient
 $\boldsymbol {\nabla } p \sim \gamma /h^{2}$. On the other hand, the viscous force density scales as
 $\eta v /h^{2}$, where
 $v$ is the typical flow velocity of the liquid in the vicinity of the tip. Therefore, the balance of these two terms yields
 $v \sim \gamma / \eta$. The finger velocity
 $V_{{tip}}= {\rm d}(x-x_0)/{\rm d}t$ is then inferred from flux conservation. In the reference frame of the tip, as sketched in figure 7(a), the flux entering the tip, typically
 $h{W_{{oil}} }v$, compensates for the disappearing air gap
 $e{W_{{oil}} }V_{{tip}}$, leading to
 \begin{equation} h {W_{{oil}} } \frac{\gamma}{\eta} \sim e {W_{{oil}} } \frac{{\rm d}(x-x_0)}{{\rm d}t}. \end{equation}
As the thickness of the air gap follows  $e(x) = \alpha (x- x_0)$, (3.5) can be integrated
 \begin{equation} x-x_0 \sim \left( \frac{\gamma h}{\eta \alpha} t\right)^{1/2}. \end{equation}
Equation (3.6) is in good qualitative agreement with the data shown in figure 6(b). Figure 7(b) shows the dimensionless position of the fingers  $(x-x_0)\alpha /h$ as a function of the dimensionless time
 $(\gamma \alpha /\eta h) t$, for various experiments performed with oils of viscosity ranging from 50 to 1000 mPa s, films thickness from 60 to
 $125\,\mathrm {\mu }$m and wedge angle from
 $0.13^{\circ }$ to
 $0.25^{\circ }$.
(a) Top and cross-sectional views of the cell as the liquid finger moves forward (in the reference frame of the finger). In the vicinity of the finger tip, the low pressure in the meniscus induces a flow from the feeding film to the finger characterized by a typical velocity  $v\sim \gamma /\eta$. The velocity of the finger
 $V_{tip}$ is deduced from flow conservation
 $h{W_{{oil}} }v \sim e{W_{{oil}} }V_{tip}$ leading to
 $x-x_0\sim (\gamma ht/\eta \alpha )^{1/2}$. (b) Normalized position of the front as a function of normalized time for experiments performed with angles
 $\alpha$ ranging from 0.13
 ${{}^{\circ } }$ to
 $0.25 {{}^{\circ } }$, layers of thickness
 $h$ ranging from 60 to
 $125\,\mathrm {\mu }$m and viscosities
 $\eta =$ 50, 500 or
 $1000$ mPa s. The black line corresponds to
 $(x-x_0)\alpha /h = 0.5(\gamma \alpha t/\eta h)^{1/2}$. The grey area indicates time scales smaller than
 $\eta h / \gamma \alpha$ (typically 1 s), which correspond to the setting phase of the experiment.

Although some scattering is observed, all experimental data tend to collapse onto the same master curve corresponding to (3.6). We interpret the scatter as a high sensitivity to initial conditions, in particular to the value selected for  $x_0$. The black curve in figure 7(b), in fair agreement with the experiments, corresponds to
 \begin{equation} (x-x_0)\frac{\alpha}{h} = 0.5 \left( \frac{\gamma \alpha}{\eta h} t\right)^{1/2}. \end{equation}
3.5. End of propagation
The evolution of the width of air channels with the distance from the apex  ${W_{{air}} }\simeq \alpha x$ suggests that their cross-section is circular (figure 4). Air channels are formed by depleting the coating films along liquid fingers. Following the previous argument for the finger selection, the maximum volume available from the depletion of the films is of the order of
 $h^{2}$ per unit length. This area corresponds to the maximum area of the air channels. As a consequence, we expect the maximum value of
 ${W_{{air}} }$ to be proportional to
 $h$. In other words, the propagation distance of the fingers
 $x_{max}$ should follow the simple scaling
 \begin{equation} x_{max}\sim h/\alpha. \end{equation}
Experimental results obtained for angles  $\alpha$ ranging from 0.13
 ${{}^{\circ } }$ to
 $0.25 {{}^{\circ } }$ and film thickness ranging from 60 to
 $125\,\mathrm {\mu }$m indicate
 $x_{max}\simeq 3 \,h/\alpha$, in good agreement with our prediction as shown in figure 8(a). Combining this expression with the approximated finger dynamics (3.7), and neglecting
 $x_0$ with respect to
 $x_{max}$, we can estimate the typical saturation time
 $\tau _{sat}$ required to reach the maximum position
 \begin{equation} \tau_{sat} \simeq 4 x_{max}^{2} \frac{\alpha^{2}}{h^{2}} \frac{\eta h}{\gamma \alpha} \simeq 36 \frac{\eta h}{\gamma \alpha}. \end{equation}
The saturation time  $\tau _{sat}$ measured experimentally is plotted as a function of
 $\eta h/\gamma \alpha$ in figure 8(b). The data collapse onto the black line corresponding to
 $\tau _{sat}=40\,\eta h/\gamma \alpha$, which confirms our description of the front dynamics.
(a) Maximum relative position  ${x_{max} }$ as a function of the characteristic length
 ${h / \alpha }$ for experiments performed with angles
 $\alpha$ ranging from
 $0.13{{}^{\circ } }$ to
 $0.25 {{}^{\circ } }$, layers of thickness
 $h$ ranging from 60 to
 $123\,\mathrm {\mu }$m and viscosity
 $\eta =$ 50, 500 or
 $1000$ mPa s. The continuous line has a slope 3. (b) Saturation time measured experimentally
 $\tau _{sat}$ as a function of
 $\eta h/\gamma \alpha$. The continuous line corresponds to
 $\tau _{sat} = 40 \eta h/\gamma \alpha$.

4. Conclusion
We have explored experimentally an original fingering instability which occurs as two solid plates coated with thin viscous films of thickness  $h$ are brought into contact. More specifically, we explored a wedge configuration of angle
 $\alpha$ that leads to regular longitudinal fingers. The instability mechanism is distinct from classical viscous fingering and relies on feeding the air gap separating the facing surfaces from the liquid films. While a smooth front would deplete the liquid in its vicinity and stop at a typical distance
 $h/\sqrt {\alpha }$, fingers can propagate by absorbing the film laterally. We propose a simplified scenario where the constant width of the fingers is of the order of
 ${W_{{oil}} }\sim h/\sqrt {\alpha }$, in good agreement with our experimental data. Liquid fingers are separated by circular air channels whose diameter is dictated by the local spacing between the facing surfaces,
 ${W_{{air}} }\simeq \alpha x$. In this wedge configuration, the dynamics follows a diffusive scaling law
 $(\gamma h/\eta \alpha )^{1/2} t^{1/2}$ and stops at a characteristic length
 $h/\alpha$ for a typical time
 $\tau _{sat}\sim \eta h/\gamma \alpha$.
Many fundamental questions remain open. In particular, a rigorous stability analysis in this complex three-dimensional configuration is still missing. We also did not explore in detail the dynamics of the rear front nor the destabilization of air channels into individual bubbles that are important for practical applications. Our experiment is finally also reminiscent of the merging of liquid films coating counter-rotating cylinders. Many works have been focused on the cusp profile of the interface (Joseph et al. Reference Joseph, Nelson, Renardy and Renardy1991; Courrech du Pont & Eggers Reference Courrech du Pont and Eggers2020) that precedes air entrainment as the rotation velocity of the cylinders is increased (Lorenceau, Restagno & Quéré Reference Lorenceau, Restagno and Quéré2003). The limit of low rotation velocity has nevertheless received less attention. This regime might be close to our configuration and lead to a steady instability. We thus hope our experimental results will motivate further theoretical and numerical studies and experiments in similar configurations to address these challenging questions.
Supplementary movies
Supplementary movies are available at https://doi.org/10.1017/jfm.2022.789.
Acknowledgements
We thank P. Lalanne for his precious experimental help. J.B. is very grateful to T. Bohr and C. Clanet for fruitful discussions on preliminary experiments conducted in Copenhagen.
Declaration of interests
The authors report no conflict of interest.