


1. Introduction
Understanding how households allocate resources among its members has been for decades an inquiry of primary interest for economists [Chiappori and Meghir (Reference Chiappori and Meghir2014)], with important implications for the intergenerational transmission of human capital [Datar et al. (Reference Datar, Kilburn and Loughran2010)]. One key aspect of the intra-household allocation of resources is the role of cognitive skills in the distribution of school investments across the children of a household. Do parents allocate more schooling to the more able children or do they try to compensate the less skilled children with more schooling? Answering this question is of key importance for the design of effective policies in developing countries that pursue improvements in education for all the population. For example, if parents focus their school investments in their most endowed children, supply-side schooling interventions such as reductions in class size or school construction may benefit mostly the most able children while demand-side schooling interventions that target the less able children such as conditional cash transfers could be more effective in promoting universal schooling [Akresh et al. (Reference Akresh, Bagby, de Walque and Kazianga2012)].
In his seminal book A Treatise on the Family, Gary Becker developed a theoretical model that conceptualizes the intra-household allocation of human and nonhuman capital investments across siblings. One of the main predictions of the model is that siblings with higher returns to human capital receive larger human capital investments. Assuming that returns to human capital investments are larger the higher the cognitive ability [Becker (Reference Becker1981), Appleton (Reference Appleton2000)], the model predicts that parents reinforce genetic differences in cognitive skills through allocating more human capital investments to the more able siblings and compensate the less endowed with more nonhuman capital investments.
Using household panel data from rural Ghana, this study builds in the existing literature and shows evidence consistent with the main prediction of the Becker's model: Do parents allocate investments in education reinforcing cognitive differences between siblings? More specifically, the study assesses whether in a context in which intra-household variation in school attendance across siblings in compulsory and post-compulsory school age is large, better cognitive skills relative to the rest of the siblings affect the probability of attending school. This study makes three contributions. First, it adds evidence to the thin literature that examines whether cognitive skills affect the intra-household allocation of school investments in developing countries. Second, to achieve this objective, the study uses 5 rounds of a panel dataset from rural Ghana. The empirical strategy relies on cognitive tests applied in the first round of the survey as treatment variables to proxy for cognitive skills, and school attendance the subsequent years as dependent variable in the specification. Variables aiming to capture human capital investments before the implementation of the cognitive test are included as control variables in the specification to limit endogeneity concerns. Third, we examine potential heterogeneous effects by gender and wealth and frame these results within the predictions of the Becker's model to test more comprehensively its validity.
We find that conditional on initial levels of education and health, children with better cognitive skills relative to their siblings are more likely to attend school over the following 4 years. These results are aligned with previous papers that assess empirically the role of cognitive skills in the intra-household allocation of investments in education [Kim (Reference Kim2005), Ayalew (Reference Ayalew2005), Akresh et al. (Reference Akresh, Bagby, de Walque and Kazianga2012), Akresh et al. (Reference Akresh, Bagby, de Walque and Kazianga2016), Sanz-de Galdeano and Terskaya (Reference Sanz-de Galdeano and Terskaya2019)] and provide support for the main prediction of Becker's model. Furthermore, the effect of cognitive skills on the allocation of schooling across siblings seems to be larger for boys than for girls, which is also in line with the predictions of the model. On the other hand, the results also suggest that the magnitude of this effect is not larger for wealthier households, which does not support the prediction of Becker's model.
The paper is structured as follows. Section 2 presents the model of intra-household allocation of human capital developed in Becker (Reference Becker1981). Then, section 3 summarizes the academic literature that investigates the role of child endowments in the allocation of resources across siblings. Section 4 introduces some relevant aspects of the educational system in Ghana. Section 5 describes the data. Section 6 presents the empirical strategy and section 7 tests empirically the predictions of the model and discusses the main results of the study. Then, section 8 examines whether the effect of cognitive skills on the allocation of schooling across siblings varies by gender of the child and by the socioeconomic status of the household. Section 9 concludes.
2. Conceptual framework
This section summarizes the theoretical model developed in Becker (Reference Becker1981).Footnote 1 This model aims to formalize the intra-household allocation of human and nonhuman capital across siblings. In it, parents maximize a utility function that depends on their own current consumption and on the future wealth of their children:

where $c$ is the parent consumption in the present and $I_{i}$
 indicates the future wealth of child $i$
 . The future wealth of a child is described as a function of the human capital and nonhuman capital investments received by this child:

where $h_{i}$ and $m_{i}$
 indicate the level of human and nonhuman capital resources that parents allocate to child $i$
 . $R_{i}^{h}$
 is the rate of return on human capital for child $i$
 , $a_{i}$
 indicates the cognitive skills of the same child, and $R^{m}$
 is the market rate of return on nonhuman capital. The model assumes that while the rate of return on human capital function is concave in the investment level and higher the larger the innate cognitive skills, the rate of return on nonhuman capital is constant in the investment level and independent of innate cognitive skills implying that it is the same across siblings. Formally, if $R_{i}^{h}( h_{i},\; \, a_{i})$
 and $R_{i}^{m}$
 are the functions of marginal return on human and nonhuman capital, Becker's model assumes that $\delta R_{i}^{h} / \delta h_{i}< 0$
 , $\delta R_{i}^{h} / \delta a_{i}> 0$
 , $\delta R_{i}^{m} / \delta m_{i} = 0$
 and $\delta R_{i}^{m} / \delta a_{i} = 0$
 . The assumption made in Becker's model of a larger marginal rate of return on human capital for better endowed siblings has some empirical support in the literature [Appleton (Reference Appleton2000)].
Parents maximize their utility function through allocating human and nonhuman capital resources until the marginal rate of return on human capital is equal across siblings and also equal to the rate of return on nonhuman capital. Formally, the latter condition can be expressed as follows: $R_{1}^{h} = R_{2}^{h} = \ldots = R_{n}^{h} = R^{m}$ .
The model yields two main predictions. First, because they have higher returns on human capital, more able siblings receive larger levels of human capital investments than less cognitively endowed siblings. In consequence, with their human capital investments, parents reinforce cognitive differences between siblings. This prediction is straightforward in the model: if under optimal level of investments across siblings $R_{1}^{h}( h_{1},\; \, a_{1}) = ... = R_{n}^{h}( h_{n},\; \, a_{n}) = R^{m}$ , $\delta R_{i}^{h} / \delta h_{i}< 0$
 , $\delta R_{i}^{h} / \delta a_{i}> 0$
 and for the following two siblings we assumed $a_{1}> a_{2}$
 , then $h_{1}> h_{2}$
 . More generally, the model implies that $\delta h / \delta a > 0$
 .
The second prediction of the model is that parents compensate siblings with lower returns to human capital through allocating them larger bequests or other nonhuman capital resources (e.g. inter-vivos transfers unrelated with education or health). The implication of this prediction is that less able siblings receive larger nonhuman capital investments. To see how the model leads to this conclusion, we use as example a household with two siblings where $a_{1}> a_{2}$ . In this household, parents maximize their utility when ${\delta U\over \delta I_{1}}\big /{\delta U\over \delta I_{2}} = {R_{2}\over R_{1}}$
 , where $R_{i}$
 is the rate of return from additional investments in child $i$
 . Because in the optimal level of investments $R_{1} = R_{2} = R^{m}$
 , the former condition can only be satisfied when $I_{1} = I_{2}$
 . Thus, if $a_{1}> a_{2}$
 and $h_{1}> h_{2}$
 , the condition $I_{1} = I_{2}$
 can only be achieved if $m_{1}< m_{2}$
 .
But how the model would predict the reinforcement effect outlined in the first prediction to depend on the gender of the child or on household socioeconomic status? First, it is important to consider that the conceptual framework described above would predict a differential effect of cognitive skills on school investments for boys and girls if the degree in which the returns to school for the child or for the parents depend on cognitive skills is different for boys and girls. The latter would happen for example if women have lower levels of labour force participation. If returns to school depend more strongly on cognitive skills for boys, the model would predict that the allocation of investments in education across siblings reinforces more strongly cognitive differences among male siblings than among female siblings.
Regarding the socioeconomic status, if parents have some degree of inequality aversion [Terskaya (Reference Terskaya2017), Sanz-de Galdeano and Terskaya (Reference Sanz-de Galdeano and Terskaya2019)], Becker's model predict that the reinforcing pattern in the allocation of human capital investments would be weaker (if any) in poor households because nonhuman capital resources are limited in these families and therefore, disadvantaged households would not be able to compensate less able children with larger nonhuman capital transfers. Thus, the reinforcing mechanism in households that cannot make nonhuman capital investments will depend on the degree of aversion of the parents toward sibling inequality: the stronger the aversion for sibling inequality, the smaller the difference in schooling investments received by more and less able siblings, and the larger the differential effect of cognitive skills on the allocation of schooling across siblings in poorer and wealthier families.
Using a sample of Ghanaian children, the core of this study focuses on testing the first prediction of the model using years of schooling as a measure of human capital investments and the scores in different cognitive tests as measures of cognitive skills. We explore further Becker's model through assessing whether the magnitude of the effect of cognitive skills on the allocation of schooling across siblings depends on the gender of the child and on household wealth as predicted by the model. Unfortunately, the lack of information on the intra-household allocation of nonhuman capital resources hinders the empirical assessment of the second prediction of the model.
3. Related literature
Several studies assess empirically the effects of child endowments on the allocation of human and nonhuman capital resources across siblings, testing the predictions of the Becker's model presented in section 2. Most of these studies focus on examining the effect of health endowments such as birthweight or body mass index on the intra-household allocation of health, schooling, and other inter-vivos transfers. The evidence is mixed and while some of these studies find that children with better health seem to receive larger levels of health [Pitt et al. (Reference Pitt, Rosenzweig and Hassan1990), Behrman et al. (Reference Behrman, Rosenzweig and Taubman1994)] and educational investments [Behrman et al. (Reference Behrman, Rosenzweig and Taubman1994), Miller et al. (Reference Miller, Mulvey and Martin1995), Rosales-Rueda (Reference Rosales-Rueda2014); Yi et al. (Reference Yi, Heckman, Zhang and Conti2015)],Footnote 2 other studies suggest that parents favour less endowed children with more education [Griliches (Reference Griliches1979), Behrman et al. (Reference Behrman, Pollak and Taubman1982), Ermisch and Francesconi (Reference Ermisch and Francesconi2000), Frijters et al. (Reference Frijters, Johnston, Shah and Shields2010), Leight (Reference Leight2014)] and health investments [Ayalew (Reference Ayalew2005), Datar et al. (Reference Datar, Kilburn and Loughran2010), Yi et al. (Reference Yi, Heckman, Zhang and Conti2015)]. The evidence is also inconclusive on whether children with worse health receive more nonhuman capital transfers, including inter-vivos transfers unrelated with health and education [McGarry and Schoeni (Reference McGarry and Schoeni1997), Dunn and Phillips (Reference Dunn and Phillips1997), Hochguertel and Ohlsson (Reference Hochguertel and Ohlsson2009), Rosales-Rueda (Reference Rosales-Rueda2014)].
Although plenty of studies assess whether child endowments affect the intra-household allocation of human capital investments, only a few of them investigate the specific role of cognitive endowments. The main methodological challenge in these studies is the potential endogeneity in the link between the results obtained in cognitive tests such as IQ, Raven, or Digit Span tests and human capital investments, which could be affected by previous human capital investments.
The first study that addressed empirically this research question was Kim (Reference Kim2005). Using data from high schools in the US state of Wisconsin, the author shows that conditional on a wide set of household and individual level controls, higher scores in IQ tests are associated not only with receiving larger human capital investments but also with receiving larger inter-vivos transfers unrelated with education. This finding provides evidence in favor of the first prediction of the Becker's model but against the second.
Using cross-sectional data from Ethiopia, Ayalew (Reference Ayalew2005) finds that while parents use health investments to compensate for children differences in cognitive ability, they tend to reinforce these differences through allocating more educational investments to those children that have better cognitive skills. To measure these skills, the author constructs a proxy variable for innate cognitive ability as follows. First, the score obtained in the Raven cognitive test is regressed against child individual characteristics including age, gender, and years of schooling. Then, the residuals in the latter regression are used as a proxy for innate cognitive ability in the main specification that includes school attendance as dependent variable and the residuals of the Raven score regression as the treatment variable. In order to overcome the endogeneity in the link between years of schooling and the Raven score in the first regression, the former is instrumented with land and livestock owned. The main identification assumption of this approach is that land and livestock owned should only affect the performance in the Raven test through affecting years of schooling.
Relying on panel data from Burkina Faso, Akresh et al. (Reference Akresh, Bagby, de Walque and Kazianga2012) and Akresh et al. (Reference Akresh, Bagby, de Walque and Kazianga2016) show that higher scores in cognitive tests and better parents’ expectations regarding future earnings relative to the other siblings increase significantly school attendance and reduce child labour. These studies use the results of Raven, Forward Digit Span, and Backward Digit Span tests as direct measures of cognitive skills. To overcome endogeneity concerns, Akresh et al. (Reference Akresh, Bagby, de Walque and Kazianga2012) use household fixed effects and Akresh et al. (Reference Akresh, Bagby, de Walque and Kazianga2016) rainfall shocks during in-utero or early childhood as an instrumental variable for cognitive outcomes. The main identification condition in the latter study is that rainfall shocks during early life should only affect investments through its effects on cognitive skills.
A recent study by Sanz-de Galdeano and Terskaya (Reference Sanz-de Galdeano and Terskaya2019) uses individual-level data from the US that include information on polygenic scores as a measure of cognitive endowment. The main advantage of polygenic scores relative to other measures of cognitive skills is that polygenic scores are unaffected by early childhood life conditions or human capital investments. The authors of the study conclude that children with better cognitive endowment received larger levels of educational investments.
On the other hand, Fan and Porter (Reference Fan and Porter2019) use panel data and rainfall shocks as an instrumental variable for cognitive skills to document that, in Ethiopia, parents compensate siblings with lower cognitive skills with more educational investments.
Although most of these studies suggest that parents allocate more education to siblings with higher cognitive skills in both developing and developed countries, the results of these studies also raise questions about the broader predictions and validity of the model to explain the intra-household allocation of investments. For example, neither Kim (Reference Kim2005) nor Ayalew (Reference Ayalew2005) find any evidence of reinforcing mechanisms in terms of other human capital investments (e.g. health investments) or compensatory behavior using nonhuman capital transfers. In the light of the existing evidence, some studies suggest that differences in parental investment across their children might not be primarily caused by differences in economic returns to investments between the children in the household [Kim (Reference Kim2005), Mechoulan and Wolff (Reference Mechoulan and Wolff2015)] and outline other potential reasons such as differences in affection correlating with cognitive skills [Kim (Reference Kim2005)].
4. Education in Ghana
When Ghana achieved its independence in 1957, the vast majority of its citizens lacked access to education [MacBeath (Reference MacBeath2010)]. The post-colonial government implemented different programs with the objective of increasing access to primary and secondary education across the country and although the process faced important challenges such as the lack of qualified teachers, the enrollment rates raised dramatically in all the country [MacBeath (Reference MacBeath2010), Addy (Reference Addy2013)]. Over the following decades, a free and compulsory educational system was consolidated in Ghana, with average levels of enrollment and gender parity above the average for Sub-Saharan countries [USAID (2009), UNESCO (2014)]. World Bank data from 2013 show that while the average net enrollment rates in primary and secondary education in sub-Saharan Africa were 77% and 33%, the net enrollment rates in primary and secondary education in Ghana were 87% and 52%. Furthermore, and unlike other Sub-Saharan countries, the net enrollment rates in primary and secondary education in Ghana are not significantly different for boys and girls [GSS (2015)]. However, despite achieving relatively large average enrollment rates and gender parity, the education system in Ghana is facing important challenges. An analysis of some of them is provided in UNESCO (2014). The report mentions the lack of infrastructure, delayed attendance, poor quality of primary and secondary education, and low school attendance in the northern provinces of the country as the main problems of the Ghanaian education system.
After the 2009 reform, formal education in Ghana is structured in three different parts. The basic education started at age 4 and finished at 15, and it is free and compulsory. During the basic education cycle, the students followed 2 years of pre-school education, 6 years of primary education, and 3 years of junior secondary school. In this education cycle, grade promotion is automatic if the child attends school regularly during the year. At the end of the third year of the junior secondary school, the students are eligible to take the Basic Education Certificate Examination (BECE). The latter exam gives students admission into senior secondary or vocational schools in Ghana. Both the senior secondary and vocational schools last for three years and the state provides them for free. However they are not compulsory and promotion at the end of the year is based on school performance. At the end of secondary school, the students are eligible to take the West African Senior School Certificate Examination, that is used to determine admission into the University or tertiary education. Although the duration of the tertiary education depends on the academic degree undertaken, bachelor degrees in public universities typically last for four years and most students face small tuition fees.
5. Data
The analysis conducted in this study relies on five rounds of a household panel survey conducted annually between 2012 and 2016 for the impact evaluation of the Millennium Villages Project in the districts of Builsa and West Mamprusi in northern Ghana.Footnote 3 The survey targets every year the same 2250 households in 103 villages in the districts of Builsa and West Mamprusi. During this period, a total of 2,073 households were successfully interviewed every year.
With the first round of the survey, implemented in 2012, the enumerators applied three widely used cognitive tests aiming to measure cognitive skills of every person aged 5–19 in the sample regardless of whether they attend school or not: the Raven's Progressive Matrices, the Digit Span Forward (DSF) and the Digit Span Backward (DSB) tests. The Raven's Progressive Matrices is a nonverbal test developed by John C. Raven in 1936 that measures abstract reasoning and has been used to measure fluid intelligence. The test administered includes 12 questions and the score ranges between 0 and 12. In these questions, the children have to identify the missing element that completes patterns of increasing difficulty until they get an answer wrong.Footnote 4 The test was designed to be unambiguously interpretable and easy to administer [Raven (Reference Raven1994)]. Although the test was constructed to be affected as little as possible by individual education and experience, a handful of studies suggest that these two features may influence test performance. For example, Ayalew (Reference Ayalew2005) and Alderman (Reference Alderman1995) show that boys in rural areas in Pakistan and Ethiopia have significantly higher scores in the Raven test than girls, casting doubts on whether the score is influenced by human capital investments.
The DSF and DSB tests are components of the Wechsler memory scales (WMS) and the Wechsler intelligence scales for adults and children [Woods et al. (Reference Woods, Kishiyama, Yund, Herron, Edwards, Poliva, Hink and Reed2011)]. In these tests, the children have to repeat different strings of numbers both in the order stated by the enumerator (forward test) or in reverse order (backward test). The strings of numbers increase in length as the child answers correctly up to a total of 8 digits and the score ranges between 0 and 16. These tests measure working memory and ability to concentrate.Footnote 5 Following Akresh et al. (Reference Akresh, Bagby, de Walque and Kazianga2012), we compute age-adjusted z-scoresFootnote 6 for each of these cognitive tests so that the mean and the standard deviation of the score in each test for children of the same age are 0 and 1.
A crucial stage of the study is the construction of variables that measure investments in education. Given that the study is set in deprived areas of a low-income country with large intra-household variation in terms of school attendance, we follow Akresh et al. (Reference Akresh, Bagby, de Walque and Kazianga2012) and use school attendance as a measure of school investments. School attendance—mainly during primary and secondary education—has been used convincingly as a measure of educational investment in sub-Saharan Africa in numerous studies including Akresh et al. (Reference Akresh, Bagby, de Walque and Kazianga2012), Akresh et al. (Reference Akresh, Bagby, de Walque and Kazianga2016) or Ayalew (Reference Ayalew2005). It is important to mention that although school attendance ultimately measures parental investments, attendance might be also affected by children's willingness to attend school and therefore might not only reflect parental preferences for education. Unfortunately, we lack in the survey information on other measures of educational investments such as investments in textbooks, school fees, or time spent with parents that would have complemented the analysis. Information on school attendance is collected yearly at the individual level in the survey during the period 2012–2016. The survey includes two different questions aiming to record school attendance. First, enumerators collect information on the number of years of schooling of every child equal or older than 3 years old. Using this information, we construct a measure of school attendance between 2013 and 2016 as the difference in years of schooling reported in 2016 and in 2012. Second, the survey also asks whether children equal or older than 3 years old attend school at any point during the last 12 months. We use this information to construct a variable that ranges between 0 and 4 and measures how many years during the period 2013–2016 the individual has attended school at least once during the last 12 months.
The main concern with the second attendance measure is that it might not truly capture relevant attendance because children that for example attend school for just one week during the year might be categorized as attending school using this criteria. Indeed, the percentage of children aged 5–18 attending school at least once during the last twelve months remains above the 70% for children aged 5–18. Furthermore, since less than 30% of the households with more than 1 child in school age present between-siblings variation in terms of school attendance at some point in the last 12 months, this measure of school attendance is not ideal to conduct the analysis proposed. On the other hand, the main concern with the first attendance measure is that it is constructed using years of schooling rather than attendance, which might not be driven only by school attendance but also by the ability of the individual to promote to the next school grade. Although this concern could be relevant for children undertaking senior secondary school, tertiary education, or vocational education where access and grade promotion at the end of the school year are not automatic, the share of children in the sample attending any of these educational levels at baseline is below 2%. The vast majority of the children in the sample are enrolled in primary or junior secondary education, where grade promotion is automatic if the child attends school regularly.
In the light of these facts and given the intermittent school attendance of most children in the sample,Footnote 7 the school attendance variable based on the difference in years of schooling between 2012 and 2016 seems to be more adequate to measure investments in education than the school attendance variable based on whether a child attended school at least once in the last 12 months. Nonetheless, and although the main analysis uses the measure of school attendance based on the difference between years of schooling between 2016 and 2012 as the main dependent variable, we test the robustness of the results to the use of the alternative school attendance measure and find reassuring results.
The sample of primary interest for the analysis are those children aged 5–18 that are sons or daughters of the household head and live in a household interviewed every year over the period 2012–2016Footnote 8 with two siblings aged 5–18 at the time the first round of the survey. In total, 3,951 children from 1,109 households fulfill these conditions. However, and despite all these children were eligible for the cognitive tests, only 2,467 of them from 1,001 households took at least one of the three cognitive tests. The majority of children that did not take any cognitive test were not at home at the time of the interview, accounting for the 69.71% of the eligible children that did not take the test. On the other hand, the percentage of children that were at home but did not take the tests is 30.29%.
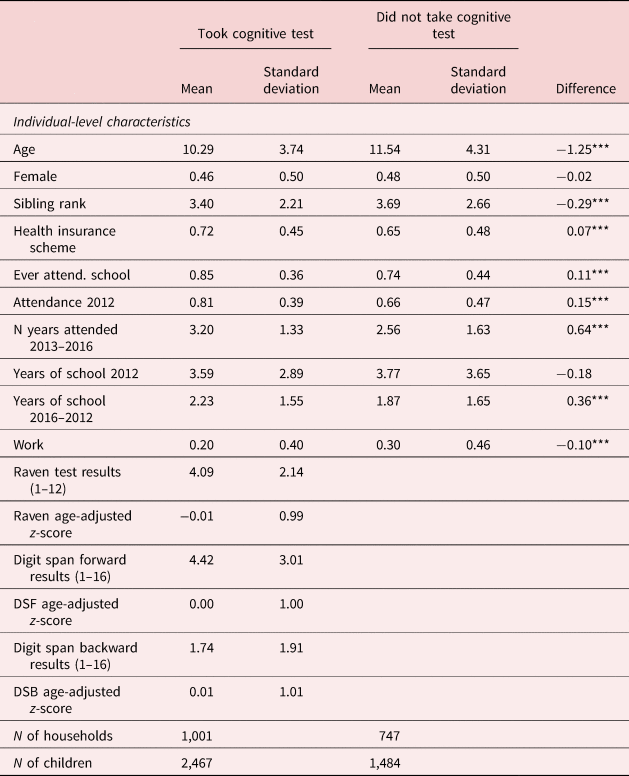
Table 1 provides descriptive statistics on child-level characteristics for the sample of interest. The descriptive statistics are presented separately for children that took the cognitive test and for children that did not. The average number of correct answers in the sample of children that took the cognitive tests was 4.09 for the Raven Matrices test, 4.42 for the DSF test, and 1.74 for the DSB test. The share of girls in this sample is 0.46 and the mean age of these children is 10.29 years.
Summary statistics: children aged 5–18
Note: ***$p< 0.01$ ; **$p< 0.05$
 ; *$p< 0.1$
 .
The data reveal that the 85% of the children aged 5–18 in 2012 that took the cognitive tests ever attended school and that the 81% of these children attended school at least once in the last 12 months. Consistently, the table shows that the average number of years during the period 2013–2016 that these children attended school at least once is 3.20. The corresponding net attendance rate to primary and secondary school among this sub-sample of children in the data is 53% and 23%Footnote 9. The net enrollment rates found in the sample are smaller than the net enrollment rates reported in GSS (2015) for the Northern and the Upper East regions for primary (68.1% and 73.1%) and secondary education (30.0% and 30.4%). When attendance during the same period is measured using the difference between years of schooling in 2016 and in 2012, the average number of years of schooling completed during the relevant period for the sample of children that took at least one of the cognitive tests is 2.23.
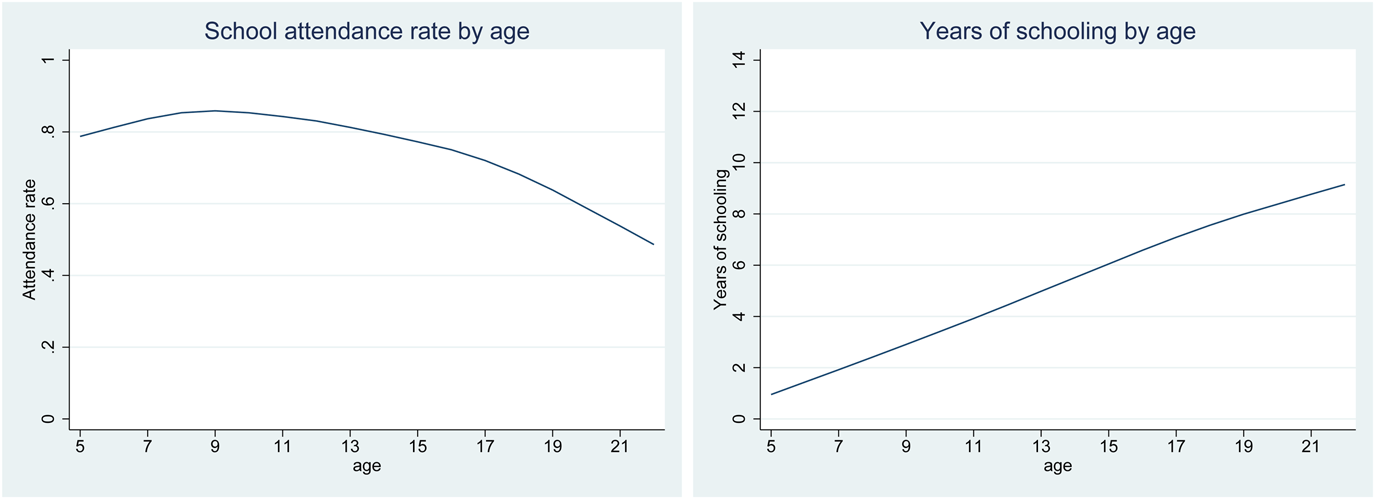
Figure 1 provides further insights into the school attendance and years of schooling by age for the sample of children that took at least one of the cognitive tests. The figure reveals that the share of children aged 5–21 that attended school at some point in the last twelve months remains over the 70% until the age of 17. Interestingly, the share of children attending school decreases slightly but constantly from the age of 10. Besides, the figure shows that the slope of the LOWESS regression that displays the relation between the age and the years of schooling is well below 1 during all the period of interest. Combined with the fact that the percentage of children that report attending school at least once in the last 12 months remains above the 80% for children equal or younger than 14 years old, the small slope in every point of the function suggests that despite attending school at some point during the year, many of these children might not attend school regularly during the year.
School attendance by age (year 2012).
Worth to mention, Table 1 also shows that children that did not take the cognitive tests are on average 15 percentage points less likely to attend school at least once during the last 12 months, 1.25 years older, 10 percentage points more likely to have a job, 7 percentage points more likely to have a health insurance, and have a higher sibling rank. On the other hand, there is not any significant difference between children that did and did not take cognitive tests in terms of gender and years of schooling at baseline.
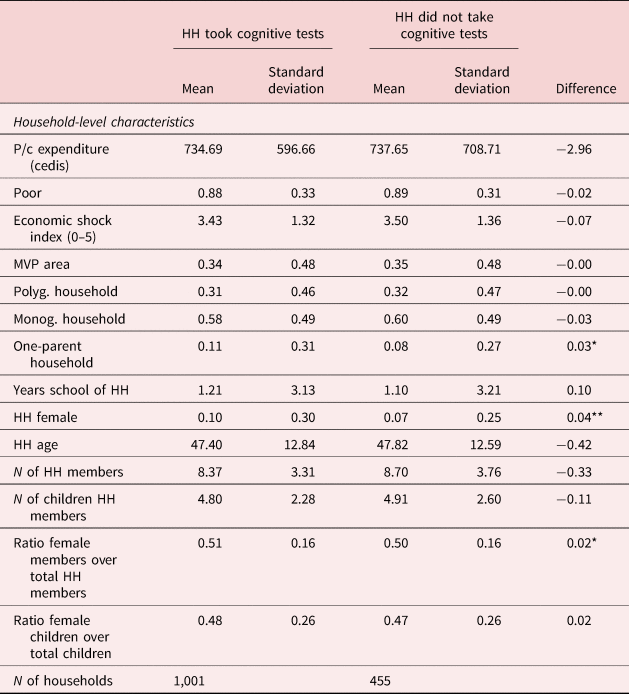
Table 2 presents descriptive statistics on household characteristics collected in the first round of the survey (2012) for the sample of households surveyed every year that have at least 2 children that were eligible to undertake the cognitive tests. The information is provided separately for those households in which at least one child took one or more cognitive tests and for those in which despite having eligible children, none of them took any of the cognitive tests. The descriptive statistics reveal that the 88% of the households in the sample with at least one child that took the cognitive tests live on a level of per capita consumption below the national poverty line, the 31% of them are polygynous, and only the 10% are female headed. The average household size in the sample of interest is 8.37 and the average number of household members aged below 18 is 4.80.
Summary statistics: children of household heads 5–18 years with information on cognitive skills
Note: ***$p< 0.01$ ; **$p< 0.05$
 ; *$p< 0.1$
 .
6. Empirical strategy
This section introduces the empirical strategy for the estimation of the effect of cognitive skills on the allocation of school attendance across siblings using four rounds of data collected for the evaluation of the Millennium Villages Project in northern Ghana. The main challenge for the identification of this effect arises from the fact that the link between cognitive skills and school attendance is likely affected by reverse causality or unobservable factors such as parental preferences. Indeed, although the cognitive tests used to measure cognitive skills are designed with the intention of being unaffected by schooling, culture, and family background [see, e.g., Raven (Reference Raven1994)], it is not possible to rule out the possibility that these measures are themselves affected by schooling or by any other differential treatment that some children within the household may receive [Glewwe (Reference Glewwe1999), Ayalew (Reference Ayalew2005), Akresh et al. (Reference Akresh, Bagby, de Walque and Kazianga2012)].
An additional challenge when estimating the effect of cognitive skills on years of schooling arises from the fact that approximately the 38% of the eligible children in the sample did not take any of the cognitive tests. The restriction of the sample used in the analysis to only the children that took the cognitive tests could lead to a problem of sample selection bias. In line with this hypothesis, Table 1 shows that those children that took at least one cognitive test are different from those that did not in terms of key baseline characteristics such as sibling rank or school attendance.
To overcome these challenges, we follow Cueto et al. (Reference Cueto, Leon and Muñoz2014) and propose the two steps procedure developed in Heckman (Reference Heckman1979). In the first stage, we estimate the selection equation using a probit model:

where $TakeCogTest_{i, h}$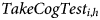 is a dummy variable that is equal to 1 if child $i$
 in household $h$
 took the cognitive test and $X$
 is a vector of child-level variables that are likely to affect the probability of taking the cognitive tests. This vector of variables includes school attendance, labour force participation, years of schooling, gender of the child, a proxy for health investments, sibling rank, labour force participation, and a vector of dummies indicating the age in completed years of the child. $Z_{h}$
 is a vector of household-level characteristics that could affect the probability of taking the cognitive tests. The vector of household-level variables include per capita expenditure, an index of exposure to economic shocks, polygamy status, education, and gender of the household head, household size, number of children of both gender in the household, the number of boys aged under 18 years in the household and enumerator, village and time at survey fixed effects. Both the individual and the household-level characteristics included in the regression as right-hand side variables are measured in the first round of the survey (2012).
Once equation (3) is estimated, the next step is the calculation of the Inverse Mills Ratio (IMR), also known as selectivity correction term. The latter is calculated for every child as the coefficient of the standard normal density function of the predicted probability of taking cognitive test for every child divided by the standard normal cumulative distribution function of the predicted probability of taking the cognitive test for the same child.
The validity of IMR approach to correct for non-random selection of children into the analytical sample relies on the nonlinearities of the Mills Ratio, which is calculated using the predicted values of a probit model. In other words, the validity of the IMR approach relies mostly on the observations that are in the tails of the distribution. In order to improve the functioning of this two-stage approach, various studies suggest the inclusion of variables that affect the probability of selection into the sample but not the outcome of interest.Footnote 10 Following the suggestions in these studies, we include in equation (3) a set of time at survey fixed effects. These sets of dummies have a strong impact on the probability of undertaking cognitive tests, but are unlikely to affect school attendance over the following years.
In the second stage, we estimate using OLS the following equation:

where $YearsSchool_{i, h}$ is the number of years that child $i$
 in household $h$
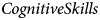
 went to school between the years 2013 and 2016, $CognitiveSkills_{i, h}$
 indicates the age-adjusted z-score in the cognitive test taken in 2012 for child $i$
 and $X_{i, h}$
 is a vector of child-level characteristics in 2012 that include gender, a proxy for health investments, sibling rank, a set of dummy variables for age, the IMR, years of schooling, and school attendance. The specification also includes a dummy for every specific household surveyed. This vector of household fixed-effects dummies accounts for differences in all the factors that are constant within a household. $u_{i, h}$
 is the error term in the regression. The parameter of interest is $\omega _{1}$
 . Since household fixed effects are included in the regression, $\omega _{1}$
 yields the average effect of an increase in one standard deviation in the cognitive test score relative to the mean score of his siblings on the number of years that the child attended school between 2013 and 2016. Note that since the values of the variable $CognitiveSkills$
 (measured in 2012) are not affected by school attendance between 2013 and 2016 and because the specification is already accounting for years of education and school attendance in 2012, the parameter $\omega _{1}$
 is not affected by the reverse causality problem.Footnote 11 Furthermore, sample selection bias in equation (4) is addressed through the inclusion of the IMR [Heckman (Reference Heckman1979)] as a control variable. The household-level variables used for estimating equation (3) are captured in (4) by the household fixed-effect parameter $\delta _{h}$
 .
A potential limitation of the identification strategy presented in equation (4) is the possibility, described in Akresh et al. (Reference Akresh, Bagby, de Walque and Kazianga2012), that parents allocate more health investments to those siblings that have worse cognitive skills. If this is the case and the specification does not account adequately for health investments, the parameter that measures the effect of cognitive skills on schooling would be biased downwards. The best way we can cope with this problem is through including in the regression a dummy variable that takes the value of 1 if the child is registered with the National Health Insurance Scheme (NHIS) and 0 otherwise. The NHIS is a health insurance provided by the state. Registration with the NHIS is at the individual level and it is subject to a yearly fee that varies depending on the socioeconomic situation of the household. In this sense, this variable is used to capture variation across siblings in health investments received within a household. Unfortunately, the survey does not include information on other health investments at the child level including health expenses, nutritional intake, or medical visits that could be added to the analysis.
We also examine the robustness of the results to the use of the specification implemented in Sanz-de Galdeano and Terskaya (Reference Sanz-de Galdeano and Terskaya2019). This analysis includes as regressors both the score in the cognitive test of the children and a relative measure of cognitive skills that is defined as children's score in the cognitive test minus the average score in the cognitive test of the rest of the siblings.
7. Results
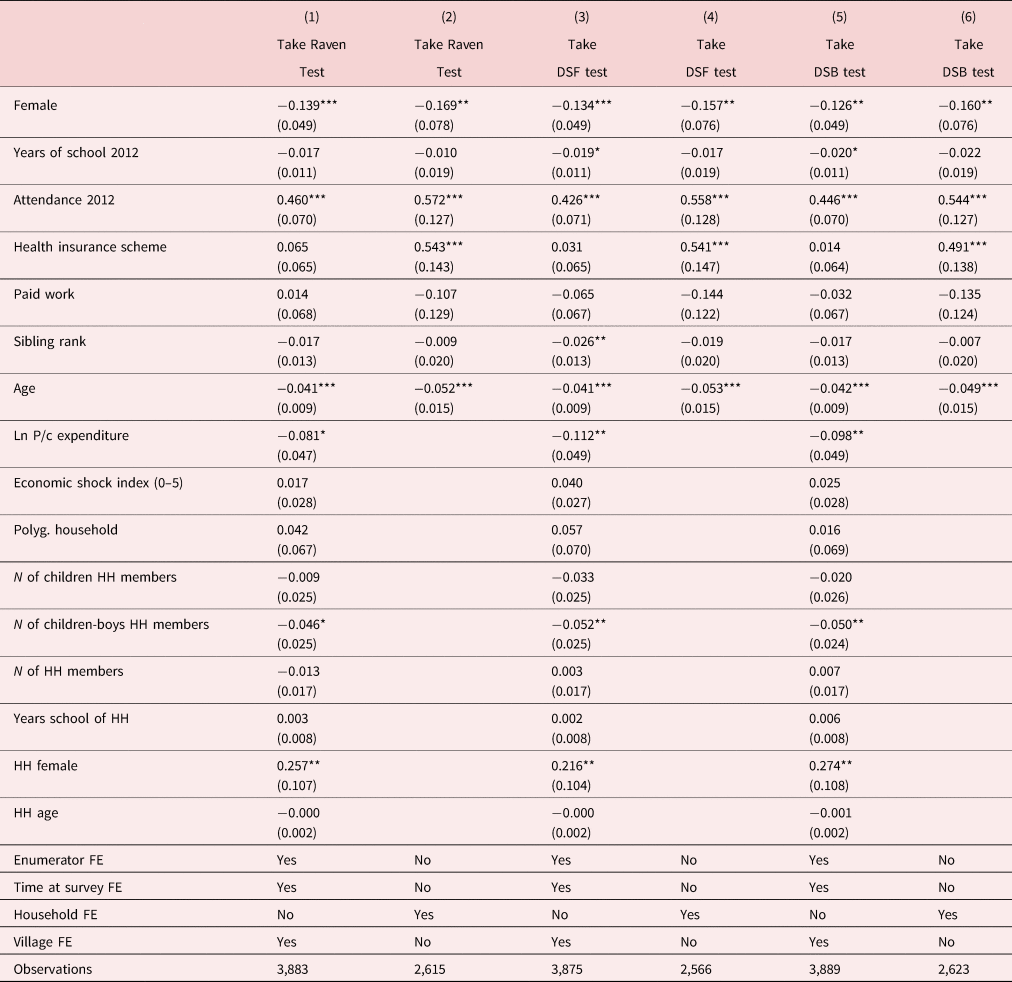
Table 3 presents the results of the selection equation. The estimates show that the child-level determinants of cognitive tests uptake are the same for the three tests examined in terms of statistical significance: being male, school attendance, and lower age are factors positively and strongly associated with the uptake of cognitive tests. In the specifications with household fixed effects, the health insurance variable is also positive and statistically significant in all the equations. Among the household-level determinants, per capita expenditure, the number of male household members aged below 18, and whether the household head is male are negatively associated with the probability of children undertaking the cognitive tests.
First stage (probit coefficients): participation of children in cognitive skills tests (years of schooling 2012–2016)
Note: Standard errors clustered at the household level are reported in parentheses. ***$p< 0.01$ ; **$p< 0.05$
 ; *$p< 0.1$
 .
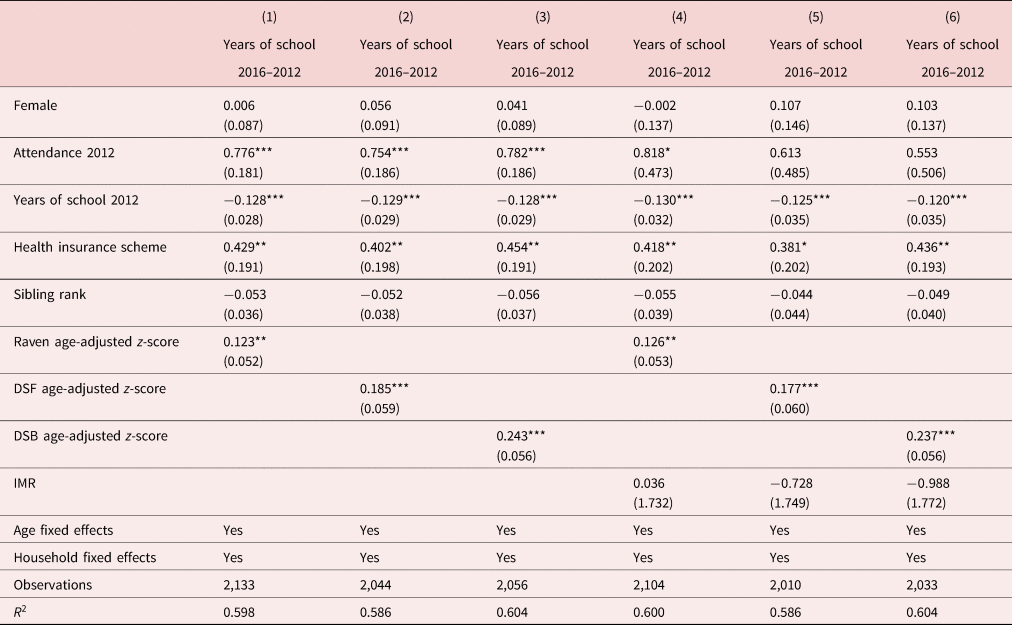
Table 4 reports the estimates for equation (4) using the three different measures of cognitive skills collected in 2012: the score in Raven, DSF, and DSB tests. The dependent variable in the analysis is the number of years that a child attends school between 2013 and 2016, calculated as the difference in years of schooling in 2016 and 2012. Columns 1–3 of the table show the results for the three cognitive skills tests when equation (4) is estimated without accounting for non-random uptake of the cognitive tests. The results suggest that the effect of cognitive skills is positive and statistically significant at conventional confidence levels: an increase of one standard deviation in the score in cognitive tests relative to the average score of the rest of the siblings is associated with an increase of 0.123–0.243 years of schooling between 2013 and 2016, depending on the cognitive measure used. When the IMR is included as a control variable to account for sample selection bias, the estimates displayed in columns 4–6 are very similar, with the effect of one standard deviation increase in the score of the cognitive tests relative to the average score of the rest of the siblings ranging between 0.126 and 0.237 years of schooling. Interestingly, the IMR is not statistically significant in these equations suggesting that at least in these estimates, the observed non-random uptake of the cognitive tests does not bias the estimation of the effect of cognitive skills on the allocation of schooling across siblings. We also estimate the robustness of the results to the exclusion of baseline educational controls in the analysis, which might be creating a problem of bad controls as defined in Angrist and Pischke (Reference Angrist and Pischke2009). The results, reported in Table A1 in the Appendix, show reassuring results.
Child cognitive skills and years of schooling 2012–2016 (children 5–18)
Note: Standard errors clustered at the household level are reported in parentheses. ***$p< 0.01$ ; **$p< 0.05$
 ; *$p< 0.1$
 .
A potential critique to the analysis reported in Table 4 is that the dependent variable measures school progression, which may not only be driven by school attendance but also by the cognitive skills of the child, which may directly influence his school marks and promotion to the next school year. Although grade promotion is automatic until senior secondary school and only less than 2% of the sample is currently or ever enrolled in post-junior secondary school educational levelsFootnote 12, it might be possible that the effects found are driven by the very most able children passing the BECE exam and accessing senior secondary school.
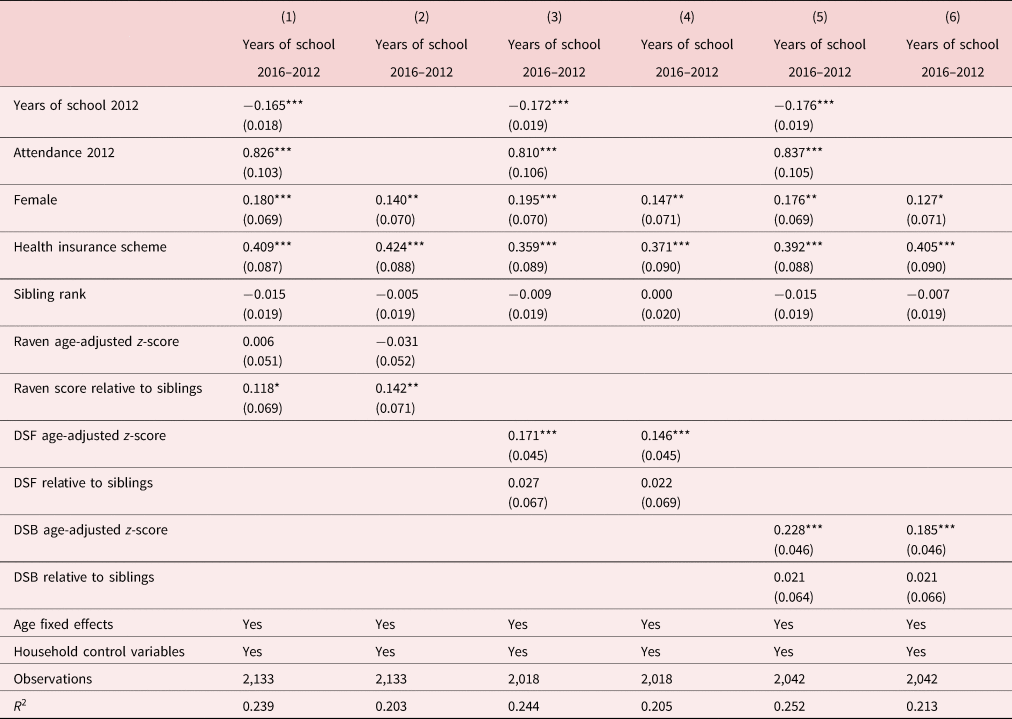
To explore this possibility, we conduct the following three analyses. First, we re-estimate equation (4) using only the sample of children aged 11 or below in 2012. During the period 2012–2016, these children were only eligible for pre-school, primary, or junior secondary education, where there is automatic course promotion at the end of the school course. The results of this analysis are reported in Table 5. Although the sample size used in this restricted sample and thus the statistical power is smaller, the coefficients of the cognitive tests are consistently positive and statistically significant for the DSF test, suggesting that the effect of cognitive skills on years of schooling during the period 2013–2016 identified in Table 4 is not driven by less able children being unable to achieve grade promotion at the end of the school year. Second, we re-estimate equation (4) using as dependent variable the sum between 2013, 2014, 2015, and 2016 of a dummy variable collected yearly that is equal to 1 if the child attends school at least once during the last 12 months. The estimates for this analysis are reported in Table A2 in the Appendix and show consistent results. The effect of an increase in one standard deviation in the score obtained in cognitive tests relative to the rest of the siblings is positive and in most specifications, statistically significant at conventional confidence levels. The magnitude of this effect ranges between 0.057 and 0.102 additional years of school attendance between 2013 and 2016 depending on the cognitive test used and on whether the selectivity correction term is included as an additional control variable. Finally, we estimate a specification similar to Sanz-de Galdeano and Terskaya (Reference Sanz-de Galdeano and Terskaya2019). In this analysis, we include as regressors both the score of the cognitive test of the children and a relative measure of cognitive skills that is defined as children's score in the cognitive test minus the average score in the cognitive test of the rest of the siblings. The results of this analysis are reported in Table 6. They show that the relative measures of cognitive skills are all positive although only statistically significant at conventional confidence levels for the Raven test. We estimate the specifications including the IMR in Table A3 in the Appendix and find positive and statistically significant effects for the relative measure of the Raven test.
Child cognitive skills and years of schooling 2012–2016 (children 5–11 in 2012)

Note: Standard errors clustered at the household level are reported in parentheses. ***$p< 0.01$ ; **$p< 0.05$
 ; *$p< 0.1$
 .
Child cognitive skills and years of schooling 2012–2016 (children 5–18) with a measure of relative ability
Note: Standard errors clustered at the household level are reported in parentheses. Household control variables include economic shock index, polyginy, number of children in the household, number of boys in the household, number of household members, years of schooling of the household head, age of the household head, and sex of the household head. ***$p< 0.01$ ; **$p< 0.05$
 ; *$p< 0.1$
 .
The results presented in this section are consistent with the main prediction of Becker's model: parents reinforce cognitive differences with their human capital investments. In a rural context where households have more than one child in school age and do not send all of them to school, more able children in the household are ceteris paribus more likely to attend school. This finding is also consistent with the results of previous studies that assess empirically the role of cognitive skills in the intra-household allocation of educational investments in Burkina Faso [Akresh et al. (Reference Akresh, Bagby, de Walque and Kazianga2012), Akresh et al. (Reference Akresh, Bagby, de Walque and Kazianga2016)], Ethiopia [Ayalew (Reference Ayalew2005)], and the US [Kim (Reference Kim2005), Sanz-de Galdeano and Terskaya (Reference Sanz-de Galdeano and Terskaya2019)].
8. Heterogeneous effects
We test further Becker's model by examining whether the reinforcement effect is different by gender of the child and household wealth.
8.1 Gender
In the sample, school attendance is more widespread and the average number of years of schooling is larger for girls (84% and 3.8) than for boys (78% and 3.4). GSS (2015) shows that a larger rate of school attendance among girls in primary school age than among boys is a well-established pattern in the Northern Region and the Upper-East Region, the areas where the districts sampled are located. At the national level, Ghana has no gender differences in terms of net enrollment rates in primary education. One possible explanation for this could be the launch in the late 1990's and early 2000's of The Ghana Education Trust Fund (GETFUND) and the Compulsory Universal Basic Education (FCUBE) program promoting school attendance in Ghana, which targeted particularly girls from poor households [GSS (2015)].
As explained in section 2, Becker's model predicts a stronger reinforcement effect for boys than for girls if the degree in which the returns to school investments for the child or for the parents depend on cognitive skills is stronger for boys, which is a plausible assumption in settings with low levels of female participation in the labor market.Footnote 13
To test whether the effect of cognitive skills on the allocation of school investments across siblings is stronger for boys, we estimate the following specification:

where $CognitiveSkills_{i, h}\,\ast\, Female_{i, h}$ is an interaction term of the score in the cognitive tests with a dummy variable that is equal to 1 if the child is a girl. $X$
 is a vector of child-level variables that include among others, a dummy variable that indicates the gender of the child and the IMR. In equation (5), the parameter $\omega _{1}$
 indicates the effect of increasing in one standard deviation the score in the cognitive test relative to the rest of the siblings on school attendance for boys. The effect for girls is yielded by the sum of the parameters $\omega _{1} + \omega _{2}$
 . The parameter of interest in the equation would be $\omega _{2}$
 . If the latter parameter is larger (lower) than 0, the effect of cognitive skills on years of schooling would be larger (lower) for girls than for boys.
The results of this analysis are reported in Table 7. The interaction term $Female \times CognitiveSkills$ is consistently negative suggesting that the effect of cognitive skills on the allocation of schooling across siblings is larger for boys than for girls although this coefficient is only statistically significant at conventional confidence levels for the cognitive measure of the Raven test and the DSB test.
Effect by gender: child cognitive skills and years of schooling 2012–2016 (children 5–18)
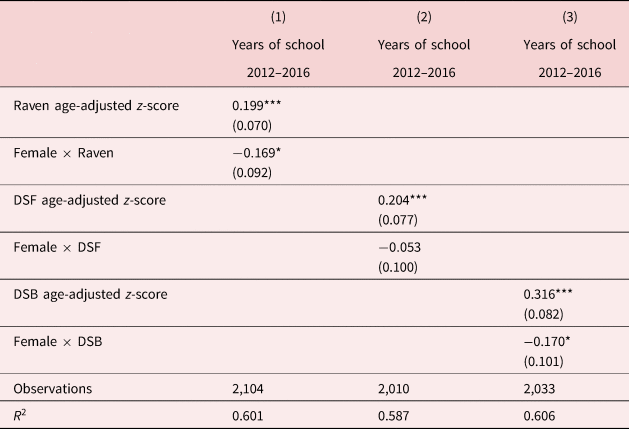
Note: All regressions include household fixed effects and additional control variables including female, attendance in 2012, years of schooling in 2012, sibling rank, IMR, age FE, and the interaction between all these variables and the variables indicating the sex of the child. Standard errors clustered at the household level are reported in parentheses. ***$p< 0.01$ ; **$p< 0.05$
 ; *$p< 0.1$
 .
8.2 Wealth
An additional prediction of the Becker's model is that, under some level of inequality aversion among parents, the reinforcing pattern in the allocation of human capital investments would be weaker (if any) in poor households because nonhuman capital resources are limited in these households and therefore, disadvantaged households would not be able to compensate less able children with larger nonhuman capital transfers.
To test whether the reinforcement pattern is stronger in wealthier households, we estimate the following regression:

where $CognitiveSkills_{i, h}\,\ast\, Wealth_{h}$ is an interaction term of cognitive skills with a set of dummy variables defined at the household level that capture whether the household is in the first, second, or third tercile in the distribution of per capita wealth in year 2012. In equation (6), the parameter $\omega _{1}$
 yields the effect of cognitive skills on the allocation of schooling across siblings in households in the bottom tercile of the per capita wealth distribution. The vector of parameters $\omega _{2}$
 is the estimates of first importance in this analysis. If the latter parameters are larger (lower) than 0, the effect of cognitive skills on schooling in these households would be larger (lower) than in the households in the poorest tercile.
The results of this analysis are reported in column 3 of Table 8. The effect of cognitive skills on school investments in the bottom tercile of households is consistently positive and statistically significant at conventional confidence levels for the Raven test and the DSB test. The parameters that measure the differential effect in households in the first and second tercile are overall negative indicating that on average, the lower the socioeconomic status, the stronger the effect of cognitive skills on the allocation of schooling across siblings. Although the sign of the coefficients for the interaction terms is not in line with the prediction of the Becker's model under some degree of aversion for sibling inequality, none of these coefficients is statistically significant at conventional confidence levels.
Effect by household wealth: child cognitive skills and years of schooling 2012–2016 (children 5–18)
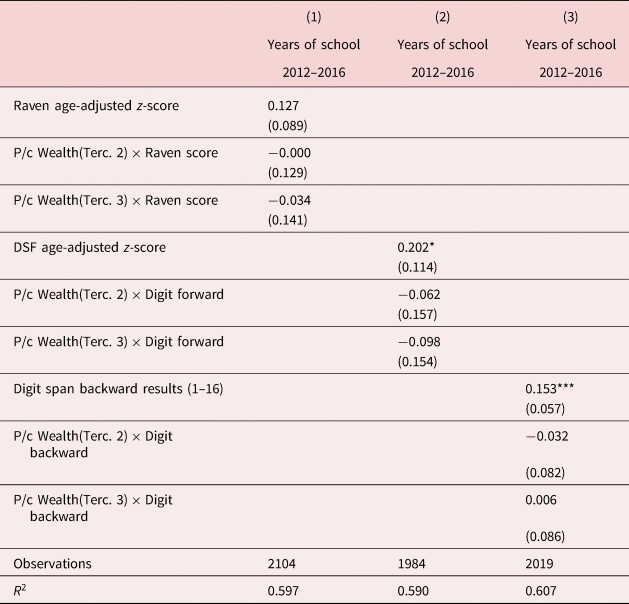
Note: All regressions include household fixed effects and additional control variables including female, attendance in 2012, years of schooling in 2012, sibling rank, IMR, age FE, and the interaction between all these variables and the variables indicating the tercile of the household in the wealth distribution. Standard errors clustered at the household level are reported in parentheses. ***$p< 0.01$ ; **$p< 0.05$
 ; *$p< 0.1$
 .
9. Conclusions
This study examines empirically a prediction of the model of intra-household allocation of resources developed in the seminal paper Becker (Reference Becker1981): with their investment in schooling, parents reinforce cognitive differences between siblings. More specifically, we find evidence that, in Northern Ghana, cognitive skills strongly affect the allocation of schooling across siblings. In the preferred set of specifications, an increase of one standard deviation in the cognitive tests score relative to the rest of the siblings, raises the number of years of schooling attended in the following three years significantly by 0.123–0.237, depending on the cognitive measure used. These results are consistent with the main prediction of Becker's model and are in line with most of the previous literature.
The evidence presented in this study suggests that policies aiming to increase education attendance in northern Ghana should take into account that parents seem to target their educational investments toward the most capable children rather than spreading these investments equally among all the children in the household. In this context, demand-side educational interventions such as conditional cash transfers that promote school attendance among less able siblings would be necessary to achieve universal schooling [Akresh et al. (Reference Akresh, Bagby, de Walque and Kazianga2012)].
The study also investigates how the effect of cognitive skills on school attendance across siblings varies by the gender of the child or by whether the household is wealthier or poorer. On the one hand and in line with Becker's prediction, the analysis suggests that the effect of cognitive skills on schooling is larger for boys. On the other hand, we do not find any evidence that the effect of cognitive skills on the allocation of schooling across siblings is significantly different in richer and poorer households, contradicting Becker's prediction.
Supplementary material
The supplementary material for this article can be found at https://doi.org/10.1017/dem.2022.24.
Competing interests
This paper has received funding from an Economic Research Council—Doctoral Training Program grant and from the Economic Research Council-funded project COSTPOST. No funding was received from any interested parties. The authors of this paper hold no relevant board or directorship positions.



