
1. Introduction
Superhydrophobic surfaces (SHS) are bio-inspired surfaces composed of hydrophobic patterned micro/nano-structures (Quéré Reference Quéré2008). The combination of roughness and hydrophobicity makes such surfaces water repellent, an attractive property for various applications (Quéré Reference Quéré2008). When immersed in water, SHS can trap an air layer, also called plastron, inside the microstructure (Bobji et al. Reference Bobji, Kumar, Asthana and Govardhan2009), opening the avenue for drag reduction applications since such surfaces exhibit significant effective slip lengths (Rothstein Reference Rothstein2010). However, the stability of the air layer against pressure fluctuations, induced by potentially turbulent flow (Castagna, Mazellier & Kourta Reference Castagna, Mazellier and Kourta2018; Seo, García-Mayoral & Mani Reference Seo, García-Mayoral and Mani2018) or against gas dissolution (Poetes et al. Reference Poetes, Holtzmann, Franze and Steiner2010), is a crucial problem in the development of such superhydrophobic (SH) coatings. Indeed, the air layer can be pushed inside the microstructure, and the SH state breaks down (Moulinet & Bartolo Reference Moulinet and Bartolo2007; Reyssat, Yeomans & Quéré Reference Reyssat, Yeomans and Quéré2007), i.e. a wetting transition occurs from a (gas-trapping) Cassie–Baxter to a (completely wetting) Wenzel state, and the surface drag coefficient increases dramatically (Karatay et al. Reference Karatay, Haase, Visser, Sun, Lohse, Tsai and Lammertink2013). Although substantial efforts have been invested in developing robust SHS (Verho et al. Reference Verho, Korhonen, Sainiemi, Jokinen, Bower, Franze, Franssila, Andrew, Ikkala and Ras2012; Xiang et al. Reference Xiang, Huang, Lv, Xue, Su and Duan2017), plastron stability still limits the useful applications of SHS.
To better understand SH breakdown, the wetting transition has been extensively studied in quasi-static configurations, such as in an evaporating droplet (McHale et al. Reference McHale, Aqil, Shirtcliffe, Newton and Erbil2005; Jung & Bhushan Reference Jung and Bhushan2007; Tsai et al. Reference Tsai, Lammertink, Wessling and Lohse2010; Bussonnière et al. Reference Bussonnière, Bigdeli, Chueh, Liu, Chen and Tsai2017), with surfactant additives (Shardt et al. Reference Shardt, Bigdeli, Elliott and Tsai2019; Aldhaleai & Tsai Reference Aldhaleai and Tsai2022), under different drop volumes (Yoshimitsu et al. Reference Yoshimitsu, Nakajima, Watanabe and Hashimoto2002) and pressures (Lafuma & Quéré Reference Lafuma and Quéré2003) or in dynamic situations, e.g. drop impact (Bartolo et al. Reference Bartolo, Bouamrirene, Verneuil, Buguin, Silberzan and Moulinet2006) or under surface vibrations (Bormashenko et al. Reference Bormashenko, Pogreb, Whyman and Erlich2007). For immersed SHS, wetting transition was mainly studied under static pressure (Poetes et al. Reference Poetes, Holtzmann, Franze and Steiner2010; Lv et al. Reference Lv, Xue, Shi, Lin and Duan2014). However, in the main application of underwater SHS (drag reduction), the pressure fluctuates due to the flow, which can become turbulent (Seo et al. Reference Seo, García-Mayoral and Mani2018).
Acoustic waves have the ability to impose precise pressure over an extensive frequency range. Moreover, sound waves strongly interact with bubbles (e.g. a plastron can be seen as an elongated bubble) in liquid. Therefore, an acoustic method can be a well-suited tool for submerged SHS characterization. Promising plastron acoustic monitoring was obtained by using longitudinal waves coming from the solid, from beneath the surface, to probe the wetting state by monitoring the back-scattered waves (Saad et al. Reference Saad2012; Dufour et al. Reference Dufour, Saad, Carlier, Campistron, Nassar, Toubal, Boukherroub, Senez, Nongaillard and Thomy2013; Li et al. Reference Li, Lamant, Carlier, Toubal, Campistron, Xu, Vereecke, Senez, Thomy and Nongaillard2014). However, this method requires calibration or precise knowledge of the morphology of the SH coating. Furthermore, elastic acoustic waves are not in contact with the air–water interface and, therefore, prohibit direct interaction with the gas–liquid interface. In Sudeepthi, Yeo & Sen (Reference Sudeepthi, Yeo and Sen2020), drop wetting transitions were triggered by surface acoustic waves through indirect interaction, i.e. through drop oscillations. Other authors studied submerged SHS as potential acoustic meta-materials (Feng et al. Reference Feng, Li, Xue, Sun, Yang, Pan and Cao2019; Tong et al. Reference Tong2020). However, the strong interaction between acoustic waves coming from the liquid phase and SHS remains unexplored. Such an acoustic method is expected to be versatile since the technique uses only one portable transducer to excite and receive waves, similar to non-destructive testing. The acoustic technique would hence be well suited to characterize SHS in applications or in complex environments (e.g. underwater) whereby classical optical techniques, such as confocal microscopy (Papadopoulos et al. Reference Papadopoulos, Mammen, Deng, Vollmer and Butt2013) or light interference (Moulinet & Bartolo Reference Moulinet and Bartolo2007) which require a microscope and transparent substrate, cannot be used.
In this paper, we propose to fill the gap by exploring experimentally the behaviour of immersed SHS subjected to short acoustic pulses of varying intensity. Different SHS and flat surfaces are exposed to acoustic pulses using the experimental set-up described in § 2. At low acoustic amplitude, various surfaces show different acoustic boundary conditions described in § 3.1. Cavitation behaviour is characterized at high amplitude in § 3.2. The wetting transition is observed at an intermediate intensity and discussed in § 3.3.
2. Experimental set-up
The experimental set-up shown in figure 1 consists of a high-intensity focused ultrasound (HIFU) transducer (Sonic Concepts H101, 1.1 MHz) which focuses short acoustic pulses onto an immersed surface with a circular focal area of 3 mm diameter. The acoustic excitation comprises three cycles of 1.1 MHz. To calibrate the pressure, we first map the acoustic field at a constant low amplitude using a needle hydrophone (Onda HNR-0500, bandwidth 0.25–10 MHz) mounted on a three-dimensional axis displacement stage and use the open source code solving nonlinear propagation (Khokhlov–Zabolotskaya–Kuznetsov equation) developed by Soneson (Reference Soneson2009) and Maruvada et al. (Reference Maruvada, Liu, Soneson, Herman and Harris2015) to fit the experimental results. The hydrophone is then kept at the focal point (for low amplitude) and at the secondary lobe (for high amplitude), and the amplitude is varied. Combining the acoustic mapping, pressure amplitude measurements and the nonlinear simulation, we finally obtain the calibrated pressure field for a specific supply voltage of the acoustic drive (see the Appendix).
Schematic of the experimental set-up. Short acoustic pulses are emitted by a high-intensity focused ultrasound transducer and focused on the tested surface held by a glass coverslip. The dynamics is monitored from the side and from the bottom by two high-speed cameras.

Four surfaces are used in this study to compare different behaviours under acoustic excitation: glass, flat polydimethylsiloxane (PDMS) and two PDMS SHS. The SHS and flat PDMS surface are first placed on a glass surface and then introduced at the focal point. The SHS consist of micro-scale cylindrical pillars of  $5.5\ \mathrm {\mu }{\rm m}$ in diameter (
 $D$) and
 $5 \ \mathrm {\mu }{\rm m}$ in height (
 $H$), organized in a square lattice. SHS 1 and 2 have a periodicity
 $P$ of
 $14.1\ \mathrm {\mu }{\rm m}$ and
 $7.6\ \mathrm {\mu }{\rm m}$, respectively. The SHS are made by pouring liquid PDMS into a Si mould, after which it is vacuumed, cured and finally peeled off as the samples. The PDMS surfaces are 3 mm thick. Once introduced at the focal point, the surface dynamics is monitored by two high-speed cameras (Photron AX200 and AX100), while the HIFU transducer records the back-scattering sound at low amplitude. A long range microscope is mounted on a camera to record from the side, while the second camera is used with a mirror to image the dynamics from the bottom (see figure 1).
3. Results and discussion
3.1. Initial wetting state
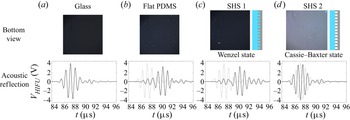
The initial wetting state for the different surfaces is compared in figure 2 using the bottom view and acoustic reflection at small amplitude. Glass, flat PDMS and SHS 1 surfaces appear black from the bottom view, indicating that the light coming from the bottom is not reflected, and hence the solid surfaces are fully wet. The bottom view of the SHS 2 surface is much brighter, indicating that the bottom light is reflected by air–water interface, and thus an air layer is trapped inside the micro-structure. The stability of the Cassie–Baxter state has been predicted by Bico, Thiele & Quéré (Reference Bico, Thiele and Quéré2002) based on an energy analysis. They show that an air layer will be stable if the contact angle of the constitutive material on a flat surface  $\theta _f$ obeys
 \begin{equation} \theta_f>\theta_c,\quad \textrm{with}\ \cos{\theta_c}=\frac{\varPhi-1}{R-\varPhi}, \end{equation}
where  $R=1+{\rm \pi} D H/P^2$ is the roughness, and
 $\varPhi =({\rm \pi} D^2)/(4P^2)$ is the solid fraction. Our SHS 1 (SHS 2) has a roughness
 $R=1.43$ (
 $R=2.5$) and a solid fraction of
 $\varPhi =0.12$ (
 $\varPhi =0.41$), leading to a critical contact angle
 $\theta _c=134^\circ$ (
 $\theta _c=106^\circ$). The water contact angle on flat PDMS is
 $\theta _f=110\unicode{x2013}115^\circ$ (Mata, Fleischman & Roy Reference Mata, Fleischman and Roy2005). In agreement with the theoretical prediction, the
 $\theta _f$-value for the flat PDMS is smaller than
 $\theta _c$ for the SHS 1 surface so water invades the microstructure. For the SHS 2 surface
 $\theta _f> \theta _c$, therefore, a stable air layer is trapped between the micropillars, as observed in the experiments.
Comparison of the initial wetting state of the different solid surfaces submerged in water. The first row of images shows the bottom view by a high-speed camera, while the second row of data are the back-scattered sound detected by monitoring the voltage of the transducer. For comparison, the acoustic reflection from the glass surface solely (bottom left) is added in grey for the other surfaces.

The back-scattered sound of the different surfaces is then analysed at a small amplitude. The HIFU transducer voltage averaged over ten pulses is shown in figure 2. For all surfaces, echoes are detected at  $85\ \mathrm {\mu }{\rm s}$, corresponding to the time required for an acoustic wave to travel to the focal point and return to the transducer. The reflected pulse has the same shape as the incoming pulse for the glass surface. For the flat PDMS and the SHS 1, the back-scattered pulse is more complex and consists of a first small amplitude reflection followed by a second higher reflection similar to the glass case. More surprisingly, the back-scattered sound from the SHS 2 is only made of a strong pulse with a
 ${\rm \pi}$-phase change, compared with the incoming pulse.
These observations can be explained using linear acoustics. The pressure reflection coefficient ( $r$) of acoustic plane waves on an interface is given by
 ${r_{i,j} = (Z_j-Z_i)/(Z_i+Z_j)}$, with
 $Z_i = \rho _i c_i$ the acoustic impedance,
 $\rho _i$ and
 $c_i$ the density and sound velocity in the medium
 $i$. The subscript
 $i$ (
 $j$) represents the medium supporting the incident (transmitted) pulse. The different interfaces present in our experiments have the following reflection coefficient:
 $r_{w,g} = 0.8$ for water/glass interface,
 $r_{w,p} = -0.18$ for water/PDMS,
 $r_{w,a} = -1$ for water/air and
 $r_{p,g} = 0.85$ for PDMS/glass (Xu et al. Reference Xu, Ni, Chen, Tu, Guo, Bruus and Zhang2020). For the water–glass interface,
 $r_{w,g}$ is positive and close to 1, and the back-scattered pulse is expected to be of high amplitude without phase change, as observed in figure 2. The flat PDMS and SHS 1 surfaces are held by a glass plate, and the incoming pulse will first encounter the water/PDMS interface leading to a first weak reflection since
 $r_{w,p}$ is small. A non-negligible part of the pulse is transmitted to the PDMS and then reflected by the PDMS/glass interface, generating the second strong echo since
 $r_{p,g}$ is high.
Finally, the back-scattered sound coming from the SHS 2 surface is solely made of a strong pulse with  ${\rm \pi}$-phase change, in agreement with a reflection on a water/air interface as
 $r_{w,a}=-1$. This confirms the presence of an air layer inside the SHS 2 microstructure, as optically observed, demonstrating that acoustics can be of great use to probe plastron stability. The absolute value of the reflection coefficient of the water/air interface is higher than the coefficient of water/glass (
 $|r_{w,a}|>|r_{w,g}|$). The amplitude of the back-scattered signal from SHS 2 should therefore be higher than the one from the glass surface, but the measured reflections are of similar amplitude (see figure 2). This discrepancy might be ascribed to the fact that the SHS 2 interface is not a pure water/air interface but a mixture of water/air and PDMS pillars (41 % of the surface is PDMS), which modifies the reflection coefficient.
3.2. Cavitation behaviour
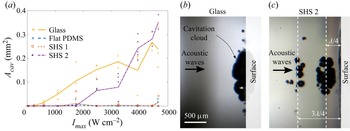
The solid surfaces were subjected to high-intensity pulses of different amplitudes to characterize their cavitation behaviour. The cavitation is monitored by side-view images (see figure 3b–c) taken during the acoustic excitation when cavitation clouds are visible. The area of such cavitation cloud ( $A_{cav}$) is measured and compared for the different surfaces under various excitation amplitudes in figure 3(a). Although the data are scattered, which is expected for cavitation experiments, it can be seen that only a few small cavitation bubbles appear on flat PDMS and on the SHS 1. In contrast, significant cavitation is observed on the glass surface and the SHS 2. The flat glass surface exhibits cavitation at low acoustic excitation, while a cavitation cloud appears later for SHS 2.
(a) Area of the cavitation cloud ( $A_{cav}$, captured from the side view) as a function of the maximum incident acoustic intensity (
 $I_{max}$) for the different solid surfaces. Points in (a) represent the area of one experiment, while the solid lines represent the average values. (b–c) Side-view images of the cavitation cloud on glass surface (in b) and on SHS 2 (in c) appearing for an incident maximum intensity of
 $3.9\ {\rm kW}\ {\rm cm}^{-2}$.

The ability of surfaces or liquids to cavitate under relatively small pressure excitation, well above the spinodal pressure of water ( ${\sim }-140$ MPa) (Zheng et al. Reference Zheng, Durben, Wolf and Angell1991), is determined by the presence of micro/nanobubbles trapped in surface defects or impurities, called cavitation nuclei (Harvey et al. Reference Harvey, Barnes, McElroy, Whiteley, Pease and Cooper1944). Stabilization of such nuclei on a surface requires a hydrophobic geometrical defect called a crevice (Atchley & Prosperetti Reference Atchley and Prosperetti1989; Bussonniere, Liu & Tsai Reference Bussonniere, Liu and Tsai2020). When subjected to low enough negative pressure (i.e. cavitation threshold), such nuclei become mechanically unstable, and cavitation bubbles appear.
The different cavitation responses are therefore either due to a difference in nuclei population and/or in local negative pressure. The first nuclei source in the experiments comes from tap water, which contains many impurities and thus a large number of nuclei. However, the same water was used in all experiments, and hence these nuclei could not explain the cavitation differences observed. The second source of nuclei comes from the different solid surfaces. The PDMS is naturally hydrophobic, which should favour nuclei trapping compared with hydrophilic glass. However, this soft material is expected to have little, if no, sharp defects (crack like) due to its polymerization from a liquid form, which can explain why almost no cavitation on flat PDMS was detected (figure 3). Similarly, SHS 1 in a Wenzel wetting state, although being micro-textured with cylindrical pillars, is not expected to have sharp crevices, which can explain the small cavitation activity observed. Glass, on the other hand, can have small cracks, potentially leading to significant cavitation activity as observed on glass.
The other important factor for cavitation is the local negative pressure, which is greatly influenced by the acoustic boundary condition. The acoustic wave reflected by a surface with a factor of  $r$ interferes with the incident wave, resulting in a local minimum pressure, which can greatly differ from the incident minimum pressure,
 ${P}_{{min}}^{{inc}}$. For example, at the interface between water and a surface
 $j$, the minimum pressure is
 ${P}_{{j}}^{{wall}}=(1+r_{w,j})\ {P}_{{min}}^{{inc}}$. The minimum pressure is therefore amplified on the glass surface (
 ${P}_{glass}^{wall}=1.8\ {P}_{min}^{inc}$), reduced on flat PDMS and SHS 1 (
 ${P}_{pdms,shs1}^{wall}=0.8\ {P}_{min}^{inc}$), or almost cancelled on SHS 2 (
 ${P}_{shs2}^{wall}\approx 0$). This simplified analysis is in agreement with the experiments, where cavitation clouds appear on the surface for glass (figure 3b), whereas no cavitation is observed upon the surface of SHS 2 (figure 3c). Note that the small bubbles on the top of figure 3(b) are actually on the surface, although they appear away from it due to the slight tilt between the camera and the surface.
Interference between the incident and reflected waves also occurs away from the surface. If a continuous excitation were used, a standing wave in the liquid would have been generated. However, here, we use short pulses with only 2 periods with a significant amplitude. Wave interference therefore only occurs in the surface vicinity, in a region of approximately one wavelength ( $\lambda$). Local minima generated by the transient standing wave depend on the reflection coefficient sign. If
 $r>0$, the pressure anti-nodes are located on the surface, at
 $\lambda /2$ and
 $\lambda$ away for the surface. Differently, if
 $r<0$ the minimum pressures are located at
 $\lambda /4$ and
 $3\lambda /4$ away from the surface. The above analysis may be consistent with the experimental data, which reveal that the cavitation cloud appears at
 $\lambda /4$ and
 $3\lambda /4$ for the SHS 2 experiments. However, with the analysis one would have expected the appearance of cavitation at
 $\lambda$ and
 $\lambda /2$ in the experiments with the glass surface and not only on the surface.
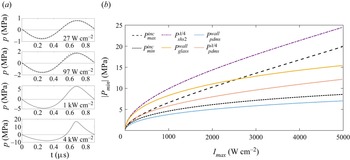
To understand this discrepancy for the glass surface, one needs to analyse the high acoustic intensity used in the experiments. Under such strong excitation, the acoustic propagation is nonlinear, and the acoustic waveform departs from a simple cosine function, as shown in figure 4(a). The solid lines represent the results from the nonlinear acoustic simulations. The simulation results are in good agreement with the experimental data (crosses) at low values of  $I_{max}$. Note that the measurements at the focal point can only be performed at low intensity to prevent deterioration of the hydrophone by cavitation. As detailed in the Appendix, the acoustic field at high intensity was calibrated by measuring the pressure at the second pressure lobe (after the focal region). As
 $I_{max}$ increases, the waveform become asymmetric, and the maximum incident pressure
 ${P}_{max}^{inc}$ increases faster than the absolute minimum pressure
 $|{P}_{min}^{inc}|$, as shown in figure 4(b).
(a) Incident waveform at the focal plane for different maximum incident intensities ( $I_{max}$). The simulation results (solid lines) using the nonlinear acoustic code (Soneson Reference Soneson2009) are compared with the experimental measurements (cross points) at low intensity. (b) Evolution of the minimum and maximum incident pressure (
 ${P}_{{min,max}}^{{inc}}$) and of the minimum local pressure (
 ${P}_{{surface}}^{{position}}$) at a specific position for a surface with the maximum incident intensity (
 $I_{{max}}$).

Such asymmetry has important implications in the local minimum generated in the interference region. For  $r > 0$, the local minima located at
 $\lambda$,
 $\lambda /2$ and on the wall are equal to
 ${P}_{{j}}^{\lambda }={P}_{{j}}^{\lambda /2}={P}_{{j}}^{{wall}}=(1+r_{w,j}) {P}_{{min}}^{{inc}}$. However, for
 $r<0$, the reflected wave is inverted (with a phase change by
 ${\rm \pi}$), and the local minimum pressures are
 ${P}_{{j}}^{3\lambda /4}={P}_{{j}}^{\lambda /4}={P}_{{min}}^{{inc}}-r_{w,j}{P}_{{max}}^{{inc}}$. Figure 4(b) shows the minimum pressures generated by the combination of nonlinear acoustics and the reflection for the different surfaces. As the reflection from SHS 2 at low intensity (figure 2) has the same amplitude as the glass surface, we use
 $r_{w,shs2}=-0.8$ to better estimate the reflection. Due to the reflection of the strong maximum incident pressure, minimum pressures in SHS 2 experiments reach the lowest level, which explains the biggest cavitation cloud observed. Cavitation with SHS 2 appears at
 $I=2.5~{\rm kW}\ {\rm cm}^{-2}$, i.e. at
 ${P}_{{shs2}}^{\lambda /4}\approx - 16$ MPa, which corresponds to the threshold for cloud cavitation in water. Pressure in the glass experiment only reaches
 ${P}_{{glass}}^{wall}\approx - 15$ MPa at the maximum intensity. This explains why no clouds are observed in water for the glass cases. Cavitation, in this case, occurs only on the glass interface due to the presence of surface nuclei. It should be noted that the nonlinear waveform reflected with a phase shift of
 ${\rm \pi}$ is unstable and will recover to a sine wave at the transducer, as shown by Tanter et al. (Reference Tanter, Thomas, Coulouvrat and Fink2001).
3.3. Wetting transition
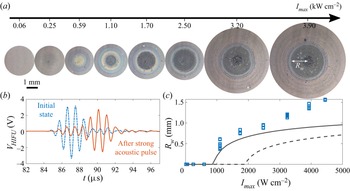
The stability of the SH state is also studied by using the bottom camera and the acoustic reflection at a small amplitude. Figure 5(a) shows the images from the bottom taken after the exposure of SHS 2 to different intense acoustic pulses. Note that the surface is moved between each high impulse experiment, so each trial is performed on a fresh area of the SHS. For intensities smaller than  ${\approx }0.1\ {\rm kW}\ {\rm cm}^{-2}$, the air layer remains unchanged, as shown by the brownish colour. Starting at
 $0.25\ {\rm kW}\ {\rm cm}^{-2}$, a change in colour is observed, and a clear interference colour pattern appears at
 $0.59\ {\rm W}\ {\rm cm}^{-2}$. These colours arise from the white light interference inside the air layer of the SHS and indicate that the air-layer thickness has decreased at the focal region due to the acoustic pulse. For
 $I_{max}> 1.1\ {\rm kW}\ {\rm cm}^{-2}$, a dark disk appears in the centre surrounded by interference fringes. The radius of this disk increases with the acoustic intensity, and its evolution with
 $I_{max}$ is reported in figure 5(c).
(a) Bottom view of SHS 2 after exposition of different high-intensity acoustic pulses showing the appearance of interference fringes and a wetted region in black of radius ( $R_w$). (b) Acoustic reflection of the SHS 2 of a small amplitude pulse before (blue) and after (red) the exposure to a high-intensity pulse of
 $I_{max}=2.5\ {\rm kW}\ {\rm cm}^{-2}$. (c) Evolution of the wetted radius (
 $R_w$) observed experimentally as a function of the maximum acoustic intensity (
 $I_{max}$). The solid and dashed lines correspond to the wetted radius predicted by the sliding and touch-down models, respectively.

This black disk might correspond to a local SH breakdown (i.e. wetting transition) since SHS 1, which did not trap an air layer, appears black in figure 2. To verify this, the acoustic reflection signals at low amplitude from the SHS 2 surface before (shown in dashed blue) and after (shown in red) an intense acoustic pulse of  $2.5\ {\rm kW}\ {\rm cm}^{-2}$ are compared in figure 5(b). Before, the reflection corresponds to an air–water reflection, as shown in figure 2. The reflection after the high-intensity pulse is drastically changed and is similar to the reflection of SHS 1 of figure 2. This observation confirms that high-intensity pulses trigger a local wetting transition, corresponding to the dark area where water penetrates inside the microstructure. It should be noted that this transition occurs at an amplitude smaller (
 $I_{max}=1.1 \ {\rm kW}\ {\rm cm}^{-2}$) than that of the appearance of the cavitation cloud (
 $I_{max}=2.5\ {\rm kW}\ {\rm cm}^{-2}$), ruling out a transition driven by cavitation.
The transition from a Cassie–Baxter to a Wenzel wetting state is usually understood by looking at the local force balance of the air–water interface in contact with the microstructure. A small pressure increase in the liquid phase is balanced by a capillary pressure arising from the bending of the interface between pillars (Quéré Reference Quéré2008). At higher liquid pressure, the interface can either touch the bottom of the SHS (i.e. touch-down scenario) or slide on the pillar when the local contact angle on the pillars reaches the advancing one (i.e. sliding scenario) (Moulinet & Bartolo Reference Moulinet and Bartolo2007; Reyssat et al. Reference Reyssat, Yeomans and Quéré2007). These different scenarios are associated with two critical liquid pressures
 \begin{equation} p_t^c\approx\frac{2\gamma H}{(\sqrt{2}P-D)^2}, \end{equation}
for the touch down, with  $\gamma$ the air–water surface tension, and
 $\theta _a$ the advancing contact angle; for the sliding (Moulinet & Bartolo Reference Moulinet and Bartolo2007)
 \begin{equation} p_s^c=\frac{2\varPhi}{1-\varPhi}|\cos{\theta_a}|\frac{2\gamma}{D}. \end{equation}
Previously, we showed that the oscillating acoustic pressure at the SHS 2 interface almost vanishes due to the acoustic boundary condition, and thus the fast-oscillating acoustic pressure (at 1.1 MHz) cannot explain the wetting transition. Nonetheless, acoustic waves are known to apply radiation pressure to interfaces (Borgnis Reference Borgnis1952) and are commonly used to trap objects in acoustofluidics (Bruus Reference Bruus2012). Such radiation forces arise from a change of medium momentum induced by the acoustic scattering or reflection of an interface or an object (Westervelt Reference Westervelt1957; Baresch, Thomas & Marchiano Reference Baresch, Thomas and Marchiano2013). These radiation forces originate from the difference between the time-averaged acoustic energy densities, i.e. radiation pressure, across the interface. It is a cumulative process, and these forces hence occur on a longer time scale than the fast-oscillating acoustic pressure. If we assume that the SHS 2 behaves as a pure water–air interface and an incident angle of 90 $^o$, the radiation pressure applied on the interface is given by (Borgnis Reference Borgnis1952)
 \begin{equation} p_{rad}(r)=\frac{2I(r)}{c}, \end{equation}
with  $I$ the incident acoustic intensity,
 $c$ the sound speed in water and
 $r$ the radial coordinate on the surface centred on the focal axis. The acoustic intensity, and thus the radiation pressure, depends on
 $r$ due to the HIFU geometry, as shown in figure 6(b). The wetting transition would occur if
 $p_{rad} > p_{s,t}^c$, and a critical radius
 $r_c$ can be extracted from the simulated intensity field whereby
 $p_{rad}(r_c) = p_{s,t}^c$. The predictions for
 $r_c$ using the sliding and touch-down models presented above are compared with the experimental data in figure 5(c) for
 $\theta _a = 110^\circ$.
Evolution of the maximum acoustic pressure in the axial (a) and radial (b) directions at low amplitude. The red lines correspond to the prediction of the acoustic simulation using the nonlinear code (Soneson Reference Soneson2009), while the blue dots represent the experimental points. (c) Evolution of the input pressure of the simulation ( $p_{sim}$) fitting the different maximum and minimum measurements as a function of the generator voltage (
 $V_{gen}$).

This simplified model predicts the beginning of the transition around  $I_{max}=900\ {\rm W}\ {\rm cm}^{-2}$ for the sliding scenario, which is in good agreement with the experimental data. Moreover, the wetted radius
 $R_w$ agrees well with the critical radius predicted in the range
 $1\unicode{x2013}2.5 \ {\rm kW}\ {\rm cm}^{-2}$ of
 $I_{max}$. The good agreement indicates that the wetting transition occurs where the acoustic beam is more intense and also validates the wetting transition as being driven by radiation pressure. It should be noted that the interference pattern starts to appear at a lower intensity (see figure 5(a) for
 $I_{max} = 0.59\ {\rm kw}\ {\rm cm}^{-2}$). This may suggest that the interface starts to slide at lower radiation pressure than predicted but does not reach the microstructure bottom. A more comprehensive analysis involving time dependence, similar to the one done for a free surface in Issenmann et al. (Reference Issenmann, Wunenburger, Chraibi, Gandil and Delville2011), is needed to better understand the interface motion under radiation pressure. In addition to developing such a complex model, a study of the influence of pulse duration and a better acoustic calibration would be needed to fully capture the interface dynamics in the future.
For larger intensity, the water penetration area is underestimated by the sliding model. This deviation coincides with the appearance of an intense cavitation cloud, which can reflect an acoustic wave and also create a strong pressure during its collapse. Therefore, the local acoustic field is expected to greatly differ from the simple combination of an incident and reflected wave, thereby modifying the radiation pressure on the surface. Note that the local acoustic field can be inferred from the imprint left on the SHS. In figure 5(a), concentric grey circles surrounding the wetted area appear and are spaced by  ${\approx }\lambda /4$. However, such circles cannot be explained by the secondary lobes of the incident beam, spaced by
 ${\approx }\lambda$ (see figure 6b), which tends to support a strong modification of the acoustic field by the cavitation cloud.
4. Conclusions
We investigate the acoustic responses of SHS subjected to short intense pulses. Experiments at low amplitude reveal that when a SHS is able to stabilize an air layer (in a Cassie–Baxter state) the acoustic waves are reflected with a  ${\rm \pi}$ phase shift similar to an air–water interface. In a Wenzel state, a patterned surface behaves as a flat surface of the same material, and the microstructure has no influence on the acoustic reflection.
At high amplitude, intense cavitation is observed for the glass surface and SHS in a (Cassie–Baxter) gas-trapping state, while almost no cavitation is detected for flat PDMS surface and PDMS SHS in a Wenzel state. This difference is mainly attributed to the acoustic boundary condition. For a hard material, such as glass, the pressure on the solid surface is nearly doubled, leading to the appearance of a cavitation cloud on the surface. For the flat and wetted patterned PDMS surfaces (i.e. flat and SHS in Wenzel state), the pressure on the surface is slightly lowered due to the close match in acoustic impedance with water. For SHS in a Cassie–Baxter state, the interference between the reflected and the incident wave results in a significant negative pressure away from the surface (at  $\lambda /4$ and
 $3\lambda /4$), where intense cavitation clouds form. Moreover, cavitation, in this case, is amplified by the conversion of the strong high pressure peaks arising from nonlinear propagation into great negative pressure by the reflection on the air layer.
The wetting transition from Cassie to Wenzel state is observed at moderate intensity before cavitation appears. The transition is shown to be driven by the acoustic radiation pressure, which overcomes the critical capillary pressure required to let the interface slide into the microstructure. The simplified model proposed well captures the transition and the size of Wenzel area at moderate intensities. For higher intensity, strong interaction with the cavitation cloud is expected to modify the local acoustic field, resulting in a deviation from the proposed model.
Underwater SHS are mainly studied in the context of drag reduction. In such an application, pressure on the plastron is governed by the hydrodynamics, and the flow can trigger a wetting transition. In this context, our results at low amplitude can contribute to developing non-destructive acoustic monitoring of the plastron stability. Moreover, the critical breakdown pressure of a SH coating could be characterized and measured using acoustic pulses at moderate intensity. For future studies, an accurate measurement of this breakdown pressure would require a better calibration of the acoustic field and more extensive studies on the influence of the pulse duration and excitation frequency.
Acknowledgements
A.B. thanks Professor R. Wunenburger for fruitful discussions.
Funding
This work was supported by the Collaborative Research and Development (CRD) of the Natural Sciences and Engineering Research Council of Canada (NSERC) and the Canadian Centre for Clean Coal/Carbon and Mineral Processing Technologies (C5MPT). P.A.T. holds a Canada Research Chair (CRC) in Fluids and Interfaces. This research was undertaken, in part, thanks to funding from the CRC Program.
Declaration of interests
The authors report no conflict of interest.
Appendix. Acoustic calibration
The acoustic field is first mapped at low amplitude using a needle hydrophone mounted on a three-axis stage. This field is then used to find the parameter of the HIFU transducer (focal length and radius) in the nonlinear simulation (Soneson Reference Soneson2009). The axial distribution,  $z$, the distance from the transducer, is measured along the axisymmetric axis, as shown in figure 6(a). The simulated field captures well the pressure field in the focal region and peripheral lobes. Nonetheless, a slight deviation is observed for
 $z$ below 40 mm. The radial distribution shown in figure 6(b) is measured in a plane perpendicular to the
 $z$-axis at the maximum pressure, i.e. at
 $z = 62$ mm. The simulation results are in good agreement with the experimental measurements.
At higher amplitude, cavitation occurs in the focal region, and no direct measurement can be performed using the hydrophone (as the intense cavitation can damage the hydrophone). Therefore, the nonlinear simulation is used to obtain the pressure at high intensity. The unknown in the simulation is the pressure imposed at the transducer surface ( $p_{sim}$). In the experiment, we impose a voltage at the output of the generator (
 $V_{gen}$) which is then amplified and converted into pressure by the HIFU. To calibrate our experiment using the simulation we therefore need to find the relation between
 $p_{sim}$ and
 $V_{gen}$. To find such relation we measured the maximum and minimum pressures (
 $p_{max}^{foc}$ and
 $p_{min}^{foc}$) at low amplitude at
 $z=62$ mm (in the focal region) and over a large range of voltages in the secondary lobes (
 $p_{max}^{2nd}$ and
 $p_{min}^{2nd}$) located at
 $z=81$ mm. Simulations were then performed for different amplitudes of
 $p_{sim}$, and the functions
 $p_{max}^{foc}(p_{sim})$,
 $p_{min}^{foc}(p_{sim})$,
 $p_{max}^{2nd}(p_{sim})$ and
 $p_{min}^{2nd}(p_{sim})$ were extracted. These functions were inverted to convert the experimental measurement into
 $p_{sim}$ values. In figure 6(c), we show the results of this treatment as a function of
 $V_{gen}$. All the experimental points collapse into a single line, which is fitted with a third-order polynomial without a constant term. Note that the curve tends to saturate, which seems to indicate a saturation of the voltage amplifier limited at 200 W (E&I 1020L).