
Introduction
With the advent of ubiquitous telecommunication networks and the expansive development of wireless electronics operating in the gigahertz (GHz) regime, “electromagnetic pollution” has risen to unprecedented levels.[Reference Kong, Li, Liu, Huang, Abshinova, Yang, Tang, Tan, Deng and Matitsine1] Electromagnetic interference (EMI) arises when spurious or intended electromagnetic (EM) signals radiated by electronic circuits interfere with the normal operation of surrounding equipment.[Reference Geetha, Kumar, Rao, Vijayan and Trivedi2] Research pertaining to EMI shields has been conducted since the 1940s, and there currently exist many commercial options to reflection and absorb EM energy to minimize the occurrence of EMI.[Reference Qin and Brosseau3]
An emerging approach to absorbance dominated EMI shielding is the use of conductive polymer composite foams. As compared with non-porous materials, foams exhibit lower density, lower percolation thresholds, and higher EMI shielding efficiency (SE) that is largely dominated by absorption.[Reference Kumar, Singh, Chand, Pant, Kotnala, Dhawan, Mathur and Dhakate4–Reference Gedler, Antunes, Velasco and Ozisik6] The porous morphology decreases the impedance mismatch between air and the shield allowing a larger portion of the incident EM wave to penetrate into the shield where it can be absorbed and dissipated.[Reference Dhakate, Subhedar and Singh7] However, foamed polymer composites have shielding characteristics that are highly dependent on the morphology of the finished foam, which is in turn highly sensitive to the specific conditions of the foaming process.[Reference Gedler, Antunes and Velasco8, Reference Gedler, Antunes, Borca-Tasciuc, Velasco and Ozisik9] Developing optimized polymer foam composites is a complex process that requires the screening of many different factors including material compositions, foaming temperature, foaming time, and depressurization rate, to name a few.
This work focuses on the development of a new methodology for designing and producing periodic porous EMI shields that begin with intrinsic EM property measurement, continues with finite element modeling using these parameters to identify the optimal geometries, ends with fabricating the desired composite using 3D printing or compression molding. We demonstrate the results of the first two design steps with a commercially available 3D printing filament material.
Experimental details
Materials and manufacturing of 3D printed structures
3D printed samples were produced using commercially available Black Magic 3D© (BM3D) filament, which is a polylactic acid (PLA)-based filament that has been mixed with 16 wt% carbon-based particles. A commercial pure PLA filament purchased from 3DX Tech was used to print pure PLA samples. 3 mm thick 3D printed samples were produced using a Maker M3 Fused Filament Fabrication 3D printer. For all samples, the infill density was set to 100%. The samples were oriented such that the long axis is parallel to the printing direction/during printing the extruder temperature was set at 220 °C, and the build table was set at e 50 °C. The print speed was 40 mm/s with an extrusion multiplier of 1.1.
EM characterization
Two-port scattering parameter measurements of BM3D and PLA plaques were performed over the X-band (8–12 GHz) using an Anritsu MS4644B vector network analyzer (VNA) at room temperature and normal pressure. The setup for VNA measurements is shown in Fig. 1(a). Fabricated rectangular samples were filed down to ensure a tight fit between the sample and the waveguide holder since small air gaps can lead to error in measurement. Complex EM parameters were extracted from scattering parameter measurements using the Nicolson–Ross–Weir method as implemented in the Keysight Materials Measurement Suite.
(a) Setup for waveguide measurements. Rectangular sample sits in between two X-band waveguides connected to a VNA. Schematic of unit cell used in COMSOL simulations without (b) and with (c) an air filler pore. Lossy material with a predefined porous geometry is exposed to EM radiation with incident angle θ. PML and PEC form the top and bottom. The unit cell is periodic in the x–y plane and finite in the z direction.

Modeling
Finite Element Modeling was performed in COMSOL. The modeled geometry consists of a 3D periodic Cartesian lattice with a unit cell that contains arbitrarily shaped air-filled pores inside of a material with defined frequency dependent EM parameters. The Radio Frequency module is used to perform full-field calculations of either a Transverse Electric or Transverse Magnetic wave generated at an excitation port. Incident EM waves also have a predefined angle of incidence, θ. Mesh refinement is used to maintain minimum element quality greater than 0.2. Reflection loss (RL) is calculated in the X-band (8–12 GHz) with sampling every 0.2 GHz. A characteristic unit cell is shown in Fig. 1(b). The wavelength of incident EM waves ranges from 2.5 to 3.75 cm. The unit cell repeats periodically in the x–y plane of periodicity and has a finite thickness in the z-direction. The top of the cell is terminated by a perfectly matched layer (PML) to prevent secondary reflections, and the bottom of the cell is terminated by a perfect electrically conducting (PEC) sheet.
Results
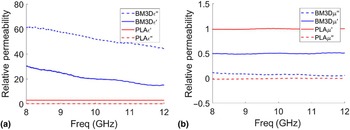
To test our design methodology, we used commercially available BM3D and PLA filament. BM3D is a PLA-based 3D filament that has a low bulk volume resistivity of 0.6 Ω cm due to the addition of 16 wt% carbon content that includes graphene, carbon nanotubes, and carbon black. We measured the complex permittivity and permeability of this material in the X-band and the results are shown in Fig. 2.
(a) Complex permittivity and (b) complex permeability of pure PLA and BM3D filaments as measured in the X-band.

The measured permittivity and permeability for PLA are in good agreement with literature values.[Reference Huber, Mirzaee, Bjorgaard, Hoyack, Noghanian and Chang10] The complex permeability of PLA is what we would expect for a nonmagnetic material. The imaginary component of the permittivity, which correlates to the dissipation of electrical energy within the polymer composite material, is high for BM3D. This indicates that there is a large amount of network formation within the material leading to the high mobility of charge carriers and energy dissipation.[Reference Sarvi and Sundararaj11] For BM3D, the real permeability lower than 1.0 can be attributed to the diamagnetic behavior of carbonaceous materials.[Reference Gupta, Al Moayed, Khan, Obol and Afsar12]
In foamed materials, much of the enhancement in SE is attributed to the addition of porosity; the addition of pores reduces impedance mismatch and also increases the number of scattering events once the wave has penetrated into the bulk material.[Reference Soltani Alkuh, Famili, Mokhtari Motameni Shirvan and Moeini13] However, the morphology of foams is highly sensitive to processing conditions. Furthermore, final foam morphologies cannot be predicted a priori and shielding properties are difficult to model due in part to the inhomogeneity of the foam morphology. Therefore, we use FEM simulations to predict the shielding properties of a homogeneous, porous, and periodic morphology using the extracted complex permittivity and permeability measurements.
Scattering parameter simulations are performed in COMSOL and final RL is calculated according to Eq. (1).
 $$\hbox{RL} = - 20\,\log _{10}\vert {S_{11}} \vert $$
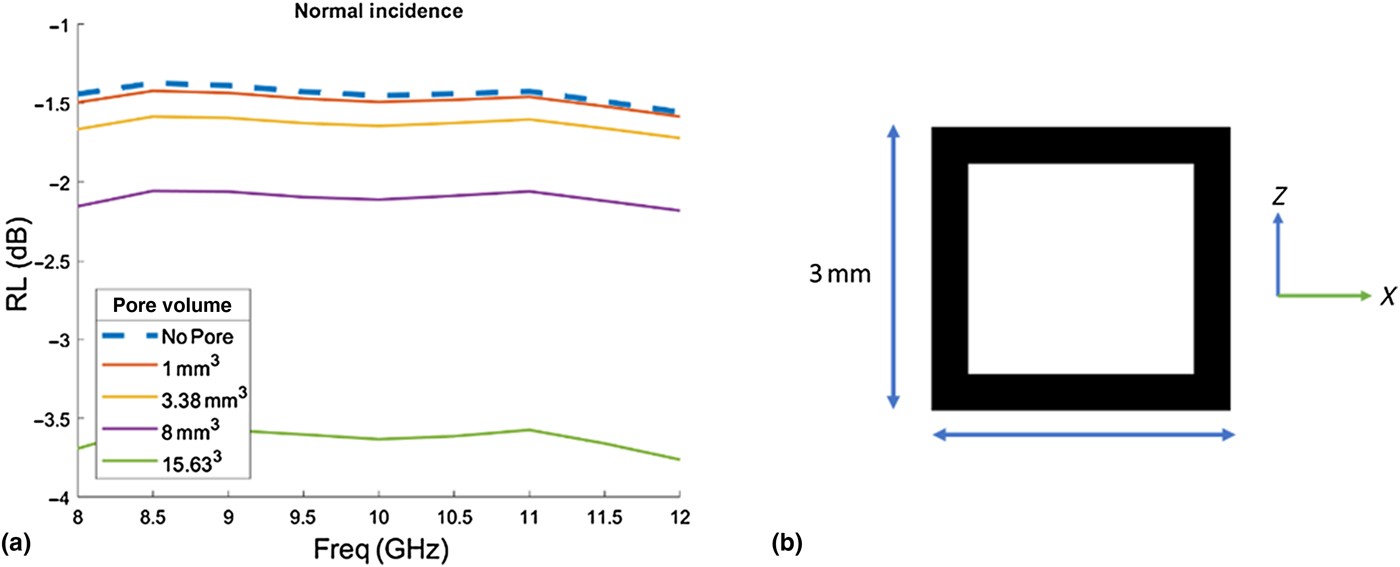
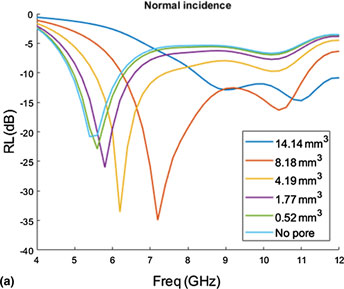
Figure 3 depicts the change in RL upon the addition of a single cubic pore to the center of a 3 mm thick BM3D plaque and the effect of gradually increasing the pore volume. At normal incidence, the absorbing behavior of BM3D improves as the pore size increases. It is well known that dielectric mismatch causes reflection at interfaces, such as the one between BM3D and air. By modifying the morphology of our plaque, we are effectively decreasing the dielectric constant and making it closer to that of air. The introduction of the pore also increases the number of scattering events that can occur inside of the composite. This means that more incident microwave energy will be dissipated as heat. Because of its high conductivity, BM3D has limits as a material for absorption focused EMI shielding. Without a reduction in conductivity, the impedance mismatch at the surface will still lead to reflection dominated shielding.
(a) Simulated change in RL at normal incidence of BM3D filament with a single cubic pore of changing volume. (b) Schematic of pore placement in the model geometry.

For the design of an absorption dominated EMI shield, there are a few key materials and geometric properties such as the lowering of front face impedance mismatch, and the presence of dissipation pathways inside the material through the addition of magnetic or conductive fillers. The relative impedance of a material, Z, is given by Eq. (2) where μ r and ε r are the complex permeability and complex permittivity of the material.
 $$Z = \sqrt {\displaystyle{{\mu _{\rm r}} \over {\varepsilon _{\rm r}}}} $$
For the air, this value is 1. Materials that have relative impedances that are closer to 1 experience less front face reflection. To lower material impedance, one can use lower conductivity materials as well as the addition of magnetic components that increase the permeability. The addition of magnetic material can also increase the magnetic loss tangent, further contributing to the absorption of incident EM radiation.
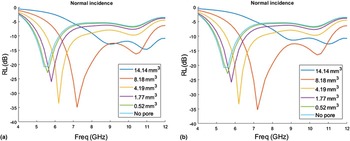
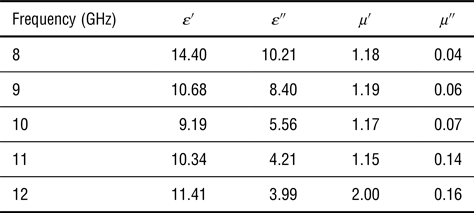
To investigate the effect of simple geometric changes on RL for a low conductivity, magnetically enhanced material, we adapted literature values for the complex permittivity and permeability of a 30 wt% graphene/Fe3O4 paraffin wax composite as shown in Table I.[Reference Song, Guan, Fan, Cao, Zhao, Wang and Cao14] Shown in Figs. 4(a) and 4(b) are the effects of adding either a cubic pore or a spherical pore to a 3 mm thick composite layer. An unmodified 3 mm thick sample achieves a minimum RL of −22.8 dB at 5.5 GHz. If we add a pore and isometrically change the pore volume, we see that the minimum RL not only decreases by as much as 13 dB but the minimum peak shifts towards higher frequencies. Additionally, as we add larger pores, the effective absorption bandwidth (RL ≤ 10 dB) increases from 2.4 to 6.3 GHz. The trend is similar for cubic and spherical pores.
Simulated change in RL at normal incidence of 3 mm thick sample of a 30 wt% graphene/Fe3O4 paraffin wax composite with a single cubic pore (a) and single spherical pore (b) as a function of pore volume.

Electromagnetic properties of 30 wt% Fe3O4/GN-3 as adapted from Song (2016).

Discussion
The study of foamed materials for EMI shielding has been steadily growing in recent years. This work describes a methodology for optimizing the pore geometry based on the intrinsic material properties. The morphologies of foamed materials are achieved through a combination of temperature, pressure, filler type, and filler dispersion that is presented in each new system. When foaming is used, the products display high absorptive capability, but only after several lengthy optimization steps. Due to the importance of a well-controlled, repeatable, and less resource intensive method for EMI shield development, a high-throughput computational approach is highly desirable.
3D printing and compression molding are potentially versatile and facile methods to produce high-quality polymer composite EMI shields. Our three-step approach allows for model-guided optimization of the polymer composite foams. Monte-Carlo simulations combined with derivative-free optimization techniques can effectively sample a much larger parameter space that is unavailable in a laboratory setting. The greater degree of control and repeatability that is offered by different fabrication methods presents further advantages for future EMI shields since the shape and size of pore morphology play important roles in EMI shielding technologies.
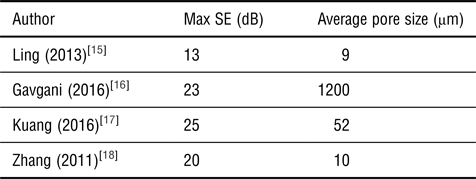
The preliminary results of this study show the strong dependence of pore geometry of the RL peak seen in Figs. 2 and 3. In previous studies involving the effect of morphology on the shielding properties of polymer composite foams, an increase in material absorption has been associated with smaller pore morphologies.[Reference Zakiyan, Azizi and Ghasemi19] Ling (2013) showed that as the pore size diameter decreased from 15.3 to 9 µm, there was a corresponding increase in SE of almost 20 dB. However, the decrease in pore size was the result of an increase in graphene loading from 1 to 10%.[Reference Ling, Zhai, Feng, Shen, Zhang and Zheng15] This common trend seen in polymer composite foams is often used as a justification for pursuing materials with very small pore morphologies and high pore densities. However, it is also known that by simply increasing conductive filler content, independent of morphology, can also lead to an increase in SE.
Our research suggests two things. First, in many polymer composite foams, an inverse relationship between the size of the pore diameter and the increase in SE is commonly reported.[Reference Shen, Zhai, Tao, Ling and Zheng5, Reference Bin Zhang, Yan, Zheng, He and Yu18] Smaller pores, for a given volume, lead to a higher density of pores, and thus more scattering events. However, as compared with experimental results shown in Table II, our model predicts that we can achieve a max SE of 35 dB with a pore size 2.5 mm. Our modeled shielding effect is higher than that of the foamed materials in Table II. The pore size is also of the order of millimeters instead of microns. This opens up avenues for producing polymer composite EMI shields to higher throughput techniques that make up in speed what they lack in resolution.
Reported max SE of a variety of different foamed materials.

Second, the decrease in RL is not a monotonic trend, indicating that the effect of pore morphology requires a more complex investigation than simple parametric experimental or computational studies. In foamed materials, the addition of larger pores showed a roughly monotonic decrease in RL up until 8.18 mm3. However, increasing the pore volume to 14.14 mm3 not only caused a dramatic shift in the position of resonance peaks but also greatly increases the value of the RL. By exploring a truly continuous parameter space through a computational approach, one can arrive at optimal morphologies for EMI shielding.
Conclusion
In summary, the development of new design methodology for EMI shields shows potential for improving the way that polymer composite EMI shields are designed. Using the measured complex EM properties of a commercially available conductive 3D printing filament as well as those of a magnetic polymer composite from literature, our modeling showed significant improvement in RL through simple geometric modification. The addition of a single cubic pore to the center of a periodic unit cell lowered the RL. The analysis of RL for different pore shapes is also possible through computational exploration. It was seen that pore volume does not correlate to a monotonic decrease in RL. Future studies will focus on translating design methodology to the fabrication of optimized EMI shields.