


Non-invasive measurement of the left ventricular ejection fraction in children is important for both clinical assessment of individuals with congenital heart disease and allowing investigation of its developmental influences on cardiac structure and function.
Traditional two-dimensional echocardiographic measures of the left ventricular function include visual assessment and measures such as the M-mode-derived ejection fraction, left ventricular volume estimations using Simpson's approximation or the area length method, and indices of myocardial performance such as the Tei index.Reference Gutgesell 1 , Reference Mor-Avi, Lang and Badano 2 These methods can be time-consuming and all have limitations, predominantly related to the underlying geometric assumptions necessary for calculation and the angle dependency of measurements, which creates an additional source of variation.
The current gold standard for left ventricular functional assessment is cardiac magnetic resonance imaging; however, this method is costly and often requires general anaesthesia in children. Cardiac magnetic resonance imaging is also not feasible in certain post-operative situations wherein a simple and quick assessment of cardiac function is needed.
Two-dimensional speckle tracking echocardiography allows one to measure myocardial movement by tracking bright echo signatures within the myocardium.Reference Geyer, Caracciolo and Abe 3 This method is not angle-dependant and may enable accurate assessment of cardiac function. A number of studies on adults have demonstrated that mitral valve displacement assessed using two-dimensional speckle tracking echocardiography is a marker for the left ventricular function that is comparable to cardiac magnetic resonance imaging.Reference DeCara, Toledo, Salgo, Lammertin, Weinert and Lang 4 , Reference Tsang, Ahmad and Patel 5 The tissue motion annular displacement (TMAD) application of Philips QLAB 9.1 (Philips UK Ltd, United Kingdom) allows this angle-independent tracking of mitral valve displacement through the cardiac cycle. TMAD of the mitral valve has not been used in tracking mitral valve displacement in children.
The overall ejection of the left ventricle is a combination of longitudinal and circumferential deformations. The middle circumferential layer of the left ventricle has long been recognised and is felt to represent the actuating fibres of the left ventricle.Reference Anderson, Sanchez-Quintana, Niederer and Lunkenheimer 6 Initial focus on the ventricular function in adults has been related to circumferential shortening, although the importance of longitudinal shortening has been well recognised over the past decade.Reference Henein and Gibson 7 – Reference Donal, Coquerel and Bodi 9 In children, this circumferential layer is less prominent and it may be that longitudinal deformation plays a greater role in the overall ejection of the left ventricle.Reference Sanchez-Quintana, Garcia-Martinez, Climent and Hurle 10 TMAD focuses on longitudinal displacement in predicting the ejection fraction, and we feel that it may play an important role in assessment of the ventricular function in the younger age group.
In this study, we sought to compare the ejection fraction derived from mitral valve displacement using two-dimensional speckle tracking echocardiography and TMAD with that derived from cardiac magnetic resonance imaging and M-mode in healthy children.
Methods
Southampton Women's Survey background
Between 1998 and 2002, the Survey team interviewed over 12,583 women from Southampton who were aged between 20 and 34 years. Those who became pregnant after the interview were invited to take part in the pregnancy phase of the survey. The women underwent ultrasound scans at 11, 19, and 34 weeks of pregnancy, and their babies were measured soon after birth. There were 3156 babies born to the women included the study between 1998 and 2007. The survey has also followed up these children by means of home visits at 6 months, 1 year, and 2 and 3 years. Some children also visited our clinic at the Southampton General Hospital at the ages of 4, 6, and 8 years; some were seen at home at the age of 6 years.Reference Inskip, Godfrey, Robinson, Law, Barker and Cooper 11
This study is under the umbrella of the Southampton Women's Survey, looking more specifically into the maternal, foetal, and post-natal determinants of cardiovascular structure and function. The children who are at present under follow-up are all between 9 and 10 years of age. At the time of the study, 70 children underwent both cardiac magnetic resonance imaging and transthoracic echocardiography.
All children who had undergone both transthoracic echocardiography and cardiac magnetic resonance imaging at the time of this study were included. Children were excluded from the final data analysis if the echocardiographic images were not suitable for processing, based on their quality or the use of an incorrect echocardiography probe. A total of 22 children were excluded because of either a poor image quality (n = 11) or acquisition of certain images using a Philips S8 probe, which is not compatible with the software required for the analysis (n = 11).
Two-dimensional transthoracic echocardiography
Echocardiography was performed using a Philips IE33 machine, with the images being acquired using either an X7-2 or an S5 echocardiography probe (Philips Medical Systems, Philips UK Ltd, United Kingdom). Apical four-chamber views were saved for offline analysis using the Philips QLAB version 8.1 cardiac motion quantification software.
M-mode
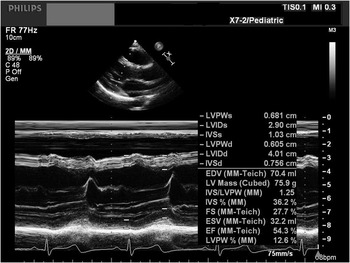
In all patients, standard M-mode echocardiography was performed in the parasternal long axis view, and the left ventricular ejection fraction was calculated using the Teichholz method (Fig 1).
A 2-D TTE of a parasternal long axis image of the LV, which was used for calculation of the M-mode ejection fraction using the Teichholz method. 2D TTE = two-dimensional transthoracic echocardiogram; LV = left ventricle.
TMAD
The TMAD function was used to assess the displacement of the mitral valve annulus. Three points were selected in a diastolic frame: one at the lateral margin of the mitral valve annulus, one at the medial margin of the mitral valve annulus, and a third at the left ventricular apex. Values generated automatically included displacement in millimetres of the lateral and medial mitral valve annulus, displacement of the midpoint of the mitral valve annulus, and the left ventricular shortening fraction expressed as a percentage (Fig 2).
A four-chamber apical view of the LV used for tracking mitral valve displacement. Points are selected at the medial (1) and lateral (2) mitral valve annulus and LV apex (square). The points are automatically tracked through the cardiac cycle, producing a curve indicating the displacement over time. Two curves are generated representing displacement of the medial and lateral points of the mitral valve annulus. Colour kinesis demonstrates mitral annular displacement. Values are generated for maximum displacement of the medial, lateral, and midpoint of the mitral valve annulus, and a percentage is calculated indicating the LV longitudinal shortening fraction. LV = left ventricle.

A quadratic formula, previously described by De Cara et al, was used to estimate the left ventricular ejection fraction from the TMAD midpoint. The equation used is as follows:
Ejection fraction = −0.2 (TMAD midpoint displacement)2 + 7.4 (TMAD midpoint displacement) − 0.9.Reference DeCara, Toledo, Salgo, Lammertin, Weinert and Lang 4
Cardiac magnetic resonance imaging
Cardiovascular magnetic resonance imaging scans were performed using a 1.5 T MRI scanner (Avanto, Siemens Medical Systems, Erlangen, Germany) with a phased array spine coil in combination with a torso array coil. A short axis stack of contiguous 7 mm thick steady-state free precession cine images was acquired. Scans were planned from an end-diastolic four-chamber steady-state free precession image to cover from the base of the left ventricle at the level of the mitral valve to the apex. The sequence parameters were as follows: repetition time, 43.65; echo time, 1.24; field of view, 280 mm; and flip angle, 72°. The scans were acquired on an inspiratory breath-hold and were ECG gated retrospectively.
Images were analysed using the open source Osirix imaging analysis software. The end-diastolic and end-systolic phases were identified at each slice position as those showing the largest and the smallest cavity area, respectively. The left ventricular endocardial and epicardial borders were manually traced at the end-diastolic and end-systolic phase for each slice position, with the endocardial trabecullae and papillary muscles included in the myocardial mass and excluded from the blood volume. The most basal image was selected at the end-diastolic and end-systolic phases, with the myocardium extending over at least 50% of the myocardial circumference. Using Simpson's rule for measuring volumes, wherein the cavity volume is estimated by the sum of the cross-sectional areas of multiple single slices multiplied by the slice thickness, the end-diastolic and end-systolic volumes were obtained. The left ventricular ejection fraction was determined using the formula (end diastolic volume − end systolic volume)/end diastolic volume).
Statistics
When appropriate, the variables were transformed using logarithms or square roots to satisfy the statistical assumptions of normality. The statistical techniques used in the analyses were two-tailed t-tests for mean values and Pearson's correlation (r) for analyses of continuous outcomes. Paired t-tests were used to compare cardiac magnetic resonance imaging-derived and TMAD-derived ejection fractions for each individual. Significance was regarded as a p-value < 0.05. The results are reported in terms of mean values (standard deviations). The Bland–Altman analysis was performed to compare the measures of the ejection fraction using different methods. All data were analysed using SPSS version 19.
Reproducibility
Measurements for TMAD and M-mode were repeated by the initial investigator 3 months after the initial measurements using a random sample of 20% of the total patients included in the study. A second investigator performed measurements on this sample a month after the initial measurement to obtain interobserver variability. Each investigator was blinded to the previous results. Bland–Altman analysis was then performed to determine the bias, limits of agreement, and coefficient of variation for interobserver and intraobserver variabilities.
Results
A total of 48 children who underwent both cardiac magnetic resonance imaging and two-dimensional transthoracic echocardiography studies were included in the final analysis. Characteristics of the children are shown in Table 1.
Subject characteristics.

SBP = systolic blood pressure; DBP = diastolic blood pressure; HR = heart rate; BMI = body mass index
The mean (standard deviation) left ventricular ejection fraction derived from cardiac magnetic resonance imaging (64.5 (4.6)) was similar to that derived from the TMAD midpoint (60.9 (2.7), p for difference from cardiac magnetic resonance imaging = 0.001) and the M-mode (61.9 (7), p for difference from cardiac magnetic resonance imaging = 0.012) (Table 2). The derived ejection fractions from both TMAD and M-mode were statistically significantly different to that derived from cardiac magnetic resonance imaging; this difference, however, was small and could not be considered clinically significant in this study population. The TMAD midpoint correlated strongly with the cardiac magnetic resonance imaging-derived ejection fraction (r = 0.69, p < 0.001), as did the predicted ejection fraction (r = 0.67, p < 0.001; Fig 3). The M-mode-derived ejection fraction showed a poor linear correlation with both the cardiac magnetic resonance imaging and tissue motion annular displacement values (r = 0.33 and 0.04, respectively; Table 2). The Bland–Altman analysis of the difference between the measurements of the ejection fraction derived from TMAD and M-mode compared with those derived from cardiac magnetic resonance imaging is demonstrated in Figures 4 and 5. Those derived from TMAD showed a less variation compared with those derived from M-mode (coefficients of variation of 6% and 14%, respectively).
Left ventricular functional data for study cohort.

CMRI = cardiac magnetic resonance imaging; EF = ejection fraction; TMAD = tissue motion annular displacement
Graphic display of the correlation between CMRI-derived LVEF and TMAD midpoint displacement of the mitral valve (r = 0.69) and the predicted LVEF from the quadratic formula (r = 0.67). CMRI = cardiac magnetic resonance imaging; LVEF = left ventricular ejection fraction; TMAD = tissue motion annular displacement.

The Bland–Altman plot comparing the ejection fraction derived from magnetic resonance imaging with that derived from TMAD midpoint displacement using a quadratic formula. This shows that the differences between the measurements observed were dispersed around the mean, with the majority staying within the limits of agreement (−4 to 10). The mean difference between the two measurements was not found to be statistically significant, with a coefficient of variation of 6%. TMAD = tissue motion annular displacement.

The Bland–Altman plot comparing the LVEF derived from cardiac magnetic resonance imaging with that derived from M-mode using the Teicholz method. This shows that the differences between the measurements observed were dispersed around the mean, with the majority staying with the limits of agreement. There was a wider limit of agreement (−10 to 17.0). The mean difference between the two measurements was not found to be statistically significant. There was however a larger coefficient of variation of 14%. LVEF = left ventricular ejection fraction.

Reproducibility
The interobserver variability showed a strong correlation for TMAD with a coefficient of variation of 3.7%. The intraobserver variability was equally strong with a coefficient of variation of 1.6% (Figs 6 and 7). Coefficients of variation for the end-diastolic volume, end-systolic volume, and left ventricular ejection fraction using cardiac magnetic resonance imaging were 8%, 10.9%, and 4.4%, respectively. For all parameters, the variability between participants was greater than the interstudy and interobserver variabilities combined.Reference Bryant, Hanson, Barton and Peebles 12
The Bland–Altman plot for intraobserver variability for TMAD. The intraobserver variability was small, with a coefficient of variation of 1.6%. The differences between the measurements observed were dispersed around the mean and stayed within the limits of agreement (0.95 to −1.95). TMAD = tissue motion annular displacement.

The Bland–Altman plot for interobserver variability for TMAD. The interobserver variability showed a strong correlation for TMAD, with a coefficient of variation of 3.7%. The differences between the measurements observed were dispersed around the mean and stayed within the limits of agreement (2.95 to −2). TMAD = tissue motion annular displacement.

Discussion
Mitral valve annular motion has been studied in adults using a number of methods; these include M-mode echocardiography, two-dimensional transthoracic echocardiography, three-dimensional transthoracic echocardiography, and tissue Doppler echocardiography.Reference Nevo, van Stralen and Vossepoel 13 Tissue Doppler velocities measured at the lateral mitral valve annulus have been used to assess the left ventricular function, with lower velocities indicating a poorer left ventricular function.Reference Yamada, Oki, Tabata, Iuchi and Ito 14 When compared with TMAD, this technique can be time-consuming and difficult to perform, with poor transthoracic windows, and is angle-dependent and affected by cardiac translation. The method of tracking the mitral valve using two-dimensional speckle tracking echocardiography has been verified, and a number of recent studies using this method in adults have demonstrated the accuracy of assessing mitral valve displacement in estimating the left ventricular function.Reference DeCara, Toledo, Salgo, Lammertin, Weinert and Lang 4 , Reference Tsang, Ahmad and Patel 5 , Reference Haruki, Takeuchi and Gerard 15 Roberson et al have shown that mitral annular displacement is linearly related to the ejection fraction and other parameters of longitudinal systolic function. In their paper, they calculated a displacement index, which is based on the Doppler tissue imaging-derived mitral annular systolic peak S-wave velocity time integral divided by the end-diastolic distance from the mitral annulus to the left ventricular apex. This paper supports the use of mitral annular displacement in assessment of the left ventricular ejection fraction.Reference Roberson and Cui 16 TMAD uses two-dimensional speckle tracking technology to calculate mitral displacement by tracking three points; this can be easily performed with a rapid assessment of the left ventricular ejection fraction. The use of TMAD to track mitral valve displacement and correlating this with the cardiac magnetic resonance imaging-derived ejection fraction has not been undertaken previously in children.
The exact nature of cardiac structure and function has not yet been established. There are proponents of the theory that the heart consists of a helical myocardial band, which is responsible for the pattern of cardiac contraction.Reference Nasiraei-Moghaddam and Gharib 17 , Reference Buckberg 18 This structure of the heart has been demonstrated through live dissection by Torrent–Guasp, and more recently has been confirmed through imaging studies using diffusion tensor magnetic resonance imaging.Reference Nasiraei-Moghaddam and Gharib 17 The helical arrangement of the myocardial fibre architecture has been observed from neonates to adults.Reference Notomi, Srinath and Shiota 19 This helical arrangement of fibres is responsible for the wringing or torsional nature of left ventricular contraction. Notomi et al have shown an age-related increase in left ventricular torsion, which they correlated with a change from the initial counter-clockwise rotation of the base of the heart in infancy to a clockwise pattern in adolescence; this change is believed to be due to the orientation of the myocardial fibres, which are more longitudinally orientated in early childhood and become more oblique with age and increasing heart size.Reference Notomi, Srinath and Shiota 19
Opponents of this theory describe cardiac myocytes as forming part of a continuous complex mass supported by a collagenous matrix.Reference Anderson, Sanchez-Quintana, Niederer and Lunkenheimer 6 , Reference Anderson, Ho, Redmann, Sanchez-Quintana and Lunkenheimer 20 – Reference Sengupta, Korinek and Belohlavek 23 These myocytes are arranged in a complex three-dimensional manner with no obvious order, and therefore no individual anatomical unit, and hence the opposition to the concept of a helical myocardial band. The overall orientation of the long-axis myocytes can however be recognised. Anatomical studies of the myocardium have shown three distinct layers in the left ventricle: superficial, middle, and deep. The middle layer has a circumferential orientation of myocytes and is more prominent in elderly hearts.Reference Sanchez-Quintana, Garcia-Martinez, Climent and Hurle 10 , Reference Ho 24
Common to both schools of thought is the myoarchitectural change from neonates to adults, which has an effect on the mechanics of cardiac contraction. Wulfsohn et alReference Wulfsohn, Nyengaard and Tang 25 reported that with growth, myocardial fibres connect points at the base and apex that are increasingly farther apart circumferentially. The myocardial fibres in a smaller heart are therefore more longitudinally orientated, and assessment of the longitudinal function in this context would be important. The observation that the middle layer of the myocardium, which has a circumferential orientation, is less prominent in children further supports this notion.
Assessment of left ventricular function using speckle tracking echocardiography has produced normal values across age ranges for global longitudinal and circumferential deformations.Reference Marcus, Mavinkurve-Groothuis and Barends 26 Although these normal data for ventricular deformation in children have been published, the relative contributions of longitudinal deformation and circumferential deformation to overall ejection fraction through different age ranges have not previously been elucidated. In children, we feel that the contribution of longitudinal deformation to the overall ejection fraction is more significant compared with adults. TMAD potentially is a more accurate assessment of the global ejection fraction as it assesses this longitudinal function. Ventricular dysfunction may be underestimated using traditional methods such as M-mode, and TMAD may provide an assessment of the longitudinal function that is both accurate and reproducible.
The use of TMAD for determining the left ventricular function would be extremely useful in the intensive care unit for the assessment of post-operative patients. It is a portable, quick, and reproducible measure of the longitudinal left ventricular function. Although, at present, the IE33 does not allow one to perform this measure at the bedside, it could be easily incorporated and may become part of the standard assessment of ventricular function. This simple method of assessing the longitudinal function of the heart could be applied across different age groups including foetuses; this may lead to further insights into the developmental influence on the cardiac function.
Prior studies on adult patients have shown the use of TMAD in assessment of the right ventricular function and have correlated right ventricular longitudinal shortening with the cardiac magnetic resonance imaging-derived ejection fraction.Reference Ahmad, Mor-Avi and Lang 27 Further studies are needed to assess right ventricular TMAD in children as well as its correlation with cardiac magnetic resonance imaging.
Limitations
The limitations of our study include a retrospective analysis of the echocardiographic images. A number of participants were excluded because of poor quality of images and the inability of the software to track the left ventricular apex. In some of the patients, the echocardiographic images were acquired using a probe not suitable for two-dimensional speckle tracking echocardiography. The quality of image acquisition has been highlighted as an area of importance when applying speckle tracking echocardiography, and in our study this was no different.Reference Friedberg and Mertens 28 , Reference Mertens and Friedberg 29 However, we do feel that the simplicity of this technique does enable the assessment of cardiac function in patients with poor transthoracic windows, and when performed prospectively we have rarely had difficulties in obtaining appropriate images. Although this paper provides a set of normal values of mitral TMAD in children, it is restricted to a particular age group, and ongoing studies need to be carried out to define these values across a broader age range. This method is accurate and reproducible in the age range studied, and we feel that it could be applied across all age ranges. Ongoing work at our institution seeks to define normal ranges across all age ranges for both left ventricular and right ventricular TMAD.
Conclusion
TMAD of the mitral valve is a simple, effective, and highly reproducible method of assessing left ventricular function in normal children. It shows a strong linear correlation with cardiac magnetic resonance imaging-derived left ventricular ejection fractions and is superior to M-mode-derived ejection fractions. Further studies are needed to establish age-related normal values and to assess its usefulness in the post-operative period and in various disease states.
Acknowledgements
The authors would like to acknowledge the efforts of all those involved in the Southampton Women's Survey.
Ethical Standard
All aspects of the study were approved by the Southampton and SW Hants Local Research Ethics Committee as part of the Southampton Women's Survey and research into the maternal, foetal, and post-natal determinants of cardiovascular structure and function in children. Participants gave written informed consent, and the study was carried out in accordance with the Declaration of Helsinki.



