Several lines of research have converged in showing a robust association between parenting components such as parental negativity and child and adolescent behavior problems (Hill, Reference Hill2002). Both cross-sectional (Hiramura et al., Reference Hiramura, Uji, Shikai, Chen, Matsuoka and Kitamura2010; Kaiser, McBurnett, & Pfiffner, Reference Kaiser, McBurnett and Pfiffner2010) and longitudinal studies (Burt, McGue, Krueger, & Iacono, Reference Burt, McGue, Krueger and Iacono2005; Larsson, Viding, Rijsdijk, & Plomin, Reference Larsson, Viding, Rijsdijk and Plomin2008; Leve et al., Reference Leve, Harold, Ge, Neiderhiser, Shaw and Scaramella2009; Viding, Fontaine, Oliver, & Plomin, Reference Viding, Fontaine, Oliver and Plomin2009) have indicated that negative parenting constitutes a risk factor for child and adolescent externalizing disorders such as conduct disorder, oppositional defiant disorder, and attention-deficit/hyperactivity disorder, as well as internalizing problems such as emotional and social difficulties. Because the home environment is a crucial developmental context for children, parental practices and their contribution to children's behavior have been intensively investigated (Hiramura et al., Reference Hiramura, Uji, Shikai, Chen, Matsuoka and Kitamura2010). Positive parenting, such as parental warmth, has been associated with higher levels of peer acceptance and lower aggressive behavior in children (Clark & Ladd, Reference Clark and Ladd2000; Davidov & Grusec, Reference Davidov and Grusec2006; Mrug et al., Reference Mrug, Elliott, Gilliland, Grunbaum, Tortolero and Cuccaro2008; Russell, Robinson, & Olsen, Reference Russell, Robinson and Olsen2003); negative parenting has been linked to externalizing symptoms and social difficulties in children (Belsky, Hsieh, & Crnic, Reference Belsky, Hsieh and Crnic1998; Kaiser et al., Reference Kaiser, McBurnett and Pfiffner2010; Nelson, Hart, Yang, Olsen, & Jin, Reference Nelson, Hart, Yang, Olsen and Jin2006). Supporting these findings, experimental treatment research has shown that improving parental discipline strategies resulted in reduced externalizing problems in children (Bagner, Sheinkopf, Vohr, & Lester, Reference Bagner, Sheinkopf, Vohr and Lester2010; Dishion & Kavanagh, Reference Dishion and Kavanagh2000; Gardner, Sonuga-Barke, & Sayal, Reference Gardner, Sonuga-Barke and Sayal1999; Kilgore, Snyder, & Lentz, Reference Kilgore, Snyder and Lentz2000).
Bidirectional Effects in the Association Between Parenting and Behavior Problems
However, it has been shown that children's behavior can also elicit certain reactions in others (Pettit & Arsiwalla, Reference Pettit and Arsiwalla2008). Two directions of effects in the association between parenting and behavior problems have been identified, effects coming from the parents, called parent-driven effects, and effects elicited by the children, called child-driven effects (Pettit & Arsiwalla, Reference Pettit and Arsiwalla2008). Evidence for a bidirectional parent–child relationship is consistent with the reciprocal effects models (Bell, Reference Bell1968) where parents' behaviors influence children's development but children's behaviors also influence parents' behaviors in a series of cycles over time.
In the case of behavior problems, difficult children may influence their parents negatively, resulting in parents being less involved and providing less positive or developmentally appropriate environments for their children (Shaw, Gilliom, Ingoldsby, & Nagin, Reference Shaw, Gilliom, Ingoldsby and Nagin2003). Such patterns of parent–child relationship can lead to a downward cycle of interpersonal dysfunction, called coercive relationships (Collins & Laursen, Reference Collins and Laursen1999; Patterson, Reference Patterson1982).
The Cross-Lagged Model in Longitudinal Genetically Sensitive Studies
These findings have encouraged researchers to develop models that simultaneously account for both types of effects. In this sense, cross-lagged models are typically used because they are designed to examine the longitudinal association between two different measures independent of stability and the concurrent associations between the measures. When the cross-lagged model is applied in a genetically informative sample, it is possible to estimate the genetic and environmental influences on the associations between the measures. For example, Neiderhiser, Reiss, Hetherington, and Plomin (Reference Neiderhiser, Reiss, Hetherington and Plomin1999) analyzed the association between parental conflict–negativity and adolescent antisocial behavior and depressive symptoms using a genetically sensitive cross-lagged model in a sample consisting of biologically related individuals, assessed at two ages, 3 years apart. They concluded that the association between the two phenotypes was explained primarily by genetic factors.
The work of Neiderhiser and colleagues (1999) inspired other researchers to extend and refine their pioneering model. Recently, Neiderhiser's model was refined by Luo, Haworth, and Plomin (Reference Luo, Haworth and Plomin2010) by adding a Cholesky decomposition that ultimately allows the decomposition of the cross-lagged paths per se into their genetic and environmental components also controlling for the stability and reverse cross-lagged association. However, the two cross-lagged associations tested in Luo et al. (Reference Luo, Haworth and Plomin2010) were presented in two separate models that do not allow the test of bidirectionality.
In this sense, the model developed by Burt et al. (Reference Burt, McGue, Krueger and Iacono2005) is advantageous because the cross-lagged model is nested in a genetic model. By nesting the phenotypic relationships between the variables analyzed over time, it is possible to test the difference between bidirectional relationships. Burt et al. (Reference Burt, McGue, Krueger and Iacono2005) analyzed the associations between parent–child conflict and child externalizing problems from ages 11 to 14. They found evidence for a bidirectional relationship. Furthermore, although the Burt et al. (Reference Burt, McGue, Krueger and Iacono2005) model does not allow the decomposition of the cross-lagged paths per se, it is possible to decompose into genetic and environmental factors the transmitted variance from the analyzed phenotypes over time, which ultimately enables us to explore whether the longitudinal association is genetically or environmentally mediated. In this particular study, the association between parent–child conflict and child externalizing problems from 11 to 14 years of age was mostly driven by environmental factors, although genetic factors were also implicated (Burt et al., Reference Burt, McGue, Krueger and Iacono2005).
The cross-lagged model developed by Burt et al. (Reference Burt, McGue, Krueger and Iacono2005) has been applied in two other studies. Larsson et al. (Reference Larsson, Viding, Rijsdijk and Plomin2008) examined the association between parental negativity and child antisocial behavior at ages 4 and 7. Similarly to Burt et al. (Reference Burt, McGue, Krueger and Iacono2005), the association was best explained by bidirectional processes, although in their case child effects were genetically mediated while environmental factors mediated parent-driven effects on child antisocial behavior (Larsson et al., Reference Larsson, Viding, Rijsdijk and Plomin2008). Recently, Moberg, Lichtenstein, Forsman, and Larsson (Reference Moberg, Lichtenstein, Forsman and Larsson2011) investigated the direction and etiology of the association among different parental styles, parental emotional overinvolvement and parental criticism, and internalizing behavior from ages 16–17 to 19–20. They found evidence for genetically influenced child-driven effects underlying this association but only in girls.
In summary, both parent-driven and child-driven effects have been found in the association between parenting components and child and adolescent behavior problems with mixed results regarding the genetic or environmental mediation of these processes and the specifity of the direction in the association across genders.
Our Study
To extend the literature on the etiology of reciprocal effects and the genetic and environmental architecture of the association between parental negativity and behavior problems, we analyzed data at ages 4 and 12 from a large population-based twin study, the Twins Early Development Study (TEDS; Trouton, Spinath, & Plomin, Reference Trouton, Spinath and Plomin2002) by means of a genetically sensitive cross-lagged model (Burt et al., Reference Burt, McGue, Krueger and Iacono2005). For the first time in a longitudinal genetically sensitive study we have explored the directional relationships between parental negativity and behavior problems from early childhood to adolescence. Previous genetically sensitive research examining similar relationships applying a cross-lagged model has focused on spans of 3 years within the same developmental period (Burt et al., Reference Burt, McGue, Krueger and Iacono2005; Larsson et al., Reference Larsson, Viding, Rijsdijk and Plomin2008; Moberg et al., Reference Moberg, Lichtenstein, Forsman and Larsson2011; Neiderhiser et al., Reference Neiderhiser, Reiss, Hetherington and Plomin1999). Furthermore, phenotypic studies examining risk factors or developmental trajectory and stability of behavior problems over different developmental stages are relatively scarce and mostly focused on continuity of behavior problems over time (Fanti & Henrich, Reference Fanti and Henrich2010; Trentacosta & Shaw, Reference Trentacosta and Shaw2009; Van Hulle et al., Reference Van Hulle, Waldman, D'Onofrio, Rodgers, Rathouz and Lahey2009). Therefore, it remains poorly understood whether associations between parental measures and behavior problems extend across developmental stages such as early childhood and adolescence. The present study will investigate genetic and environmental etiologies of the links between parental negativity and behavior problems across 8 years, from childhood to adolescence. The cross-lagged approach will also yield information about the etiology of stability of behavior problems from childhood to adolescence, controlling for the association and stability with parental negativity.
In addition, sex differences in the genetic and environmental architecture of the phenotypes and their association were assessed capitalizing on TEDS' inclusion of opposite-sex twins. Although research has often explored the relationship between different parental components and behavior problems, less attention has been given to whether these familial factors impact girls and boys differently (Blatt-Eisengart, Drabick, Monahan, & Steinberg, Reference Blatt-Eisengart, Drabick, Monahan and Steinberg2009). Some studies have suggested that the greater prevalence of behavior problems among boys than among girls (Hill, Reference Hill2002) is due to higher rates of exposure to risk factors such as parental negativity among boys or boys' greater sensitivity to them (Rutter, Caspi, & Moffitt, Reference Rutter, Caspi and Moffitt2003). Furthermore, it has been pointed out that direction of effects can depend on child gender (Moberg et al., Reference Moberg, Lichtenstein, Forsman and Larsson2011). Our longitudinal study extends into adolescence, when secondary sexual characteristics emerge (Spear, Reference Spear, Cicchetti and Walker2003). Therefore, we address the possibility of sex differences in the etiological relationship between parental negativity and behavior problems from childhood to adolescence.
Finally, apart from parenting characteristics, general cognitive ability is a fundamental developmental resource in successful adaptative behavior (Masten, Reference Masten2001). For example, children with cognitive difficulties are at greater risk of developing behavior problems (Deutch & Bubser, Reference Deutch and Bubser2007; Hill, Reference Hill2002; Tong et al., Reference Tong, Shinohara, Sugisawa, Tanaka, Watanabe and Onda2010). Because the current study was focused on the relationship between parental negativity and behavior problems, we considered the potential role of cognitive difficulties.
Research questions
The present study addresses five research questions:
1. How much of the variance of parental negativity and behavior problems is due to genetic and environmental factors at age 4 and age 12?
2. How do genetic and environmental factors influence the concurrent overlap at each age between parental negativity and behavior problems?
3. How do parental negativity and behavior problems at age 4 contribute to parental negativity and behavior problems at age 12 (parent-driven effects, child-driven effects, and stability of the phenotypes)?
4. How do genetic and environmental factors in parental negativity and behavior problems at age 4 contribute to parental negativity and behavior problems variables at age 12?
5. Are there sex differences in the genetic and environmental architecture of the longitudinal associations between parental negativity and behavior problems from early childhood to adolescence?
6. Does general cognitive ability effect this association?
Hypotheses
Based on the literature, we hypothesized that we would identify both parent-driven and child-driven effects in the association between parental negativity and behavior problems indicating a bidirectional relationship over time. In addition, we predict that genetic factors will mediate the effects of behavior problems at age 4 on parental negativity at age 12, whereas we expect that the effects of parental negativity at age 4 on behavior problems at age 12 will be more environmentally mediated (Larsson et al., Reference Larsson, Viding, Rijsdijk and Plomin2008).
Method
Participants
Participants were drawn from TEDS, a large longitudinal population-based study of all twins born in England and Wales between 1994 and 1996 (Oliver & Plomin, Reference Oliver and Plomin2007; Trouton et al., Reference Trouton, Spinath and Plomin2002). Parents completed behavioral rating scales for both twins at ages 4 and 12. Zygosity was determined using a standard zygosity questionnaire, which has been shown to have 95% accuracy (Price et al., Reference Price, Freeman, Craig, Petrill, Ebersole and Plomin2000). Furthermore, zygosity has been confirmed for most same-sex pairs using DNA markers (Freeman et al., Reference Freeman, Smith, Curtis, Huckett, Mill and Craig2003). TEDS has been shown to be reasonably representative of the UK population (Kovas, Haworth, Dale, & Plomin, Reference Kovas, Haworth, Dale and Plomin2007).
The sampling frame for the present study was 7,660 twins, born in 1994, 1995, or 1996, using data available from parents' ratings of parental negativity and behavior problems at age 4 and 12.
A total of 584 twin pairs were excluded from the analyses because of medical or neurological conditions, outlier scores, or unknown (unreliable) zygosity. Thus, the total number of twin pairs included in the analyses was 4,075 twin pairs: 659 monozygotic (MZ) male twin pairs, 835 MZ female twin pairs, 622 dizygotic (DZ) male twin pairs, 715 DZ female twin pairs, and 1,244 DZ opposite-sex twins. Mx uses a full-information maximum likelihood method to handle missing data, which allows the use of missing data with minimum bias.
Measures
Behavior problems were assessed by means of parent reports of the Strengths and Difficulties Questionnaire (SDQ; Goodman, Reference Goodman1997) when children were 4 and 12 years old. The SDQ is a brief behavioral screening of 25 items for individuals aged between 3 and 16 years old. Raters are asked to indicate on a 3-point response scale (ranging from not true to certainly true) how well each item described the child's behavior over the past 6 months. The questionnaire consists of five subscales (emotional problems, peer problems, conduct problems, hyperactivity, and prosocial behavior). Example items are “Restless, overactive, cannot stay still for long” and “Often lies or cheats.” We found that the first four subscales were highly and significantly correlated at both age 4 (average correlation = 0.57) and age 12 (average correlation = 0.66). Due to the high overlap between these behavioral problem measures, both in our sample and in other studies (Angold, Costello, & Erkanli, Reference Angold, Costello and Erkanli1999; Timmermans, van Lier, & Koot, Reference Timmermans, van Lier and Koot2010), we combined the first four subscales to yield a total behavior problems score.
Parental negativity was assessed when children were 4 and 12 years of age, using the Parental Feelings Questionnaire (Deater-Deckard, Reference Deater-Deckard1996). This questionnaire consists of 4 items rated on a 5-point scale (ranging from definitely untrue to definitely true) where parents report their negative feelings about their children. The items representing negative feelings were used to create a total score of parental negativity. At age 4, for the firstborn twins the statements were: “Sometimes I feel very impatient with him/her,” “Sometimes I wish he/she would go away for a few minutes,” “Sometimes he/she makes me angry,” and “Sometimes I am frustrated by him/her.” For the second-born twins parents were asked “Do you feel this way more or less with your second-born twin?” and these questions were rated on a 5-point scale ranging from a lot more to a lot less. This differential scoring method was aimed to accentuate within-family differences. The score of the firstborn twins was obtained by summing up the items and then standardizing across the whole population to zero mean and unit variance. For the second-born twins, the standardized scores of the firstborn twins were added to the standardized sum of the differential scores of the second-born twins, and then this composite was standardized (Knafo & Plomin, Reference Knafo and Plomin2006). At age 12, assessment of parental negativity included the same 4 items, but parents were asked to report on their feelings about each twin separately without comparing them. The scores of each of the 4 items were summed to obtain a total score of parental negativity, which was also standardized.
As mentioned above, the potential role of general cognitive ability as a covariate was investigated. General cognitive ability (g) was assessed at each age through administration of nonverbal and verbal cognitive test batteries. At age 4, g was calculated as the standardized sum of the verbal and nonverbal scores. Nonverbal cognitive performance was assessed by means of the Parent Report of Children's Abilities (Saudino, Oliver, Petrill, Richardson, & Rutter, Reference Saudino, Oliver, Petrill, Richardson and Rutter1998). At age 12, twins were administered (online) two verbal tests, the Wechsler Intelligence Scale for Children (third edition) Multiple Choice Information and Vocabulary Multiple Choice subtests (Wechsler, Reference Wechsler1992), and two nonverbal reasoning tests, the Wechsler Intelligence Scale for Children (Third Edition) Picture Completion (Wechsler, Reference Wechsler1992) and Raven's Standard and Advanced Progressive Matrices (Raven & Raven, Reference Raven and Raven1996, Reference Raven and Raven1998). More details on the cognitive assessments are reported elsewhere (Davis, Haworth, & Plomin, Reference Davis, Haworth and Plomin2009; Haworth et al., Reference Haworth, Harlaar, Kovas, Davis, Oliver and Hayiou-Thomas2007).
Statistical Analyses
Structural equation modeling of twin data is based on the differential genetic relationship between pairs of twins: MZ twin pairs are 100% similar genetically, and DZ twins are 50% similar genetically for additive genetic effects on average. When these twins are raised in the same family, the twin method assumes that there are no differences in their environmental relatedness, that is, both types share 100% of shared environmental effects and 0% of nonshared environmental effects. The difference in MZ and DZ correlations (resemblance in measured traits) can be used to estimate the relative contribution of additive genetic effects (A), shared environmental effects (C), and nonshared environmental effects (E) to the total phenotypic variance of a given trait. A represents the sum of the effect of the individual alleles at all loci that influence a trait. C includes environmental influences that contribute to similarity within twin pairs, and E represent environmental influences that are unique to each individual, plus measurement error (Plomin, DeFries, Knopik, & Neiderhiser, Reference Plomin, DeFries, Knopik and Neiderhiser2013; Rijsdijk & Sham, Reference Rijsdijk and Sham2002).
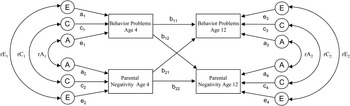
The current study examines the association between parental negativity and behavior problems from ages 4 to 12 fitting a cross-lagged model (Burt et al., Reference Burt, McGue, Krueger and Iacono2005; see Figure 1). This model constrains all the associations between and within the two phenotypes across ages to take the form of phenotypic partial regression coefficients. The paths connecting the same phenotype from age 4 to age 12 represent the cross-age stability paths (Figure 1, b 11 and b 22). These paths estimate the 8-year stability for parental negativity and behavior problems when controlling for the preexisting association between the two phenotypes at age 4. The paths connecting one phenotype with the other from age 4 to age 12 are the cross-lagged paths of the model (Figure 1, b 12 and b 21). The cross-lagged paths estimate the independent contribution of parental negativity at age 4 on behavior problems at age 12 (parent-driven effects) and, similarly, the independent contribution of behavior problems at age 4 on parental negativity at age 12 (child-driven effects), controlling for the stability of the two phenotypes.
A path diagram of the cross-lagged model. Circles represent latent variables, additive genetic factors (A), shared environmental factors (C), and nonshared environmental factors (E). Rectangles represent the measured variables (i.e., parental negativity and behavior problems at ages 4 and 12). Standardized paths estimates for these variables (i.e., a 1, c 1, e 1, a 2, c 2, e 2, a 3, c 3, e 3, a 4, c 4, e 4), genetic and environmental correlations (i.e., rA1, rC1, rE1, rA2, rC2, rE2), cross-age stability paths (i.e., b 11, b 22), and cross-lagged paths (i.e., b 12, b 21) are also presented in the diagram.

At each age, the variance of each phenotype and their covariation is decomposed into A, C, and E. Moreover, at age 12, the genetic and environmental influences on the phenotypes can be broken down into age-specific and transmitted variance from age 4 phenotypes and their covariation. This also enables an estimate of how much of the variance of age 12 phenotypes is transmitted through the cross-age stability and cross-lagged paths and whether this transmitted variance is mainly loading into genetic or environmental factors of age 12 phenotypes. Therefore, it is possible to examine how genetic and environmental influences on age 4 phenotypes contribute to genetic and environmental influences on age 12 phenotypes. These analyses constitute one of the most salient features of the cross-lagged model because it allows us to elucidate whether the longitudinal association is of genetic or environmental origin.
Since the sample includes male and female MZ and DZ pairs and opposite-sex pairs, it is possible to test whether there are sex differences in the genetic and environmental architecture of the phenotypes or in their longitudinal association by fitting different sex-limitations models. The current study fitted four sex-limitations models to test for quantitative sex differences (differences in the relative contribution of genetic and environmental factors to the phenotypes), phenotypic variance differences between sexes, and causal pathway differences between sexes. Quantitative sex differences were examined by allowing the parameter estimates (i.e., A, C, and E) to differ across genders (Model 1). A constrained model, where all variance components were set to be equal across genders, was also fitted (Model 2). Next, we fitted a scalar model to examine phenotypic variance sex differences. This model allows sex differences in phenotypic variances but constrains A, C, and E parameters to be equal across genders (Model 3). Finally, we fitted a scalar model constraining A, C, and E parameters to be equal across genders but allowing sex differences in the phenotypic variance and causal pathways (Model 3).
All analyses (estimating correlations and genetic model-fitting parameters) were performed by means of the structural equation modeling program Mx (Neale & Maes, Reference Neale and Maes2003). Models were fitted on scores adjusted for age, sex, and g. These models were compared to models fitted on scores only adjusted by sex and age to test whether g was modifying the associations in the cross-lagged model.
Goodness of fit of the models was assessed by likelihood-ratio chi-square tests, which is the difference between –2 log likelihood (–2 LL) of the saturated model and that of the restricted model, with the degrees of freedom (df) of this test being the difference between the number of estimated parameters of the two models (a significant p value indicating a bad fit). Competing (nested) models can be compared in a similar way. In addition, the Akaike information criterion (AIC = χ2 – 2 × df) was used to compare the fit of (nonnested) competing models (with lower AIC values indicating better fit).
Results
Descriptive statistics
Because the pattern of the results and the estimates were almost exactly the same either adjusting by g or not, the results presented are based on scores adjusted by sex and age (results adjusted by sex, age, and g are available on request from first author).
Means, standard deviations, and number of respondents for age- and sex-adjusted scores of parental negativity and behavior problems at ages 4 and 12 are presented in Table 1. The means and standard deviations are nearly identical for males and females. The means of parental negativity slightly increase at age 12.
Means, standard deviations, and sample sizes of measures of parental negativity and behavior problems at age 4 and 12 adjusted by sex, age, and general cognitive ability

Note: Twin intraclass correlations (95% confidence intervals) for parental negativity and behavior problems at age 4 and 12. MZ, monozygotic; M, male twin pairs, DZ, dizygotic; F, female twin pairs; O, opposite twin pairs.
Phenotypic correlations
The age-specific phenotypic correlation between behavior problems and parental negativity increased substantially from age 4, males: r = .29, 95% confidence interval (CI) (0.26–0.33); females: r = .29, 95% CI (0.26–0.30), to age 12, males: r = .50, 95% CI (0.47–0.53); females: r = .49, 95% CI (0.46–0.51). There was stability over time for both behavior problems, males: r = .47, 95% CI (0.46–0.48); females: r = .45, 95% CI (0.43–0.48), and parental negativity, males: r = .37, 95% CI (0.33–0.38); females: r = .34, 95% CI (0.33–0.36). The across-trait and time correlations were small but significant for both behavior problems at age 4 and parental negativity at age 12, males: r = .28, 95% CI (0.21–0.31); females: r = .27, 95% CI (0.24–0.30), and parental negativity at age 4 and behavior problems at age 12, males: r = .21, 95% CI (0.18–0.24); females: r = .17, 95% CI (0.14–0.20). The pattern of phenotypic correlations between the measures was similar for both sexes.
Twin correlations
The twin correlations for behavior problems and parental negativity at age 4 and at age 12 are also presented in Table 1 by zygosity and sex. For behavior problems at age 4, the MZ twin correlation is twice as high as the DZ correlation, suggesting genetic influence on the trait. For parental negativity, both MZ and DZ twin correlations are quite high, indicating genetic and common environmental influences. At age 12, both MZ and DZ correlations increase for both parental negativity and behavior problems. All correlations were statistically significant. Twin correlations were generally similar for males and females and for same-sex and opposite-sex twins.
Model-fitting analyses
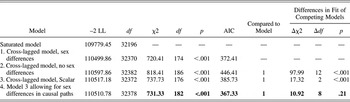
Four sex-limitation models were fitted (see Table 2). The best fitting model constrained genetic and environmental influences to be the same across males and females (as suggested by the twin correlations in Table 1) but allowed for sex differences in variances and causal pathways (Model 4, Table 2). Model 4 showed the lowest AIC value and a nonsignificant decline in fit compared to Model 1 (p = .21).
Research Question 1: How much of the variance of parental negativity and behavior problems is due to genetic and environmental factors at each age?
Model fitting results for parental negative feelings and antisocial behavior at age 4 and 12

Note: The chi-square, degrees of freedom, and p values (columns 4–6) are the difference in the –2 log likelihood statistics (–2 LL) of each model and the saturated model. The best fitting model is indicated in bold. AIC, Akaike information criterion.
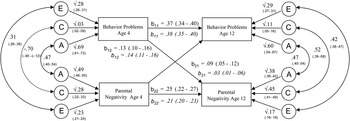
The proportion of variance of behavior problems and parental negativity at ages 4 and 12 explained by additive genetic factors (a 2), common environment (c 2), and unique environment (e 2) is presented in Figure 2.
A path diagram representing the association between behavior problems and parental negativity from age 4 to age 12 and the standardized path estimates of the additive genetic (A), shared environmental (C), and nonshared environmental effects (E). The squared A, C, and E path estimates at age 12 represent the total (transmitted + time specific) variance. Solid lines indicate significant pathways. Standardized estimates for cross-age stability paths (i.e., b 11, b 22) and cross-lagged paths (i.e., b 12, b 21) are presented in the center of the diagram for males and females (italics).

Behavior problems at age 4 are highly heritable (69%) and almost no variance is explained by common environment (c 2 = .03). At age 12, common environmental influences become more important (11%) and the genetic influences decreased slightly (60%). The proportion of variance explained by unique environmental influences was similar at age 4 (e 2 = 28%) and age 12 (e 2 = 29%).
For parental negativity, around half of the variance was explained by genetic factors (49%) at age 4 but by common environment at age 12 (45%). Nevertheless, genetic factors were also important at age 12, accounting for 38% of the variance of parental negativity. The influence of unique environmental influences was similar at both ages (23% and 17%, respectively).
Research Question 2: How do genetic and environmental factors influence the concurrent overlap between parental negativity and behavior problems at each age?
The genetic and environmental overlap between behavior problems and parental negativity at each age can be found in the outer sides of Figure 2.
The predicted correlation between behavior problems and parental negativity at age 4 is obtained by summing the paths that join the two phenotypes: (√.69 × .47 × √.49 = .23) + (√.03 × –.70 × √.28 = –.06) + (√.28 × .31 × √.23 = .08) = .25. Thus, the phenotypic correlation of .25 between the two phenotypes at age 4 was mainly due to genetic factors (.23/.25 = 92%), whereas environmental influences (C and E) are largely specific to each trait and do not contribute to the similarity between the traits.
At age 12, following the same calculation, the correlation between the two phenotypes was .42. Similar to age 4, concurrent associations at age 12 between parental negativity and behavior problems were mainly due to genes (52%), but there was an increase in the common environmental factors shared by the two phenotypes, with shared environments explaining 26% of the phenotypic correlation.
Research Question 3: How do parental negativity and behavior problems at age 4 influence parental negativity and behavior problems at age 12 (cross-lagged and cross-age stability pathways)?
Cross-lagged partial regression coefficients located in the center of Figure 2 indicate the association between the two variables connected by each path controlling for the preexisting relationship between behavior problems and parental negativity at age 4. The best fitting model allowed causal pathways to differ across genders; therefore, estimates for cross-lagged and cross-age stability pathways are different for males and females.
Behavior problems at age 4 significantly predict parental negativity at age 12, males: r = .13; 95% CI (0.10–0.16); females: r = .14; 95% CI (0.11–0.16). The converse association was also significant, males: r = .09; 95% CI (0.05–0.12); females: r = .03; 95% CI (0.01–0.06). The influence of each pathway on variances at age 12 can be obtained by squaring the partial regression coefficients. Thus, parent-driven effects (parental negativity at age 4 → behavior problems at age 12) explained 0.8% of parental negativity at age 12 in males (calculated by .092) and 0.1% in females (.032). Child-driven effects (behavior problems at age 4 → parental negativity at age 12) explained 1.7% and 2% of behavior problems at age 12 for males and females, respectively.
Regarding the stability of the phenotypes, both phenotypes measured at age 12 were significantly influenced by the same phenotype at age 4 independent of the other phenotype. The cross-age stability path from behavior problems at age 4 independently explained 13.7% and 14.4% of the variance of behavior problems at age 12 in males and females, respectively, males: r = .37; 95% CI (0.34–0.40); females: r = .38; 95% CI (0.35–0.40). Parental negativity at age 4 independently explained 6.3%, r = .25; 95% CI (0.22–0.27), of the variance of parental negativity at age 12 in males and 4.4%, r = .21; 95% CI (0.20–0.23), in females.
Research Question 4: How do genetic and environmental influences on parental negativity and behavior problems at age 4 contribute to parental negativity and behavior problems at age 12?
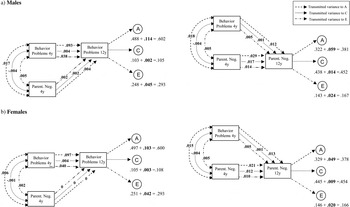
From the cross-lagged model, it is possible to break down the genetic, shared, and nonshared environmental influences on phenotypes at 12 years into age-specific variances and transmitted variance from each of the phenotypes at 4 years and from their covariance at 4 years. The breakdown of age-specific and transmitted genetic, shared environmental, and nonshared environmental influences on behavior problems at age 12 is graphically presented in Figure 3. The purpose of Figure 3 is to focus on parental negativity and behavior problems at age 12, showing the amount of age-specific and transmitted variance in each A, C, and E estimate. The sum of these two components constitutes the total A, C, and E estimates that are shown in Figure 2.
Diagrams presenting the breakdown of the total genetic (A), common (C), and unique environmental (E) influences of behavior problems and parental negativity at age 12 in (a) males and (b) females. These values do not represent path estimates, but instead represent the different proportions of transmitted A (dashed line), C, and E variance. Total A, C, and E variances are decomposed into time-specific and transmitted (in bold) variances. For example, total genetic influences of behavior problems at age 12 in males equals .602. This value is the sum of the time-specific (.488) and transmitted variance (.114). Following the dashed line, genetic transmitted variance to behavior problems at age 12 can be tracked, specifically .114 equals the sum of the genetic transmitted variance from the same phenotype at age 4 (.093), parental negativity at age 4 (.004), and their covariance (.017)(.093 + .004 + .017 = .114). Common and unique environmental transmitted variance can also be tracked following the dotted line and the dotted and dashed line, respectively.

Specifically, in Figure 3a (males), age-specific genetic, shared, and nonshared environmental factors account for 84% of the variance of behavior problems at age 12, (a 2 = .49) + (c 2 = .10) + (e 2 = .25) = .84. Thus, 16% of the variance is transmitted from genetic (.114), shared (.002), and nonshared environmental factors (.045), influencing behavior problems, parental negativity, and their covariation at age 4 (.114 + .002 + .045 = .161). Most of the transmitted variance of behavior problems at age 12 is genetic (.114/.16 = 70.8%), and it is mainly due to cross-age stability effects (.093/.114 = 81.6%). For females (Figure 3b), transmitted variance to behavior problems at age 12 represents 15% of the total variance of the phenotype (.103 + .003 + .042 = .148). Most of the transmitted variance is genetic in origin (.103/.148 = 69.6%), and it mainly comes from the same phenotype at age 4 (.097). The amount of transmitted variance through the cross-lagged path representing parent-driven effects was negligible for females (<.0005).
Regarding parental negativity at age 12, age-specific variance represents 90% of the total variance, (a 2 = .32) + (c 2 = .44) + (e 2 = .14) = .90, for males. Transmitted variance (10%) again mainly loads on genetic factors (.06/.10 = 60%), which primarily comes from the same phenotype at age 4 (.029). For females, transmitted variance represents 8% (.049 + .009 + .020 = .078) of the total variance of parental negativity at age 12. Again, genetic factors account for most of the transmitted variance (.049/.078 = 62.8%), which largely comes from the same phenotype at age 4 (.021).
Research Question 5: Are there sex differences in the genetic and environmental architecture of the longitudinal associations between parental negativity and behavior problems from early childhood to adolescence?
The best fitting model (Model 4 in Table 2) constrained all genetic and environmental contributions to be constant across genders but allowed phenotypic variances and causal pathways (cross-lagged and cross-age stability pathways) to differ for males and females. The estimates of the causal pathways were significant and similar in both males and females. However, the cross-lagged path representing parent-driven effects from parental negativity at age 4 to age 12 behavior problems was significantly greater for males (0.09) than for females (0.03; Δχ2 = 7.17; Δdf = 1; p = .007), although the confidence intervals of the estimates overlap. In addition, the cross-age stability path for parental negativity was significantly greater for males (0.25) than for females (0.21; Δχ2 = 5.04; Δdf = 1; p = .025), although the confidence intervals for the estimates also overlap.
Discussion
This first longitudinal genetically sensitive study investigating the cross-lagged association between parental negativity and behavior problems aimed to assess the causal direction and genetic and environmental etiology of these associations from early childhood to adolescence. The findings indicate bidirectional cross-lagged associations; that is, both parent-driven and child-driven effects independently account for the associations between parental negativity and behavior problems across these ages. Furthermore, child-driven effects were mainly genetically mediated and parent-driven effects were a function of both genetic and shared-environmental factors. There were small sex differences in the genetic and environmental architecture of the longitudinal association between parental negativity and behavior problems, which are discussed below. Overall, the stability of the parental negativity and behavior problems and the association between them from early childhood to adolescence seems to be mainly of genetic origin.
Here we discuss the findings in relation to the five research questions outlined in the introductory section.
Research Question 1: How much of the variance of parental negativity and behavior problems is due to genetic and environmental factors at age 4 and age 12?
As reported by previous studies, the heritability found for behavior problems ranged from 40% and 70% and did not differ across genders (Hill, Reference Hill2002; Simonoff, Reference Simonoff and Hill2001). Looking more carefully into the genetic and environmental etiology of behavior problems, there is a change in the role of shared environmental influences, which account for negligible variance of behavior problems at age 4 but account for 14%–15% of the variance at age 12. This increase in common environmental influences in behavior problems at age 12 can be partially explained by the increase in conflicts with parents, which has been pointed out during adolescence, especially around puberty (Steinberg & Morris, Reference Steinberg and Morris2001).
Although parental negativity is typically considered as an environmental measure (or risk), we found that almost half of its variance was explained by genetic factors. This result is consistent with previous heritabilities reported for similar parental measures (Deater-Deckard, Fulker, & Plomin, Reference Deater-Deckard, Fulker and Plomin1999; Neiderhiser et al., Reference Neiderhiser, Reiss, Pedersen, Lichtenstein, Spotts and Hansson2004; Pike & Plomin, Reference Pike and Plomin1996; Vinkhuyzen, van der Sluis, de Geus, Boomsma, & Posthuma, Reference Vinkhuyzen, van der Sluis, de Geus, Boomsma and Posthuma2010). Environmental measures are influenced by genes because they involve, at least in part, reactions to heritable characteristics (Reiss, Reference Reiss1995). In this context, our results may be reflecting gene–environment correlation effects in which a child's behavior problems may evoke or seek parental negativity. Child-driven effects, which support this explanation, are discussed below.
Research Question 2: How do genetic and environmental factors influence the concurrent overlap at each age between parental negativity and behavior problems?
At each age, overlap between parental negativity and behavior problems were mainly accounted by genetic factors, indicating that the same genes that make parents feel negatively about their children also influence behavior problems. These results are similar to one study (Larsson et al., Reference Larsson, Viding, Rijsdijk and Plomin2008). However, in two other studies, genetic covariation also contributed to covariation between parental measures and behavior problems, but most of the association was mainly accounted by environmental factors (Burt et al., Reference Burt, McGue, Krueger and Iacono2005; Moberg et al., Reference Moberg, Lichtenstein, Forsman and Larsson2011). One hypothesis about these different results could be a developmental shift in the covariation between negative parenting and behavior problems because these latter two studies were based on adolescent samples.
Research Question 3: How do parental negativity and behavior problems at age 4 influence parental negativity and behavior problems at age 12 (cross-lagged and cross-age stability pathways)?
Both phenotypes were moderately stable from ages 4 to 12, and the stability estimates were similar to those reported in previous studies examining similar associations 3 years apart, even though in our study the association was studied 8 years apart (Burt et al., Reference Burt, McGue, Krueger and Iacono2005; Larsson et al., Reference Larsson, Viding, Rijsdijk and Plomin2008; Moberg et al., Reference Moberg, Lichtenstein, Forsman and Larsson2011).
The key cross-lag analyses indicate that both child-driven and parent-driven effects independently contribute to the association between parental negativity and behavior problems from ages 4 to 12. Regarding the longitudinal effect size of these effects, behavior problems at age 4 accounted for 1.7% and 2% of parental negativity at age 12 in males and females, respectively (child-driven effects). Parental negativity at age 4 only accounted for 0.8% and 0.1% of behavior problems at age 12 in males and females, respectively (parent-driven effects). Although these effect sizes are small, phenotypes that account for around 2% of the variance during a 3-year interval are not unusual because the paths are independent of the association between parental negativity and behavior problems at age 4 as well as independent of the stability of both measures across age (Burt et al., Reference Burt, McGue, Krueger and Iacono2005; Larsson et al., Reference Larsson, Viding, Rijsdijk and Plomin2008; Moberg et al., Reference Moberg, Lichtenstein, Forsman and Larsson2011). Moreover, in our case, these effects emerged across an 8-year age span. The effect size of parent-driven effects, although significant, is smaller than child-driven effects. The recent study by Moberg et al. (Reference Moberg, Lichtenstein, Forsman and Larsson2011) reported evidence for child-driven effects but not for parent-driven effects. Despite these differences in effect size between child-driven effects and parent-driven effects, our study provides support for a bidirectional relationship between parental negativity and behavior problems from early childhood to adolescence. These results are consistent with previous studies (Burt et al., Reference Burt, McGue, Krueger and Iacono2005; Larsson et al., Reference Larsson, Viding, Rijsdijk and Plomin2008). This bidirectional relationship has been described as a downward spiral where parenting both impacts and is impacted by child behavior (Burt et al., Reference Burt, McGue, Krueger and Iacono2005). This downward spiral relates to the concept of a coercive parent–child relationship (Collins & Laursen, Reference Collins and Laursen1999) where difficulties in children behavior coupled with stressed-out parents who finally relent and fail to provide support and adequate negative consequences for bad behaviors. Ultimately, parents end up reinforcing child behavior problems. This illustrates a pathway through which ineffective parental management and early difficult and demanding child characteristics foster the development or consolidation of behavior problems later in life (Patterson, Reference Patterson1982; Pettit & Arsiwalla, Reference Pettit and Arsiwalla2008).
Research Question 4: How do genetic and environmental influences on parental negativity and behavior problems at age 4 contribute to parental negativity and behavior problems at age 12?
In line with previous research, stability of behavior problems was mainly attributable to genetic factors, specifically; around 68% of the transmitted variance through this cross-age stability path was due to genetic factors (Figure 3; Eley, Lichtenstein, & Moffitt, Reference Eley, Lichtenstein and Moffitt2003; Haberstick, Schmitz, Young, & Hewitt, Reference Haberstick, Schmitz, Young and Hewitt2005; Larsson et al., Reference Larsson, Viding, Rijsdijk and Plomin2008; Neiderhiser et al., Reference Neiderhiser, Reiss, Hetherington and Plomin1999).
In regard to the etiological nature of the bidirectional effects, the parent-driven path was a function of both genetic and environmental factors. In contrast, the child-driven path was largely a function of genetic factors. Therefore, as we expected based on previous research (Burt et al., Reference Burt, McGue, Krueger and Iacono2005; Larsson et al., Reference Larsson, Viding, Rijsdijk and Plomin2008), child-driven effects were mainly genetically mediated and parent-driven effects were a function of both genetic and shared-environmental factors. Furthermore, the relevant role played by genetic factors in the association between parental negativity and behavior problems is consistent with some previous studies examining similar phenotypes (Leve et al., Reference Leve, Harold, Ge, Neiderhiser, Shaw and Scaramella2009; Neiderhiser et al., Reference Neiderhiser, Reiss, Hetherington and Plomin1999; Pike & Plomin, Reference Pike and Plomin1996).
Research Question 5: Are there sex differences in the genetic and environmental architecture of the longitudinal associations between parental negativity and behavior problems from early childhood to adolescence?
Similar to previous studies (Burt et al., Reference Burt, McGue, Krueger and Iacono2005; Larsson et al., Reference Larsson, Viding, Rijsdijk and Plomin2008), we found generally similar results for males and females. However, a hint of sex differences was found in the association between parental negativity and behavior problems over time and the genetic and environmental contributions to this association. Looking into these sex differences more carefully, they arise from the cross-lagged path representing parent-driven effects, which are significantly different in males and females. Since the rest of the estimates were nearly identical across genders, the clinical relevance of the sex differences found in the current study should be interpreted with caution and needs further research.
Research Question 6: Does general cognitive ability affect these results?
These results did not differ as a function of general cognitive ability. Thus, although general cognitive ability is related to behavior problems, it does not modify the association between parental negativity and behavior problems over time. Difficulties in the cognitive domain may be independent from behavior difficulties at least in relation to parental negativity over time.
General Discussion
In order to interpret these findings, especially regarding the role of genetic factors in the bidirectional association between parental negativity and behavior problems from early childhood to adolescence, from a developmental perspective, here we discuss the results in the light of the self-regulatory framework (Calkins & Keane, Reference Calkins and Keane2009). Although self-regulation was not measured per se, behavior problems, as defined in the current study, included different domains of adaptative functioning that are highly intercorrelated (Bornstein, Hahn, & Haynes, Reference Bornstein, Hahn and Haynes2010; Masten, Burt, & Coatsworth, Reference Masten, Burt, Coatsworth, Cicchetti and Cohen2006; Mesman, Bongers, & Koot, Reference Mesman, Bongers and Koot2001). Therefore, behavior problems may be reflecting difficulties in behavioral adjustment that may be underlined by deficits in self-regulatory processes. In this context, failures in the acquisition of basic processes such as emotion regulation and cognitive control early in life would ultimately lead to the expression of behavior problems. Applying a cross-lagged model design, we observed that behavior problems at age 4 predict behavior problems 8 years later. Moreover, also consistent with the self-regulation theory, the bidirectional relationship between parental negativity and behavior problems was significant even when the stability of the two phenotypes was also considered in the model. This supports the role of parenting in the early origins and maintenance of behavior problems from early childhood to adolescence. In the light of our findings, this cascade of effects may be underlined by genetic factors. Biological foundations related to the physiological and neurobiological mechanisms related to self-regulation process may well include genetic influences, therefore adding plausibility to our results (Calkins & Keane, Reference Calkins and Keane2009; Posner & Rothbart, Reference Posner and Rothbart2009).
Finally, since our findings indicate that the association between parenting and adolescent behavior problems seems to be mainly accounted by genetic factors, the current study may have potential implications for molecular genetic studies. A burning issue nowadays is the fact that despite high heritabilities, molecular genetic studies, including genome-wide association studies, have not been successful in identifying DNA variants responsible for this heritability (Manolio et al., Reference Manolio, Collins, Cox, Goldstein, Hindorff and Hunter2009), the missing heritability problem (Maher, Reference Maher2008). One of many possible directions for finding the missing heritability lies in the interplay between genes and environment. In the case of behavior problems, several exciting findings involve gene–environment correlation (Jaffee & Price, Reference Jaffee and Price2007; Neiderhiser et al., Reference Neiderhiser, Reiss, Pedersen, Lichtenstein, Spotts and Hansson2004; O'Connor, Deater-Deckard, Fulker, Rutter, & Plomin, Reference O'Connor, Deater-Deckard, Fulker, Rutter and Plomin1998).
Clinical implications
Although it is not novel to show that both parent-driven and child-driven effects independently contribute to the association between parental negativity and children's behavior problems, it is an important message for clinicians and parents. Regardless of their etiology, these bidirectional effects suggest a need to increase awareness of the developmental downward spiral between child problems and parental actions and reactions. A more novel finding concerns etiology: the child-driven effects were mainly genetically mediated and the parent-driven effects were mediated by both genetic and shared environmental factors. Although heritability does not imply immutability, these results suggest that parental reactions might provide a better target for prevention of the downward spiral.
From a developmental point of view, our findings show that the association between parental negativity and behavior problems in childhood can extend until adolescence. The cross-lagged analysis shows significant directional effects from parental negativity in childhood and adolescent behavior problems. Therefore, early interventions can potentially prevent the later consolidation of emotional and behavioral problems in the adolescence stage.
Limitations
The current results should be interpreted considering the following specific limitations, in addition to general limitations of the twin design (Plomin et al., Reference Plomin, DeFries, Knopik and Neiderhiser2008). First, one limitation is that parents reported both parental negativity and child behavior problems. Therefore, some of the overlap between parental negativity and behavior problems could be due to shared rater effects (Rutter, Pickles, Murray, & Eaves, Reference Rutter, Pickles, Murray and Eaves2001). Unfortunately, information regarding behavior problems at early childhood was only available from parents. Nevertheless, the pattern of our results is in general in agreement with previous research using different informants or combined informant approaches (Burt et al., Reference Burt, McGue, Krueger and Iacono2005; Moberg et al., Reference Moberg, Lichtenstein, Forsman and Larsson2011; Neiderhiser et al., Reference Neiderhiser, Reiss, Hetherington and Plomin1999). Furthermore, the validity and reliability of the parent-reported SDQ scores has been shown in several studies (Hawes & Dadds, Reference Hawes and Dadds2004; Muris, Meesters, & van den Berg, Reference Muris, Meesters and van den Berg2003; Rothenberger, Becker, Erhart, Wille, & Ravens-Sieberer, Reference Rothenberger, Becker, Erhart, Wille and Ravens-Sieberer2008). Second, the behavior problems composite used in the current study included emotional, hyperactivity, conduct, and peer problems in children. It is possible that each of these types of problems may have different etiological pathways. However, as mentioned before, these types of symptoms are highly comorbid (Angold et al., Reference Angold, Costello and Erkanli1999) and may share etiological risk factors (Timmermans et al., Reference Timmermans, van Lier and Koot2010). Third, sex differences were explored in relation to twins, but we made no distinction between fathers' and mothers' negativity, which can also affect the analyzed association. Several studies provide evidence for different effects of parenting on child behavior depending on the gender of the parent (Blatt-Eisengart et al., Reference Blatt-Eisengart, Drabick, Monahan and Steinberg2009; Lifford, Harold, & Thapar, Reference Lifford, Harold and Thapar2009; Vieno, Nation, Pastore, & Santinello, Reference Vieno, Nation, Pastore and Santinello2009). This information was not available for the current study, thus we cannot warrant that mother–son, mother–daughter, father–son, or father–daughter relationships differ between each other. Fourth, the parental measure represents the negative feelings that the parent reports experiencing toward the child rather than parenting practice per se. This can limit the comparability of our study to others using more behavior-based measures of parenting. Fifth, causal pathways were not decomposed per se into genetic and environmental contributions as is done in the model proposed by Luo et al. (Reference Luo, Haworth and Plomin2010). Thus, we track and decompose transmitted variance to understand how genetic and environmental factors shape the longitudinal association between parental negativity and behavior problems.
Despite the limitations, these findings contribute to the better understanding of the genetic and environmental contributions to childhood and adolescent behavior problems and, specifically, its relationship with parental negativity.
Conclusions
The current study provides evidence for the presence of both parent-driven and child-driven effects in the relationship between parental negativity and behavior problems even between two different developmental stages, early childhood and adolescence. Furthermore, this bidirectional association seems to be primarily of genetic origin. Future research may benefit from including a third time of assessment, to further explore the continuity of this association and possible shifts on the contribution and mediation of genetic and environmental factors to the phenotypes, its stability, and its relationship. Such studies would be of great interest especially when examining different developmental stages where relevant cognitive, psychological, neurobiological, and physiological changes involved in behavioral adjustment are taking place.