I. INTRODUCTION
Transition metal dichalcogenides (TMDs) are compounds with formula MX2, where M is a transition metal such as Mo and W and X is a chalcogen such as S, Se, and Te. The mobility and band gap properties depend on the ratio of the transition metal and chalcogen. Reference Xu, Liang, Shi and Chen1 There have been many studies on TMDs because they provide a wide range of intriguing physical properties. Reference Xu, Liang, Shi and Chen1,Reference Zhang, Huang, Zhang and Li2 One such example is the transition from direct band gap for single-layer to indirect band gap for multilayer compounds. Each TMD presents unique physical properties, which makes alloying of TMDs very appealing to researchers since the alloys present even more unique physical properties. Ab initio calculations have reported the possibility of tuning the band gap and ultimately the electronic structure of the material by fabricating alloy TMDs. Reference Komsa and Krasheninnikov3 So far, alloying both the metallic part (Mo1−x W x S2) Reference Chen, Xi, Dumcenco, Liu, Suenaga, Wang, Shuai, Huang and Xie4–Reference Yina, Huanga, Yua, Hea and Tub8 and the chalcogen part [MoS2(1−x)Se2x ] Reference Mann, Ma, Odenthal, Isarraraz, Le, Preciado, Barroso, Yamaguchi, von Son Palacio, Nguyen, Tran, Wurch, Nguyen, Klee, Bobek, Sun, Heinz, Rahman, Kawakami and Bartels9 of TMDs have been reported. Fabrication of such materials enable the band gap to vary from 1.82 to 1.99 eV for single-layer Mo1−x W x S2 Reference Chen, Xi, Dumcenco, Liu, Suenaga, Wang, Shuai, Huang and Xie4 and from 1.55 to 1.8 eV for single-layer MoS2(1−x)Se2x . Reference Mann, Ma, Odenthal, Isarraraz, Le, Preciado, Barroso, Yamaguchi, von Son Palacio, Nguyen, Tran, Wurch, Nguyen, Klee, Bobek, Sun, Heinz, Rahman, Kawakami and Bartels9 It is proposed that fabricating MoS2(1−x)Te2x may be an effective way to broaden the tunable band gap range by alloying TMDs. The reported band gap values of single-layer MoS2 is 1.9 eV Reference Muratore, Hu, Wang, Haque, Bultman, Jespersen, Shamberger, McConney, Naguy and Voevodin10 and MoS2 multilayer is 1.36 eV. Reference Ishihara, Hibino, Sawamoto, Suda, Ohashi, Matsuura, Machida, Ishikawa, Sudoh, Wakabayashi and Ogura11 For MoTe2, the reported values are 1.0 eV Reference Ruppert, Aslan and Heinz12 for single-layer and 0.88 eV Reference Lezama, Ubaldini, Longobardi, Giannini, Renner, Kuzmenko and Morpurgo13 for multilayer compounds. This implies that fabricating MoS2(1−x)Te2x would provide material with band gap values ranging from 0.88 to 1.8 eV. If possible, this would open up a variety of new applications for real-life devices. A broadened band gap range suggests that the material would respond over a wider range of wave length as photodetectors or light emitters over wider range of wave length. The specific band gap presented by MoS2(1−x)Te2x alloy make it compatible to conventional Si, which exhibits a band gap of 1.1 eV. There are numerous ongoing studies to exploit TMDs as channel materials, Reference Radisavljevic, Radenovic, Brivio, Giacometti and Kis14–Reference Pradhan, Rhodes, Feng, Xin, Memaran, Moon, Terrones, Terrones and Balicas17 photodetectors, Reference Zheng, Zhang, Yao, Zhang, Xu and Yang18,Reference Zheng, Yao and Yang19 sensors, Reference Samnakay, Jiang, Rumyantsev, Shur and Balandin20 and so on, and fabricating alloys would certainly contribute to the advancement of such researches. However, there have been no reports on the fabrication of MoS2(1−x)Te2x . The atoms close to each other on periodic table, such as Mo and W, are similar in properties such as vapor pressure and binding energy and the same is true for S and Se. This suggests that fabricating the Mo1−x W x S2 and MoS2(1−x)Se2x alloys is reasonable. On the other hand, S and Te are further apart on the periodic table, which results in a greater difference in properties than S and Se. This makes fabricating MoS2(1−x)Te2x somewhat more difficult since there is a possibility of Te desorbing from the film, while S remains during thermal treatments due to vapor pressure differences between the two elements. Moreover, powder Te shows low vapor pressure resulting in low transport rate of the precursor during chemical vapor transport or chemical vapor deposition, which makes such fabrication methods difficult. This is suggested to be the main reason for lack of studies or reports on fabrication of MoS2(1−x)Te2x .
To overcome such problems, we focused on the fabrication of MoS2(1−x)Te2x by physical vapor deposition. Especially, co-sputtering two different targets simultaneously would provide alloy films with the desired composition. Co-sputtering has been carried out in many studies and industrial fabrication for materials other than TMDs. Reference Ozaki, Kiyama, Hirahara, Tanaka, Kuwabata and Torimoto21–Reference Sato, Shimatsu, Okazaki, Muraoka and Aoi23 Also, the composition ratio of the alloy can be well controlled by adjusting the RF power on each target. Another characteristic feature of sputtering deposition is that it produces films with thickness uniformity Reference Ishihara, Hibino, Sawamoto, Ohashi, Matsuura, Machida, Ishikawa, Wakabayashi and Ogura24 and suppressed impurity levels, which results in low carrier concentration and the device can operate on enhancement mode when used as a channel material. Reference Ohashi, Suda, Ishihara, Sawamoto, Yamaguchi, Matsuura, Kakushima, Sugii, Nishiyama, Kataoka, Natori, Tsutsui, Iwai, Ogura and Wakabayashi25 In addition, film thickness is easily controlled with sputtering deposition as the sputtering duration is the only parameter that requires adjustment. We also carried out thermal treatment under Te ambient. It is crucial to perform such treatment to improve the crystal quality of the film. However, due to the high vapor pressure of Te, desorption of Te during such treatment is expected. Annealing under Te ambient is an effective way to prevent the Te desorption. We chose diisopropyl tellurium as a Te precursor. This organic precursor exhibits high vapor pressure compared to that of elemental Te which makes the transportation of the precursor more efficient. In this study, we fabricated MoS2(1−x)Te2x by co-sputtering deposition and investigated physical, chemical, and optical properties of the films. As a result, we achieved to fabricate 6.5 nm MoS2(1−x)Te2x (x = 0.48–0.61) and tuned the band gap value E g from 0.80 to 0.87 eV.
II. EXPERIMENT
MoS2(1−x)Te2x films were fabricated on SiO2/Si by RF magnetron co-sputtering. The substrates were cleaned with acetone in an ultrasonic bath and rinsed with DI water prior to the deposition. The co-sputtering deposition was carried out as follows: MoS2 and MoTe2 targets were simultaneously sputtered at various RF powers on MoS2 and MoTe2 targets. The base pressure was lower than 5.0 × 10⁻⁵ Pa, and Ar partial pressure was 0.3 Pa. The thicknesses of the films were controlled by adjusting deposition time on the basis of growth rate. The chemical states and the composition ratio of the samples were investigated by X-ray photoelectron spectroscopy (XPS) with Al Kα X-ray source. The calculation of the composition was carried out by obtaining the Shirley baseline subtracted area under the curve from Mo 3d, S 2p and Te 3d spectra and dividing them by the respective relative sensitivity factor (RSF): 2.75 for Mo 3d, 0.54 for S 2p, and 9.00 for Te 3d. The composition ratio was calculated by dividing the area by RSF value. As an example, the Te/Mo ratio was calculated as follows.
 $${{{\rm{Te}}} \over {{\rm{Mo}}}} = {{{{{\rm{Are}}{{\rm{a}}_{{\rm{Te}}\;3d}}} \mathord{\left/ {\vphantom {{{\rm{Are}}{{\rm{a}}_{{\rm{Te}}\;3d}}} {{\rm{RS}}{{\rm{F}}_{{\rm{Te}}\;3d}}}}} \right. \kern-\nulldelimiterspace} {{\rm{RS}}{{\rm{F}}_{{\rm{Te}}\;3d}}}}} \over {{{{\rm{Are}}{{\rm{a}}_{{\rm{Mo}}\;3d}}} \mathord{\left/ {\vphantom {{{\rm{Are}}{{\rm{a}}_{{\rm{Mo}}\;3d}}} {{\rm{RS}}{{\rm{F}}_{{\rm{Mo}}\;3d}}}}} \right. \kern-\nulldelimiterspace} {{\rm{RS}}{{\rm{F}}_{{\rm{Mo}}\;3d}}}}}}$$
Spectroscopic ellipsometry was carried out to evaluate the band gap of the samples.
Spectroscopic ellipsometry directly measures the parameters ψ and Δ which are phase difference and amplitude ratio of p- and s-polarization of light, respectively. The ellipsometric parameters ψ and Δ depend on the thickness d, refractive index n, and the extinction coefficient k of the sample. By constructing an optical model to simulate such parameters and fitting the measured ψ and Δ, the thickness, the refractive index, and the extinction coefficient can be obtained. In this study, after ψ and Δ measurements, the Tauc–Lorentz model, which is often used in amorphous and semiconductor materials, Reference Kamiya, Nomura and Hosono26 was used to fit the ellipsometric parameters. From the fitted Tauc–Lorentz function, the extinction coefficient k was obtained. Then the band gap was calculated using the Tauc plot method. In this method, the absorption coefficient α is first calculated from the following relation.
 $$\alpha = {{4\pi k} \over \lambda }$$
Then, band gap energy E g is obtained from the Tauc plot equation, which is defined as
 $${\left( {\alpha h\nu } \right)^m} = A\left( {h\nu - {E_{\rm{g}}}} \right)\quad ,$$
where m is 2 for a direct band gap semiconductor and 1/2 for indirect band gap semiconductor, Reference Shaaban, Abd El-Sadek, El-Hagary and Yahia27 and A is a constant. By plotting (αhν) m against photon energy and extrapolating the result, the x-intercept provides the band gap value. The surface condition of the films were observed by scanning electron microscopy (SEM) and the composition of the film was calculated using energy dispersive X-ray spectroscopy (EDX) to confirm the correlation with the XPS result. Raman spectroscopy measurements were carried out to evaluate the crystal quality of MoS2(1−x)Te2x with excitation wave length of 532 nm and measurement ranges of wave number from 360 to 580 cm−1.
III. RESULTS
A. Room temperature sputtering and in situ post-deposition annealing
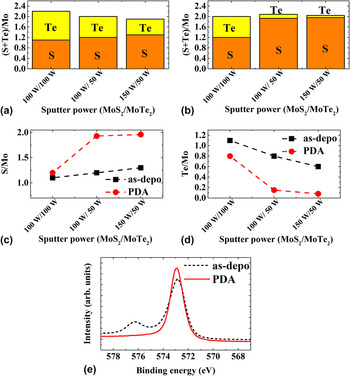
Co-sputtering deposition was first carried out at room temperature. The sputtering power for MoS2 and MoTe2 were MoS2/MoTe2 = 100 W/100 W, 100 W/50 W, and 150 W/50 W. Sputtering deposition was adjusted to provide samples with thickness of approximately 300 nm. After the deposition, samples were subjected to in situ post-deposition annealing (PDA) in the same chamber under N2 ambient at 500 °C. The composition calculated from XPS measurements of the as-deposited samples and annealed samples are shown in Fig. 1. It is evident that co-sputtering with various sputtering power well controls the composition of the alloy. However, the in situ PDA of the samples have caused Te desorption as it can be seen in Fig. 1(d). It has been reported that thermal treatment results in severe Te desorption over certain temperature ranges.
Reference Wang, Wang, Yang, Li, Feng, Zhang, Wu and Zeng28
On the other hand, S component of the samples increased after PDA. It can be suggested that the residual chalcogen inside the sputtering chamber was responsible in terms of controlling the chalcogen ratio of the samples. When the chamber was heated for PDA, the residual S inside the chamber was adsorbed by the sample causing an increase in S content. For Te, it can be seen from Fig. 1(d) that Te desorption was somewhat suppressed for samples with lower MoTe2 sputterring power. The residual Te inside the chamber exhibited a certain vapor pressure. It can be suggested that this vapor pressure caused suppression of the Te desorption in the sample by counteracting the vapor pressure of desorbing Te inside the film. From these results, it can be concluded fabrication of MoS2(1−x)Te2x
atomically thin film is difficult by PDA under N2 ambient and that annealing under chalcogen ambient is crucial to control the chalcogen content. Formation of Mo–Te bonds were also confirmed with the XPS results. Figure 1(e) shows the Te 3d spectra of as-deposited and PDA samples. The peak at around 576.3 eV corresponds to oxidized Te. It is believed that Te underwent oxidation when the sample was taken out of sputtering chamber and transferred for XPS measurements. If oxygen was introduced inside the sputter chamber, the PDA sample would have shown the same oxidation peak. However, although the same process was taken, there was no oxidation of the PDA sample. This can be attributed to the fact that Te was already bonded to Mo such that no O can be bonded to Te for the PDA sample. Raman spectroscopy measurements showed no observable
 ${\rm{E}}_{2{\rm{g}}}^1$
or A1g peak. This is attributed to the lack of crystal quality or poor orientation of the crystal. In fact, when the MoS2 is deposited at room temperature, the MoS2 domains are randomly oriented in the films and the poor orientation cannot be improved even after thermal annealing.
Reference Moser and Lévy29
Therefore, it is required that the c-axis orientation of the MoS2(1−x)Te2x
be aligned within the film during sputtering process.
The composition ratio (chalcogen/Mo) of (a) as-deposited film and (b) PDA film. The chalcogen content change before and after PDA of (c) sulfur and (d) tellurium. (e) Te 3d spectra of as-deposited film and PDA film.

B. High-temperature co-sputtering
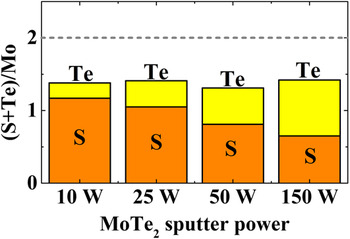
We have reported that high-temperature sputtered MoS2 films exhibit good orientation of the layers. Reference Ohashi, Suda, Ishihara, Sawamoto, Yamaguchi, Matsuura, Kakushima, Sugii, Nishiyama, Kataoka, Natori, Tsutsui, Iwai, Ogura and Wakabayashi25 Therefore, we carried out high-temperature co-sputtering to produce MoS2(1−x)Te2x films of high crystal quality, where the c-axis of the layer is oriented perpendicular to the substrate. Co-sputtering deposition was carried out with RF power of MoS2 fixed to 100 W and with the sputtering power of MoTe2 varied from 10 to 150 W. Substrates were heated up to 300 °C. The deposition duration was adjusted to provide films with thickness of approximately 6.5 nm thickness. Figure 2 shows the composition of the films calculated from XPS measurements. As can be seen the chalcogen content of the film can be controlled to a certain extent even with high-temperature sputtering. It is worth nothing that the S content of the film is approximately equal to that observed for PDA films. However, in contrast to room temperature sputtering, where the metal to chalcogen ratio of 1:2 was achieved, there is chalcogen desorption even in as-deposited films with high-temperature sputtering, where the metal to chalcogen ratio was approximately 1:1.3 and it can be observed that Te desorption is dominating over change in S content. Compared to S, Te is more weakly bonded to Mo, which makes the Te desorption the dominant process during co-deposition process. Raman spectroscopy measurements provided no Raman signal to identify Mo–S vibration mode. It can be speculated that there were not enough metal to chalcogen bonds for the vibrational mode to present Raman peaks for measurements due to chalcogen loss. It is crucial to control the chalcogen content of the film since chalcogen content of the film largely contributes to the crystallinity of the film and chalcogen deficit creates energy levels in the band gap which causes unintentional narrowing of the band gap. It has been reported that loss in sulfur for MoS2 film creates an unintentional energy level acting as a dopant in the material resulting in undesired carrier concentration increase. Reference Liu, Guo, Fang and Robertson30 Such an increase in carrier concentration prohibits a device from operating in enhancement mode when used as a channel material. Therefore, it is crucial to prevent such degradation of the film.
The composition ratio (chalcogen/Mo) of as high-temperature sputterd film.

C. Post-deposition tellurization annealing
To improve the crystal quality and compensate for the chalcogen deficit, the combination of high-temperature sputtering and post-deposition tellurization annealing (PDTA) were carried out. Since in situ annealing under N2 showed Te desorption, Te ambient was selected rather than S ambient as the annealing condition. From the fact that Te underwent desorption, it can be assumed that the bonding energy of Mo to Te is weaker than that of Mo to S, which seems reasonable considering their atomic size where Te is much greater in size than S. After sputtering deposition was conducted, post-deposition tellurization was carried out in a quartz tube furnace at 600 °C. Diisopropyl tellurium [(i-C3H7)2Te] was used as a tellurization precursor. Earlier, we reported the effectiveness of organic precursor for sulfurization.
Reference Ishihara, Hibino, Sawamoto, Suda, Ohashi, Matsuura, Machida, Ishikawa, Sudoh, Wakabayashi and Ogura11,Reference Ishihara, Suda, Hibino, Sawamoto, Ohashi, Yamaguchi, Matsuura, Machida, Ishikawa, Sudoh, Wakabayashi and Ogura31,Reference Ishihara, Hibino, Sawamoto, Suda, Ohashi, Matsuura, Machida, Ishikawa, Sudoh, Wakabayashi and Ogura32
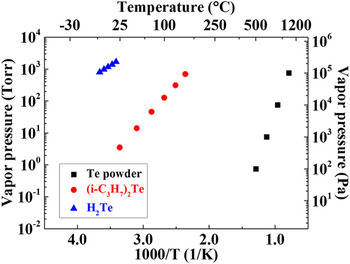
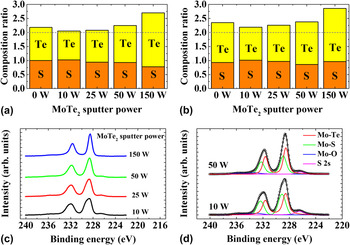
Figure 3 shows temperature dependent vapor pressures of (i-C3H7)2Te, H2Te, and Te powder. Compared to Te powder, the (i-C3H7)2Te exhibits a much higher vapor pressure, which is favorable since suppression of desorption from the film can be expected. Although H2Te exhibits higher vapor pressure, (i-C3H7)2Te is stable in air with no explosiveness and much lower toxicity. The tellurization was carried out for 60 min by bubbling the precursor, which is in liquid form, by H2 carrier gas, transporting the precursor to the substrates. Tellurization conditions were varied as follows. The flow rate of the carrier gas was set to 30 and 60 sccm. Figures 4(a) and 4(b) show the results of the composition calculation. It can be seen that the metal to chalcogen ratio was at least 2, which indicates that Te deficit was compensated with PDTA. The Mo 3d spectra for as-deposited film and PDTA film are presented in Fig. 4(c). From the raw spectra, a clear shift of the Mo 3d spectra for Mo4+ state can be observed. The raw spectra were fitted with the Voigt function to differentiate the peaks as shown in Fig. 4(d). The reported value of Mo–Te peak
Reference Bernèdea, Amorya, Assmanna and Spiesserb33
is lower than that of Mo–S peak,
Reference Muratore, Hu, Wang, Haque, Bultman, Jespersen, Shamberger, McConney, Naguy and Voevodin10
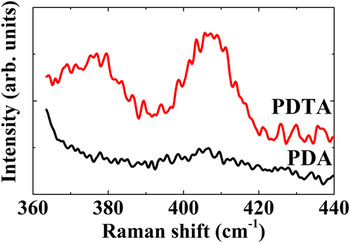
hence the lower energy peak represents the Mo–Te peak. This agrees with the earlier speculation that Mo–Te bond is weaker than that of Mo–S bond. As the sputtering power of MoTe2 increases, the peak indicating Mo–Te bonds increases as well. This is another piece of evidence that adjusting the sputter power of MoTe2 provides films with different composition. Figure 5 shows Raman spectra of the PDA and PDTA films. It is clear that the characteristic
 ${\rm{E}}_{2{\rm{g}}}^1$
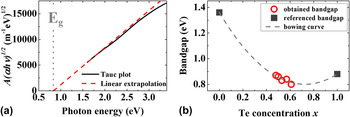
and A1g peaks unique to MoS2 can be clearly observed for the PDTA film although the film thickness was thinner than the PDA film. This suggests that the film fabricated with PDTA shows much higher crystal quality and better crystal orientation. It also shows that crystal quality of the film is quite sensitive to the composition, or to what extent the chalcogen are compensated. Bandgap energy was evaluated using spectroscopic ellipsometry. It was confirmed that the band gap value shifts according to the composition of S and Te in the film. Figure 6 shows the Tauc plot and the band gap value distribution according to the composition ratio. As seen in Fig. 6(b), the band gap value deviates from a linear interpolation from the band gap of MoS2 and MoTe2. This is attributed to so-called bowing effect that is predicted by ab initio calculations.
Reference Komsa and Krasheninnikov3
The bowing curve was obtained by fitting the following equation to the band gap value obtained in this study.
 $${E_{{\rm{alloy}}}} = \left( {1 - x} \right) \cdot {E_{{\rm{Mo}}{{\rm{S}}_2}}} + x \cdot {E_{{\rm{MoT}}{{\rm{e}}_2}}} - b \cdot x \cdot \left( {1 - x} \right)$$
The temperature dependent vapor pressure of (i-C3H7)2Te, H2Te, and Te powder.

The composition ratio (chalcogen/Mo) of PDTA films produced with carrier gas flow rate of (a) 30 sccm and (b) 60 sccm. (c) Raw Mo 3d spectra of PDTA samples and (d) example of peak fitting indicating change in Mo–Te peak.

Raman spectra of PDA (MoS2/MoTe2 sputtering power: 100 W/100 W) and PDTA (MoTe2 sputtering power: 10 W) films.

(a) An example showing Tauc plot analysis and (b) the band gap values obtained in this study.

The calculated bowing parameter b was 1.06 eV. Using this bowing parameter, the band gap value of MoS2(1−x)Te2x with arbitrary composition can be obtained by substituting the composition x and the bowing parameter b into Eq. (4). Given a required band gap of the material for device use, for example, the required composition can be calculated which makes the material much more appealing toward practical use.
IV. DISCUSSION
A. Excessive chalcogen in samples from PDTA
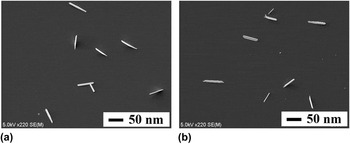
As mentioned above, after PDTA the chalcogen to molybdenum ratio of the films exceeded 2. This is attributed to rod-like Te deposits on top of the film. Figure 7 shows a SEM micrograph of the surface of the sample. The distribution of such rod-like features is independent of the Te precursor flow rate. The Te 3d XPS spectra of the PDTA films showed some oxidation of Te. By the same argument made with the PDA samples fabricated with in situ annealing, if the Te was bonded to Mo, there should not be any oxidized Te. The fact that there was oxidation suggests that there was elemental Te and this is thought to be the deposit on the surface. From EDX measurements, these rods were in fact confirmed to be elemental Te. When EDX measurements were taken on the film surface, where there was no Te deposits, a metal to chalcogen ratio of 1:2 was confirmed.
SEM micrographs of PDTA films with carrier flow rate of (a) 30 sccm and (b) 60 sccm.

B. The cause of the precipitates
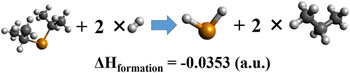
It is suspected that when the samples were tellurized, the Te precursor first compensated for the chalcogen deficit. When the film was tellurized to achieve a molybdenum to chalcogen ratio of 1:2, the excess Te was deposited on top of the film since Te content inside the film reached saturation. This is also evident from the fact that for samples fabricated with higher MoTe2 sputter power, a larger amount of Te was deposited on the film. It is believed that the annealing temperature was too high, which accelerated the rate at which Te forms bonds with Mo. That is, if the rate at which Te forms bonds with Mo is high, that means that the amount of nonbonded Mo remaining would run out faster. Hence, the saturation point, at which all of Mo has formed bond with Te, is reached faster. Another cause for the Te deposit can be due to the (i-C3H7)2Te decomposing into elemental Te and depositing on the film surface. To confirm the decomposition reaction of (i-C3H7)2Te, density functional theory (DFT) simulation with B3LYP/3-21G was performed using PC GAMESS/Firefly. 34,Reference Schmidt, Baldridge, Boatz, Elbert, Gordon, Jensen, Koseki, Matsunaga, Nguyen, Su, Windus, Dupuis and Montgomery35 It was revealed that decomposition reaction indicated in Fig. 8 showed lowest change in formation enthalpy (ΔH formation). Other reaction paths considered are as follows.
 $${\left( {i{\rm{ \hscale 40%- }}{{\rm{C}}_3}{{\rm{H}}_7}} \right)_2}{\rm{Te}} \to {\rm{Te}} + 2\left( {{{\rm{C}}_3}{{\rm{H}}_7}} \right)\quad \Delta {H_{{\rm{formation}}}} = 0.217349\;\left( {{\rm{a}}{\rm{.u}}{\rm{.}}} \right)$$
 $${\left( {i{\rm{ \hscale 40%- }}{{\rm{C}}_3}{{\rm{H}}_7}} \right)_2}{\rm{Te}} + {{\rm{H}}_2} \to {{\rm{H}}_2}{\rm{Te}} + 2\left( {{{\rm{C}}_3}{{\rm{H}}_7}} \right)\quad \Delta {H_{{\rm{formation}}}} = 0.130684\;{\rm{(a}}{\rm{.u}}{\rm{.)}}$$
 $${\left( {i{\rm{ \hscale 40%- }}{{\rm{C}}_3}{{\rm{H}}_7}} \right)_2}{\rm{Te}} \to {{\rm{H}}_2}{\rm{Te}} + 2\left( {{{\rm{C}}_3}{{\rm{H}}_6}} \right)\quad \Delta {H_{{\rm{formation}}}} = 0.093195\;\left( {{\rm{a}}{\rm{.u}}{\rm{.}}} \right)$$
 $${\left( {i{\rm{ \hscale 40%- }}{{\rm{C}}_3}{{\rm{H}}_7}} \right)_2}{\rm{Te}} + {{\rm{H}}_2} \to {\rm{Te}} + 2\left( {{{\rm{C}}_3}{{\rm{H}}_7}} \right)\quad \Delta {H_{{\rm{formation}}}} = 0.051363\;\left( {{\rm{a}}{\rm{.u}}{\rm{.}}} \right)$$
The optimized decomposition reaction of the Te precursor calculated by DFT simulation.

The ΔH formation shown in Fig. 8 is negative and differ largely from the ΔH formation of other reaction paths shown in Eqs. (5)–(8), which suggests that this reaction is dominating among the others that were considered. The result eliminates the possibility of the precursor decomposing into Te and directly depositing on the surface of the samples. To prevent Te deposits, tellurization duration can be shortened; however, further optimization of tellurization is required to prevent Te deposits.
V. CONCLUSION
In summary, we fabricated 6.5 nm MoS2(1−x)Te2x thin films with high crystalline quality by high-temperature co-sputtering deposition and PDTA using a novel Te precursor (i-C3H7)Te for the first time. Fabricating the TMD alloy enabled tuning of the band gap and especially by the formation of MoS2(1−x)Te2x , the range of band gap was broadened with the composition ranging from x = 0.48 to 0.61 and the band gap value from 0.80 to 0.87 eV. Wider range of band gap values makes TMDs more applicable toward various real-life devices. The bowing parameter b was calculated to be 1.06 eV. This enables accurate estimate of the band gap value according to the composition. In other words, when exploited for device use, if the required band gap value is known, the required composition can be calculated with the bowing parameter. We have also shown that co-sputtering is suitable for alloy fabrication since the composition ratio can be easily controlled by adjusting the sputter power on different targets. The fabrication method can be applied to different TMD materials as well.
ACKNOWLEDGMENTS
This work was partly supported by JSPS KAKENHI Grant No. 16J11377. This work was also partly supported by JST CREST No. JPMJCR16F4, Japan.