The improvement of health through the elimination of chronic malnutrition is undoubtedly among the most important benefits from modern economic growth in developed countries (Fogel Reference Fogel1994). Recent discoveries of declining or persistently poor health in rapidly growing developing countries such as India (Deaton Reference Deaton2007; Jayachandran and Pande Reference Jayachandran and Pande2017) and China (Trivedi Reference Trivedi2017) have, therefore, come as a surprise to some, who expected improving health to accompany rising incomes in these countries as well. But historical research finds that the transition from stagnation to growth was disruptive, even in developed countries. There is evidence that residents of both Britain (Floud, Wachter, and Gregory Reference Floud, Wachter and Gregory1990) and the United States (A’Hearn Reference A’Hearn, Komlos and Baten1998; Craig Reference Craig, Komlos and Kelly2016; Floud et al. Reference Floud, Fogel and Harris2011; Fogel Reference Fogel, Engerman and Gallman1986; Haines Reference Haines2004; Komlos Reference Komlos1987; Margo and Steckel Reference Margo and Steckel1983; Zehetmayer Reference Zehetmayer2011) experienced declining health over several decades of the nineteenth century. Together, these patterns suggest that declining health may be a common aspect of the early development process.
In the case of the United States, this phenomenon is known as the “Antebellum Puzzle.” Despite rising income per capita in the nineteenth century, average height (a standard measure of health in historical contexts) appears to have declined precipitously in the birth cohorts of the 1830s to the 1850s and then to have stagnated for nearly 50 years.Footnote 1 This result has generated a large literature seeking to understand what mechanisms might have been responsible for the decline (see summary by Floud et al. Reference Floud, Fogel and Harris2011).
The implication that early modern economic growth in the United States came at the expense of health has been met with some skepticism. Instead of accepting the existence of this puzzle and seeking to explain it, some scholars have challenged its empirical basis, suggesting that the decline in height might be an artifact of the data rather than a true representation of living standards (e.g., Gallman Reference Gallman1996). In particular, these scholars have argued that the data used to establish the existence of the Antebellum Puzzle and related phenomena may suffer from sample-selection bias, which arises when conclusions are drawn from a sample that is not representative of the population. Their main contention is that volunteer military records, from which the bulk of historical height data are drawn, represent only individuals who chose to enlist, and are, therefore, unlikely to have been representative of the whole population. This concern goes beyond the possible impacts of selection on observables, which would arise if the military and the whole population differed only on the basis of observable characteristics (e.g., if residents of urban areas were shorter and more likely to join the military, but all urbanites were equally likely to enlist)—concerns that the historical heights literature has long recognized and addressed (Fogel Reference Fogel, Engerman and Gallman1986; Fogel et al. Reference Fogel, Engerman and Floud1983). Instead, this concern is based on the possible presence of selection on unobservables, which would arise if the military and the population at large differed in terms of characteristics unobservable to the researcher (e.g., if a childhood health shock made shorter urbanites more likely to enlist than taller ones).
Howard Bodenhorn, Timothy W. Guinnane, and Thomas A. Mroz (Reference Bodenhorn, Guinnane and Mroz2017) have recently argued that the existing literature has not satisfactorily addressed bias from selection on unobservables. Importantly, because time-invariant selection on unobservables would not bias the observed trend in heights, they argue that the improving economic conditions of the antebellum period may have made selection on unobservables more negative over time, leading to a spurious decline in observed stature among military enlisters.Footnote 2 That is, they argue that population height might have been rising (or at least not falling), and that only the height of enlisters declined because the composition of this group changed as successive cohorts faced better options in the civilian labor market.Footnote 3
Although Bodenhorn, Guinnane, and Mroz (Reference Bodenhorn, Guinnane and Mroz2017) have found evidence suggesting the presence of time-varying bias from selection on unobservables into U.S. height data sets, it is still unknown whether sample-selection bias wholly, or even partially, accounts for the Antebellum Puzzle. More generally, it is not known whether correcting for bias from selection on unobservables would lead to any meaningful changes in conclusions drawn from historical samples of U.S. height data.
To my knowledge, this article is the first to adjust the trend in average stature for sample-selection bias stemming from selection on unobservables. I do this by estimating a two-step semi-parametric sample-selection model (Das, Newey, and Vella Reference Das, Newey and Vella2003; Heckman Reference Heckman1979; Klein and Spady Reference Klein and Spady1993; Newey Reference Newey2009; Vella Reference Vella1998) for height observed only among military enlisters, producing an estimated trend in average stature that is adjusted for selection on both observables and unobservables. The results enable me to shed light on two questions. First, does incorporating a correction for sample-selection bias meaningfully alter the conclusions drawn from stature data? I address this question by comparing my adjusted trend in average stature to the trend estimated using standard techniques of the anthropometric history literature, which do not correct for selection on unobservables. Second, is the Antebellum Puzzle an artifact of sample-selection bias? I address this question by determining whether the data exhibit an Antebellum Puzzle after incorporating the correction for sample-selection bias. To conclude that no puzzle is present, it must be the case that the estimated trend in average stature is increasing over time; simply eliminating the decline in average stature would not be sufficient to conclude that the Antebellum Puzzle is an artifact of sample-selection bias.
I draw my main height data from military records for U.S.-born white males from the birth cohorts of 1832–1860. I collected data for the birth cohorts of 1832–1846 from Robert W. Fogel et al. (Reference Fogel, Costa and Haines2000), who provide information on individuals who served in the Union Army during the Civil War. Individuals born after 1846 would have been too young to serve in the Union Army (which was disbanded after the end of the war), so I collected data for the birth cohorts of 1847–1860 from the records of postbellum enlistments in the Register of Enlistments in the US Army, 1798–1914 (henceforth, Register of Enlistments). This source provides information on individuals enlisting in the professional Regular Army. This combination of sources has previously been used to establish the existence of the Antebellum Puzzle (e.g., Fogel Reference Fogel, Engerman and Gallman1986, Table 9.6); however, historical accounts of military enlistment (Bernardo and Bacon Reference Bernardo and Bacon1955; Coffman Reference Coffman1986; Foner Reference Foner1970; Weigley Reference Weigley1967) indicate that the incentives for enlistment and the conditions of service were better in the Union Army than in the Regular Army, suggesting that there may have been more negative selection into the Regular Army after the Civil War (the 1847–1860 cohorts) as compared to the Union Army during the Civil War (the 1832–1846 cohorts).
Additional data are collected from the U.S. censuses of 1850–1870. Individuals observed in the military data are linked to their census records in adolescence, thus, adding socioeconomic characteristics of enlisters to the data set. I also collected a random sample of micro-level census data (Ruggles et al. Reference Ruggles, Genadek and Goeken2015) from the complete population in these birth cohorts that was at risk for military service. These data make possible comparisons of the pre-enlistment socioeconomic characteristics of enlisters to those of the whole population, enabling me to characterize the determinants of military enlistment.
For identification of the sample-selection model, it is necessary to isolate variation in the probability of enlisting in the military that is unrelated to height, conditional on all covariates. To this end, I impose two restrictions on the model. First, I incorporate county-level vote shares for Abraham Lincoln in 1860 in a binary choice model of military enlistment (the first step of the two-step sample-selection model), but exclude this variable from the equation determining height. This variable, which is informative on a county’s views on slavery and other central issues in the election, is a proxy for individuals’ political ideology. By way of example, voting data for this election and others of the era have been shown to be important in the military desertion decision during the Civil War (Costa and Kahn Reference Costa and Kahn2003, Reference Costa and Kahn2007) and in determining migration of Civil War veterans in the postbellum period (Eli, Salisbury, and Shertzer Reference Eli, Salisbury and Shertzer2018). Second, I allow the effects of covariates on the probability of enlisting in the military to vary based on whether an individual’s birth year made him eligible to serve during the Civil War (i.e., by whether he was born in 1846 or earlier), whereas the equation determining height is assumed to be time-invariant. This restriction is based on the historical accounts of military enlistment cited earlier.
I find that failing to account for selection on unobservables can appreciably affect the conclusions drawn from historical height data. My estimated trend in average stature, which incorporates the correction for selection on unobservables, differs meaningfully and statistically from the trend estimated using the standard methodology of the historical heights literature, which includes no such correction. I, thus, validate concerns over the existence of sample-selection bias induced by selection on unobservables in historical height samples. In particular, the magnitude of the decline in average stature between 1832 and 1860 without correcting for selection on unobservables is 1.29 inches in my data, with 1.25 inches being the benchmark in the literature (e.g., Costa and Steckel Reference Costa, Steckel, Steckel and Floud1997; Craig Reference Craig, Komlos and Kelly2016). Adjusting for selection on unobservables results in a considerably smaller decline of only 0.64 inches, and it is possible to reject the null hypothesis of equality between this decline and the decline estimated according to the literature’s standard techniques. The chief cause of changing selection on unobservables appears to be the changing composition of the military after the Civil War. Consistent with historical accounts, I find that the 1847–1860 cohorts, who enlisted in the Regular Army, were more negatively selected than were the 1832–1846 cohorts, who enlisted in the Union Army. Combining these sources without correcting for this concern, as is commonly done in the historical heights literature (e.g., Fogel Reference Fogel, Engerman and Gallman1986), leads to bias.
Despite the presence of this cohort-varying sample-selection bias, my results do not support the argument that the Antebellum Puzzle is a statistical artifact. A decline in stature of 0.64 inches is evident in the trend incorporating the correction for selection on unobservables, and it is possible to reject the null hypothesis of no decline in heights over time (a fortiori ruling out the increase in average stature that would be required to solve the puzzle by sample selection alone). Thus, my results support the view that early modern economic growth was disruptive to health in the United States.
This article also addresses a broader challenge to research in economic history. Nearly all economic historical data are drawn from sources that are potentially vulnerable to sample-selection bias, and researchers often struggle to deal with it. Although I show that selection on unobservables may make drawing firm conclusions more difficult, I also provide a path forward that allows the bias to be quantified and shows how researchers can learn from a selected sample without ignoring its potential pitfalls.
EMPIRICAL FRAMEWORK
The Model
To explain how selection on observables and selection on unobservables generate sample-selection bias and how I adjust for it, I introduce a simple model of height and military enlistment. As is common in settings where researchers are concerned about selection on unobservables, I use a Tobit type-II model (Amemiya Reference Amemiya1985), which is an empirical application of the Roy model used by Bodenhorn, Guinnane, and Mroz (Reference Bodenhorn, Guinnane and Mroz2014, Reference Bodenhorn, Guinnane and Mroz2017, p. 185) to illustrate their concerns regarding selection on unobservables.
Suppose that the height of individual i from birth cohort t, hit, is determined by
 $${h_{it}} = {\gamma _t} + {{{\bf{x'}}}_{it}}\theta + {\varepsilon _{it}},$$
where γt are cohort-specific intercepts, xit is a vector of covariates affecting both height and military enlistment, and ɛit are unobserved components in the determination of height. Let yit be an indicator variable equal to one if individual i from birth cohort t enlists and zero otherwise. Suppose that individuals enlist if and only if their latent utility of enlistment,  $y_{it}^*$, is greater than zero. Let
 $y_{it}^*$ be determined by
 $$y_{it}^* = {\alpha _t} + {{{\bf{x'}}}_{it}}{\beta _k} + {{{\bf{z'}}}_{it}}{\delta _k} + {\mu _{it}},$$
where αt are cohort-specific intercepts, xit is (as in Equation (2)) a vector of covariates affecting both military enlistment and height, zit is a vector of covariates affecting military enlistment but not height, and uit are unobserved components in the determination of military enlistment.Footnote 4 Note that the coefficients βk and δk in Equation (2) are indexed by k to indicate that they are permitted to vary by cohort group (i.e., k could represent either the 1832–1846 birth cohorts, who were old enough to serve in the Civil War, or the 1847–1860 birth cohorts, who were not). I impose this structure because the nature of the enlistment decision likely differed between the cohorts that were eligible for Civil War service and those that were not. The variables yit, xit, and zit are observed regardless of enlistment status,Footnote 5 while ɛit, uit, and  $y_{it}^*$ are never observed. The main challenge is that hit is observed only if yit = 1—that is, height is observed only if individual i enlists.
Under standard assumptions,Footnote 6 it is possible to write the probability that individual i enlists, given his observable characteristics (his conditional probability of military enlistment), as
 $$P({y_{it}} = 1|{{\bf{x}}_{it}},{{\bf{z}}_{it}};t) = G({\alpha _t} + {{{\bf{x'}}}_{it}}{\beta _k} + {{{\bf{z'}}}_{it}}{\delta _k}).$$
These assumptions also permit height for enlisters to be written as
 $${h_{it}} = {\gamma _t} + {{{\bf{x'}}}_{it}}\theta + \Omega ({\alpha _t} + {{{\bf{x'}}}_{it}}{\beta _k} + {{{\bf{z'}}}_{it}}{\delta _k}) + {\xi _{it}},$$
where  $\Omega ({\alpha _t} + {{{\bf{x'}}}_{it}}{\beta _k} + {{{\bf{z'}}}_{it}}{\delta _k}) = E({\varepsilon _{it}}|{{\bf{x}}_{it}},{{\bf{z}}_{it}},{y_{it}} = 1;t)$ and ξit is an error term that is orthogonal to uit. Thus, enlister i’s height is the sum of three components—the average height in the population for all individuals with the same observables
 $({\gamma _t} + {{{\bf{x'}}}_{it}}\theta )$, the difference in average height between enlisters and the whole population with the same observables (
 $\Omega ({\alpha _t} + {{{\bf{x'}}}_{it}}{\beta _k} + {{{\bf{z'}}}_{it}}{\delta _k})$), and a “well behaved” error term (ξit). Note that if ɛit and uit are uncorrelated (i.e., there is no selection on unobservables) then Ω(·) = E(ɛit|xit,zit;t) = 0 and the average height of enlisters is equal to the average height in the population for individuals with the same observables.
One notable difference between my model and the diagnostic test proposed by Bodenhorn, Guinnane, and Mroz (Reference Bodenhorn, Guinnane and Mroz2017) is that I model the choice of whether or not to enlist in the military as a once-per-lifetime decision whereas they focus on the dynamic decision of military enlistment within a cohort. This is simply a matter of two different approaches to the same problem. Fundamentally, Bodenhorn, Guinnane, and Mroz (Reference Bodenhorn, Guinnane and Mroz2017, p. 173) are concerned, as am I, with a situation “in which an individual enters the sample, in part, due to the unmeasured characteristics that are related to the outcome of interest.” Their focus on the relationship of military enlistment with within-cohort changes in economic conditions is intended as a way to diagnose the presence of sample-selection bias using only the selected sample, which is not the fundamental concern of their article. Thus, although I do not directly address Bodenhorn, Guinnane, and Mroz’s (Reference Bodenhorn, Guinnane and Mroz2017) specific concern regarding changing stature over time within a birth cohort, I do address the broader concern that unobservables determined both height and enlistment, generating time-varying sample-selection bias.
The Empirical Challenge
The goal of this article is to learn the unconditional average height of birth cohort t, E(hit|t), for all t ϵ {1832,…,1860}. If the heights of a random sample of the population were observed, it would be possible to estimate E(hit|t) simply by computing averages for each cohort or by regressing heights on a series of birth cohort indicators (with no controls). However, because height data are available only for military enlisters, and because non-random selection into military service generates sample-selection bias, it is impossible to accurately estimate E(hit|t) by this simple approach. Such selection comes in two forms—selection on observables and selection on unobservables.Footnote 7
Selection on observables stems from the impact of xit on both military enlistment and height. If observable characteristics impact the probability of military enlistment, then their distribution in the military will be different from their distribution in the population. If these characteristics also affect height, then the distribution of military heights will also differ from that of the population. For example, if residents of urban areas are both shorter than the population average and more likely to join the military, then they will be over-represented in the military, which will, in turn, be shorter than the whole population. If all bias is due to selection on observables (i.e., ɛit and uit are uncorrelated, so Ω(·) = 0), then Equation (4) shows that selection is random, conditional on observables. Thus, the average height of enlisters with a given set of observable characteristics is equal to the average height of the population with the same observables. Such selection can then be addressed by re-weighting the military data so that its distribution of observables matches that of the population. This is a standard approach in the historical heights literature (e.g., Fogel et al. Reference Fogel, Engerman and Floud1983, p. 454) and can be achieved by computing weights from aggregate data or (as I do later) from estimates of conditional enlistment probabilities from Equation (3).Footnote 8
The formal basis for selection on unobservables is also illustrated in Equation (4). Enlisters’ average heights, conditional on all observables, differ from those of the whole population by  $\Omega ({\alpha _t} + {{{\bf{x'}}}_{it}}{\beta _k} + {{{\bf{z'}}}_{it}}{\delta _k})$, which is non-zero when ɛit and uit are correlated with one another. Such a correlation might arise if, for instance, an unobserved adverse health shock in childhood harmed an individual’s labor market prospects, making him more likely to enter the military, and also reduced his terminal height relative to others with his same observable characteristics. Re-weighting cannot address this bias because re-weighting requires selection into the military to be random, conditional on observables; in this case, the military will over-represent shorter individuals for a given set of covariates. Addressing selection on unobservables requires the estimation of
 $\Omega ({\alpha _t} + {{{\bf{x'}}}_{it}}{\beta _k} + {{{\bf{z'}}}_{it}}{\delta _k})$ through the estimation of Equation (4) for the selected sample. Once estimated, this term can be removed, leaving the adjusted average heights of enlisters equal to the average height of the population with the same observables. Any selection on observables can then be addressed by re-weighting. I discuss the intuition of this approach later.
While sample-selection bias may cause the average height of military enlisters to differ from the average height of the population, it does not bias a naively estimated trend in average height unless its magnitude changes over time. For instance, if selection on unobservables caused military enlisters to always be one inch shorter than the population, then the trend in heights of military enlisters would be the same as the trend in heights of the population. Bodenhorn, Guinnane, and Mroz (Reference Bodenhorn, Guinnane and Mroz2014) argue that selection on unobservables might have changed over time due to economic growth in the antebellum period: as economic growth improved the attractiveness of the civilian sector relative to the military sector, only those with increasingly poor civilian labor market opportunities would choose to enlist; if success on the civilian labor market was positively correlated with height (for instance, if both were affected by childhood health shocks, as in the example noted earlier), then enlisters would be more negatively selected over time.
Intuition of the Correction for Selection on Unobservables
The historical heights literature typically corrects for selection on observables, but not for selection on unobservables (see detailed discussion by Bodenhorn, Guinnane, and Mroz Reference Bodenhorn, Guinnane and Mroz2017, pp. 173–4, 187–9). In so doing, the literature typically assumes (implicitly or explicitly) that ɛit and uit are uncorrelated. In this article, I impose no such assumption, allowing ɛit and uit to be potentially correlated. I then adjust observed heights for sample-selection bias induced by selection on both observables and unobservables using the methods discussed earlier.
How is it possible to recognize and correct for sample-selection bias induced by selection on unobservables? The key insight is that the magnitude of the bias will vary with the probability of military enlistment conditional on observables, as defined in Equation (3).Footnote 9 To see this, suppose that there is negative selection on unobservables (i.e., a negative correlation between uit and ɛit) that arises, for example, from unobserved adverse health shocks in childhood making the military relatively more attractive and reducing terminal height. Suppose that there is one group of potential enlisters whose probability of enlistment conditional on observables is close to zero (i.e., some combination of observable characteristics in the population that is almost never observed to enlist). For concreteness, this group might be thought of as the children of wealthy craftsmen.Footnote 10 These individuals enlist only if they experienced a particularly strong adverse health shock, and, thus, the members of this group observed enlisting are shorter than the whole population with the same observable characteristics. On the other hand, suppose that there is a group of men whose conditional enlistment probability is close to one (i.e., some combination of observable characteristics in the population that is almost always observed to enlist). For concreteness, this group might be thought of as the children of poor unskilled laborers, for whom enlistment is more attractive than their civilian labor market options. They enlist regardless of their childhood health, and enlisters from this group are approximately the same height as the whole population with the same observable characteristics.
Thus, in the presence of negative selection on unobservables into the military height sample, there would be a positive correlation between the probability of enlistment implied by observables, and height, after conditioning on observables. The presence of such a correlation is how selection on unobservables is recognized, and precisely what is tested for by including  $\Omega ({\alpha _t} + {{{\bf{x'}}}_{it}}{\beta _k} + {{{\bf{z'}}}_{it}}{\delta _k})$ in Equation (4). The precise nature of the relationship of height with the enlistment probability identifies (in the statistical sense) Ω(·), enabling the determination of the magnitude of sample-selection bias.
Why are the exclusion restrictions required? That is, why is it necessary to include zit in the military enlistment decision, but not the height determination equation, or to allow β and δ to differ by cohort group? The example earlier showed that selection on unobservables creates a correlation between the probability of enlistment and height, after conditioning on observables. But if enlistment probability is a function only of observables affecting height, then there is no variation in this probability after conditioning on observables, and, thus, no correlation can be found. The exclusion restrictions provide variation in enlistment probability while conditioning on all observables affecting height. In other words, they create different enlistment probabilities for individuals whose height-determining covariates are the same, implying that their average heights should be the same if there is no selection on unobservables.
To be concrete, let zit represent (as it will later) political ideology. If ideology does not affect height, then all individuals with the same observables (other than ideology) should be of the same average height regardless of ideology. But negative selection on unobservables would cause individuals whose ideology renders them relatively likely to enlist to be observed to be taller than otherwise identical individuals whose ideology renders them relatively unlikely to enlist. As in the earlier example, individuals whose ideology renders them relatively unlikely to enlist do so only if they experienced a strong adverse health shock, whereas those whose ideology renders them relatively likely to enlist do so even without such shocks.
Permitting the effect of covariates on enlistment probability to differ by cohort group, but ruling out such a difference in the effect on height gives a similar advantage. Whenever the correlation of height with a covariate differs between cohort groups, this is evidence of selection on unobservables. For instance, if the conditional urban height penalty differs between cohort groups, this indicates the presence of sample-selection bias because Equation (1) permits no such variation; the only way that it could arise is if urban residence had a different impact on enlistment probability across the two cohort groups, and if this different enlistment probability led to different magnitudes of selection on unobservables.
In light of this intuition, it is instructive to consider how my model admits changing bias from selection on unobservables over birth cohorts. Because Ω(·) is a function of the same single index  ${\alpha _t} + {{{\bf{x'}}}_{it}}{\beta _k} + {{{\bf{z'}}}_{it}}{\delta _k}$ as is the conditional enlistment probability, selection changes whenever conditional enlistment probability changes. There are, therefore, three mechanisms by which selection can change over cohorts: changes in the distribution of xit and zit over cohorts, differences between cohorts in the cohort-specific intercept αt, and variation in βk and δk across cohort groups. As discussed earlier, only changes in enlistment probability generated by the exclusion restrictions are useful in identifying Ω(·) (in a statistical sense);Footnote 11 but any differences in enlistment probability over birth cohorts (generated by any of these three sources of variation) are translated into differences in sample-selection bias induced by selection on unobservables.Footnote 12
DATA SOURCES
I estimate my model with a combination of three types of data. Military records are the foremost source of height data in the United States. Census data enable the estimation of the binary choice model for military enlistment (Equation (3)) through the comparison of the characteristics of individuals observed in the military to those of the population at risk for enlistment. Finally, voting data are useful for identification.
Researchers estimating sample-selection models typically collect data on a random sample of the population. In this context, such a data set would enable me to observe xit, zit, and yit for the whole sample and hit for those with yit = 1. Estimation of the binary choice model (Equation (3)) would be carried out by comparing the distribution of covariates for enlisters (yit = 1) to that of non-enlisters (yit = 0). The construction of such a data set is not possible in this context. While it is possible to learn the distribution of covariates for enlisters through the linkage of military records and census data (as discussed later), the fact that only a fraction of the military records for the period have been digitized makes it impossible to definitively identify individuals who did not enlist, and, thus, to learn the distribution of covariates for this group. Nonetheless, Stephen R. Cosslett (Reference Cosslett, Manski and McFadden1981) has shown that my model can be estimated using a data set consisting of two types of samples that can be constructed using the available sources. The first is a choice-restricted sample of individuals located in military records. These individuals are known to have enlisted in the military, and census linkage provides information on their covariates.Footnote 13 The second is a supplementary sample of the population at risk for military enlistment, which uses census data to characterize the distribution of covariates in the whole population, but has no information on military enlistment status. Equation (3) is estimated by comparing the distribution of covariates in the choice-restricted sample to that of the supplementary sample; the only remaining information necessary for estimation is the fraction of the population joining the military, which is computed from external data (see Online Appendix D). Equation (4) is estimated using only the choice-restricted sample (and parameters estimated in Equation (3)).
Military Height Data
I collected military height data for the 1832–1860 birth cohorts from two sources that have previously been used to study the Antebellum Puzzle (e.g., Fogel Reference Fogel, Engerman and Gallman1986, Table 9.6). The first is the Union Army Project (Fogel et al. Reference Fogel, Costa and Haines2000), which provides information collected at the time of entry into the Union Army (during the Civil War). I collected data from this source for individuals born between 1832 and 1846, for whom height, birth year, and age at height measurement are known.Footnote 14 It is not possible to use the Union Army data to extend the height series past the birth cohort of 1846 because younger birth cohorts would have been too young to serve during the Civil War and the Union Army was disbanded after the war.Footnote 15 To extend the height series, I collected records of enlistments in the Regular U.S. Army for the birth cohorts of 1847–1860 from the Register of Enlistments. This source contains the records of enlistments occurring between 1798 and 1914, though the birth cohorts of 1847–1860 largely enlisted after the Civil War in the 1860s, 1870s, and 1880s. To make my results comparable to those of most other studies of military stature in the United States, I restrict attention to native-born whites and exclude individuals born in the West region of the United States (e.g., Fogel Reference Fogel, Engerman and Gallman1986; Zehetmayer Reference Zehetmayer2011).Footnote 16 I also exclude enlistments before age 18.Footnote 17
Understanding the distinction between the Union and Regular Armies is crucial. The Union Army was a special temporary force raised during the Civil War (1861–1865). It was a citizen’s army, comprising at some point of nearly half of the eligible population, and reaching a peak strength of about one million men (Weigley Reference Weigley1967, p. 267). Enlisters in the Union Army were drawn from all walks of life and were largely inspired to enlist by patriotism and wartime fervor (Weigley Reference Weigley1967). The Regular Army is the same professional U.S. Army that exists today. During the Civil War, enlistment in either the Regular or the Union Army was possible, but the vast majority of individuals serving during the war joined the Union Army.Footnote 18 Indeed, despite identical pecuniary incentives for enlistment, there was difficulty in maintaining the strength of the Regular Army during the Civil War. To my knowledge, no prior work exists on the composition of enlisters in the Regular Army during the Civil War (historians understandably focus on the Union Army). Between 1865 and 1898, all Army enlistment was in the Regular Army, which never exceeded a strength of 60,000 men (Department of Defense 1997, Table 2-11) and only included about 2 percent of the eligible population in the 1847–1860 cohorts. Enlisters in the postbellum Regular Army were generally drawn from lower social strata and enlisted largely due to a lack of civilian alternatives (Coffman Reference Coffman1986; Foner Reference Foner1970; Weigley Reference Weigley1967).
The revealed preference for service in the Union Army when enlistment was possible in both it and the Regular Army is evidence of substantial differences between the two forces. C. Joseph Bernardo and Eugene H. Bacon (1955, pp. 201–6) hypothesize that the Union Army was preferred because, as compared to the Regular Army, it had a shorter term of service, less rigorous discipline, and the freedom to elect officers. Conditions of service in the postbellum Regular Army were also poor in comparison to those experienced in the Union Army (Coffman Reference Coffman1986, pp. 328–9). Moreover, while volunteers in the Union Army were held in high esteem by the public, the Regular Army (outside of the war years) was more poorly perceived.
These differences underlie my decision to allow the effect of covariates on the military enlistment decision to differ between the 1832–1846 and the 1847–1860 cohort groups: the former group faced wartime patriotic motivations for enlistment and had the option to enlist in the Union Army; the younger cohorts only had the option to enlist in peacetime in the Regular Army. These differences also make concrete precisely the selection problems that concern Bodenhorn, Guinnane, and Mroz (Reference Bodenhorn, Guinnane and Mroz2017) and that this article addresses. This clear change in the incentive for military enlistment at the end of the Civil War makes it natural to suspect that the birth cohorts old enough to serve in the Civil War (the 1832–1846 cohorts) might have been differently selected than were those enlisting in the postbellum period (the 1847–1860 cohorts), even after conditioning on their observable characteristics. In particular, the worse conditions of service and contemporary reports (e.g., Coffman Reference Coffman1986, p. 329) of the poor labor market attributes of enlisters suggest that selection into military service may have become more negative after (as compared to during) the war.
Selection into military service may also have differed between birth cohorts within each of these cohort groups. With the enlistments in the Union Army taking place over a short period and attracting individuals from many different birth cohorts (and, thus, ages), it is possible that enlistment may have appealed differently to individuals of different ages. Similarly, postbellum enlistment in the Regular Army may have appealed differently to individuals in different birth cohorts depending on the state of the civilian labor market in their prime years (as Bodenhorn, Guinnane, and Mroz Reference Bodenhorn, Guinnane and Mroz2014 argue). Drawing a consistent trend in stature over time despite these changes is difficult. This is the heart of Bodenhorn, Guinnane, and Mroz’s (Reference Bodenhorn, Guinnane and Mroz2017) concern, and addressing it by permitting selectivity to differ is the contribution of the present article.
Census Data
Data on the covariates xit for military enlisters were collected through linkage of their military data with U.S. census records from their childhood and adolescence. Enlisters in the Union Army sample have already been linked to the U.S. Censuses of 1850 and 1860 by Fogel et al. (2000), but no previous linkage exists for the Regular Army enlisters whose information I extracted from the Register of Enlistments. I, therefore, linked the latter group to the U.S. Censuses of 1860–1880 (using the procedure in Online Appendix E.1) and transcribed census information for the linked individuals and their households. For both the Union Army and the Regular Army I retain only individuals for whom census information could be located. Except for height and age of height measurement, all data pertain to the individual or his household as observed in the census in which he was aged 9–18, or to his county of residence in that census.Footnote 19 Census linkage provided information on the property ownership of the enlister’s household, his place of residence, the size and composition of his household, the occupations of the members of his household, and his school attendance.
The use of census-linked data raises two concerns. One is that non-random failure to link enlisters to the census may introduce bias—that is, the linked data might not be representative of the military data as a whole. I study this possibility in Online Appendix E.2. Based on the fact that the trends in stature in the linked data and in the complete collection of military data are nearly identical, I conclude that my results are unlikely to be affected by selection into the linked sample.Footnote 20 Another concern stems from the fact that, unlike the Union Army data, which are hand-linked by genealogists, my linkage of the Regular Army data is automated. Martha Bailey et al. (Reference Bailey, Cole and Henderson2017) have recently shown that the rates of false links arising from automated linkage may be high.Footnote 21 To address this concern, I repeat my main analysis limiting the data to either hand matches (i.e., all of the Union Army data, where false positives are not a concern) or to exact automated matches, which are less likely to generate false positives. This exercise is discussed in Online Appendix G, where I show that limiting the sample in this way does not meaningfully affect the results.
The census-linked military data form the two choice-restricted samples—one for the 1832–1846 birth cohorts, generated by linking Union Army enlisters to the census, and one for the 1847–1860 birth cohorts, generated by linking the Regular Army enlisters to the census. For each of these two samples, a supplementary sample of the covariates of the population at risk for enlistment is required. To create such samples, I collected information on the covariates xit for a random sample of the population at risk for enlistment for the 1832–1860 birth cohorts from the public use samples of the 1850, 1860, and 1870 censuses (Ruggles et al. Reference Ruggles, Genadek and Goeken2015). I again restrict attention to native-born (outside of the West region) white males observed between ages 9 and 18. Dividing the random census sample along the same birth cohorts creates two supplementary samples.
For both the choice-restricted and supplementary samples I limit attention to individuals residing (at ages 9–18) in either non-seceding states or Virginia (i.e., I omit residents of Confederate states other than Virginia). I impose this restriction because residents of the excluded states are only rarely observed in Union Army, making it difficult to estimate their average heights. I impose the same restriction on the Regular Army data, which would have included individuals from these states, for comparability.
I also collected county-level data on agricultural production and population from Steven Manson et al. (Reference Manson, Schroeder and Van Riper2017).
Voting Data
The Civil War was fought over the issues of slavery and preservation of the Union. Similarly, after the Civil War, one of the Regular Army’s main duties was Reconstruction—the military occupation of the South. It is not hard to imagine that military service during these periods might have been attractive to those who had been opposed to slavery or supportive of preservation of the Union. Although it is not possible to observe political ideology, it is possible to observe a proxy—county-level voting patterns in the U.S. Presidential Election of 1860, which also centered on the issues of slavery and preservation of the Union. Thus, it is likely that these voting patterns are informative regarding the military enlistment decision.
Election data have previously been used to predict military enlistment and desertion in the mid-nineteenth-century United States. Dora L. Costa and Matthew E. Kahn (Reference Costa and Kahn2003) relate voting data from the elections of 1856 and 1860 to the probability of desertion from the Union Army, finding that enlisters from counties with greater support for Republican candidates were less likely to desert. Similarly, Costa and Kahn (Reference Costa and Kahn2007) use voting data from the 1864 election to measure a community’s support for the Civil War, finding that deserters from communities with greater support for the war were more likely to migrate after the war, and were more likely to settle in more anti-war communities, as measured by voting. The relevance to desertion suggests relevance to enlistment. Shari Eli, Laura Salisbury, and Allison Shertzer (Reference Eli, Salisbury and Shertzer2018) show that voting patterns in 1860 are predictive of the enlistment decisions of Kentuckians in the Civil War and of the subsequent migration of Civil War veterans.
Based on the likely impact of ideology, as measured by voting patterns, on military enlistment, I use county-level voting data for the Presidential Election of 1860 (ICPSR 1999) for identification of the sample-selection model (that is, to act as the excluded variable zit). In particular, I focus on the fraction of the individual’s county of residence (at the time that he is observed in the census between ages 9 and 18) voting for Abraham Lincoln in 1860. To be a valid exclusion restriction, this variable must satisfy two conditions. First, it must be related to military enlistment—that is, it must actually generate variation in the probability of enlistment. Given the earlier discussion, and the fact that Lincoln represented one extreme on the issue of slavery, it is plausible that voting patterns in this election should be related to military enlistment. The second requirement is that ideology (as proxied by voting) should be excludable from the determination of height; that is, conditional on all the observed covariates of height, voting patterns should be unrelated to height. Intuitively, the fact that I control for the available socioeconomic variables makes it likely that any factors that would cause voting and health to be correlated will be captured. Both relevance and excludability will be formally explored in the empirical analysis.
SUMMARY STATISTICS
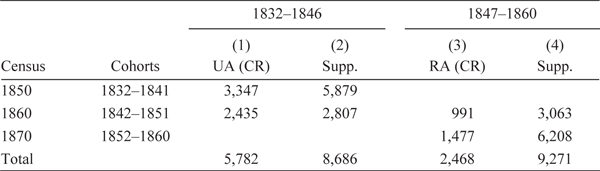
In Table 1, I summarize the structure of the sample, including information on the censuses from which each cohort’s data are drawn. Because I draw each individual’s census information from the census for which they are between ages 9 and 18 years old, individuals from the birth cohorts of 1832–1841 are observed in 1850, those from the birth cohorts of 1842–1851 are observed in 1860, and those from the cohorts of 1852–1860 are observed in 1870.Footnote 22 Columns (1) and (3) present information for the choice-restricted samples of military enlisters. In this table and throughout the article I use the shorthand “UA” to refer to the Union Army (1832–1846 cohorts) and “RA” to refer to the Regular Army (1847–1860 cohorts). Columns (2) and (4) present information for the supplementary random sample of census information from the population as a whole. I abbreviate Cosslett’s (Reference Cosslett, Manski and McFadden1981) two terms by using “CR” to refer to a choice-restricted sample and “Supp.” to refer to a supplementary sample.
DISTRIBUTION OF OBSERVATIONS BY CENSUS AND SAMPLE

Notes: Each cell reports the number of individuals in the sample indicated in the column header with data taken from the census indicated in the row. Samples are restricted to cover individuals with data on all individual-level variables. Abbreviations are as follows: UA is Union Army, RA is Regular Army, CR is choice-restricted sample, Supp. is supplementary sample.
Source: See text.
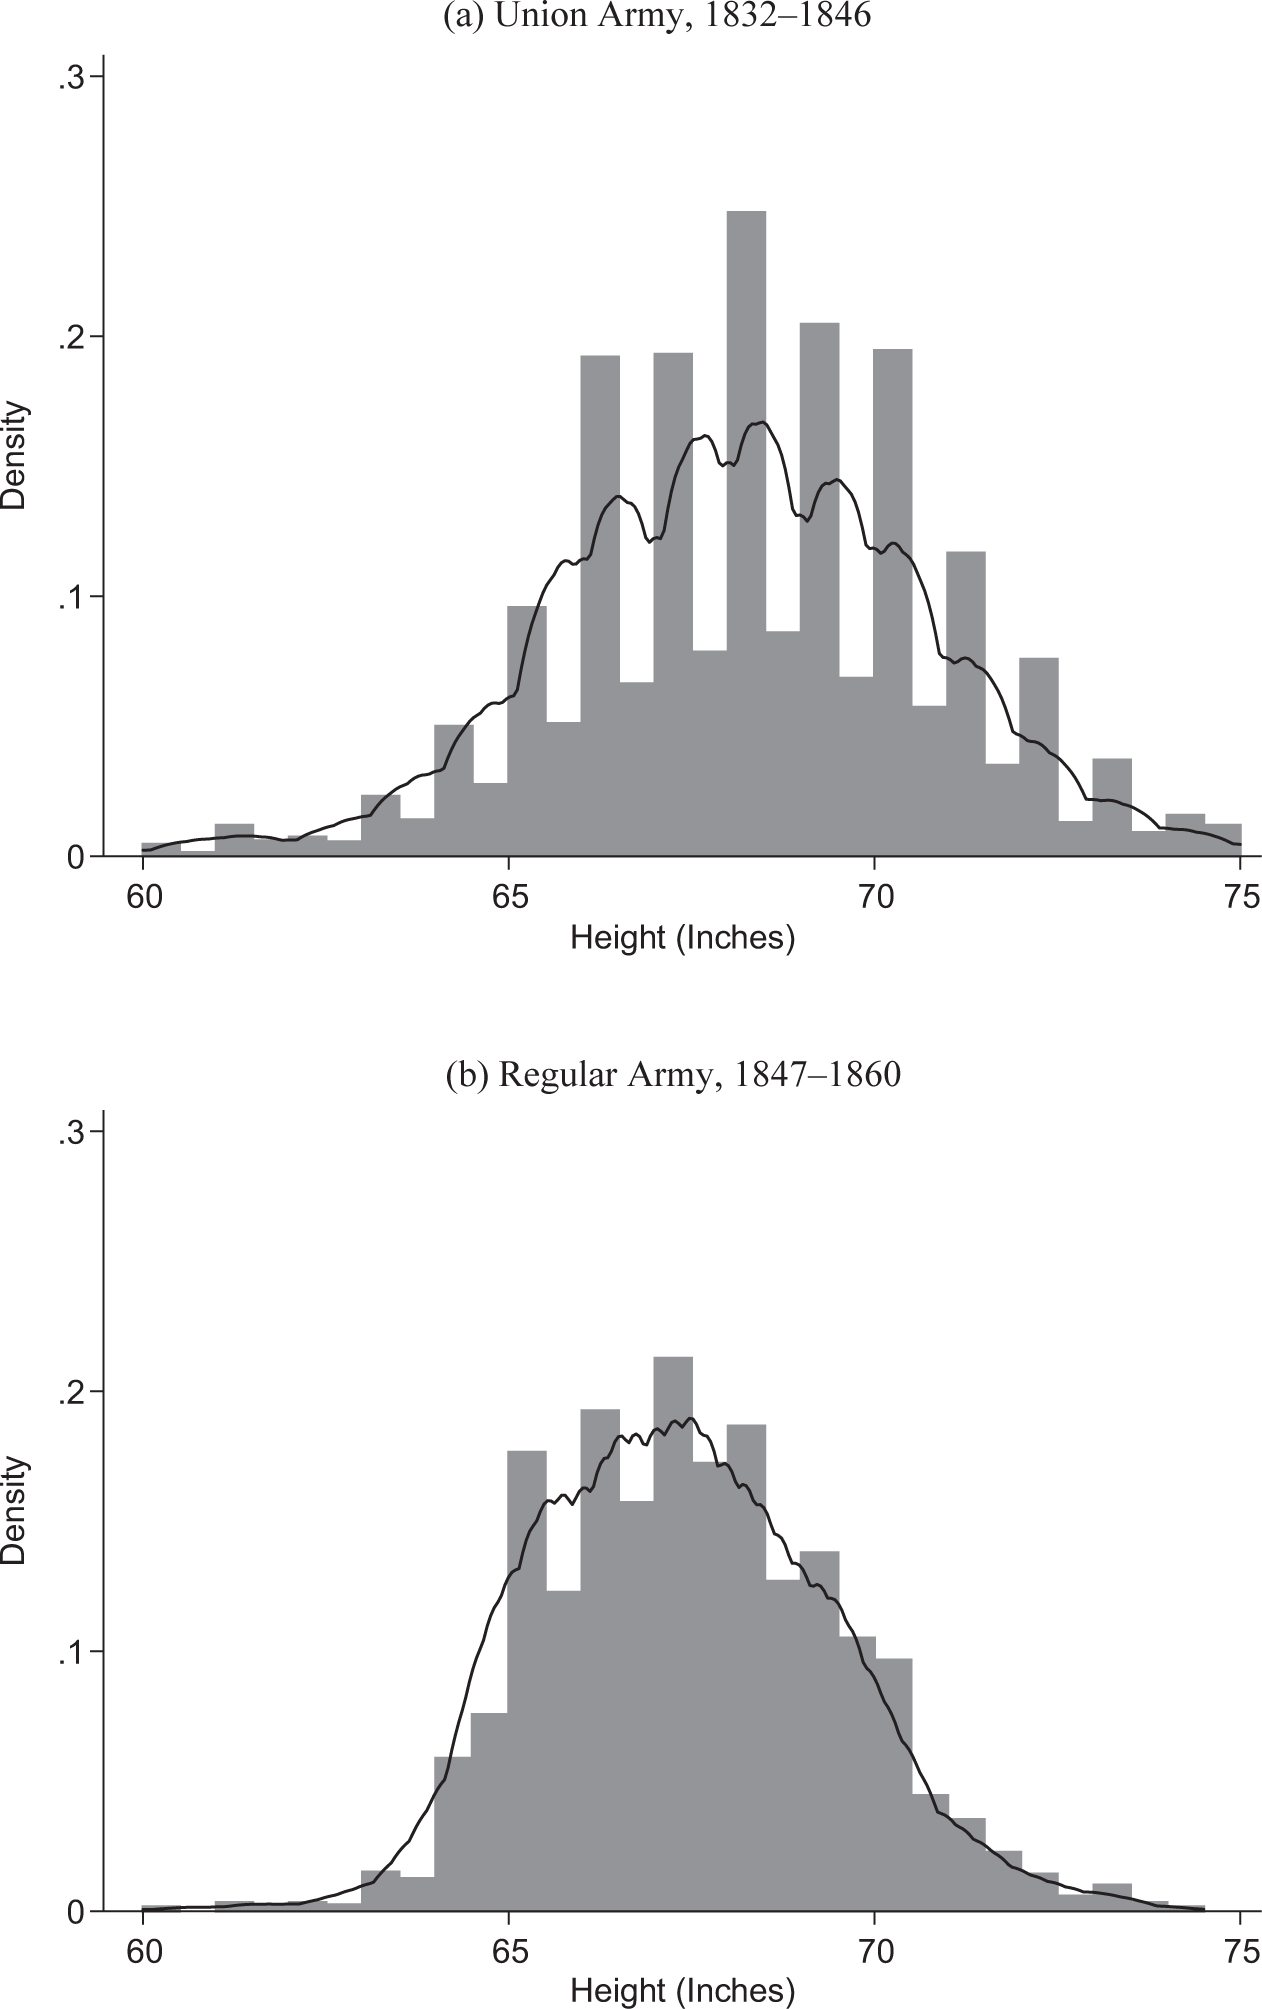
In Figure 1, I present the distributions of heights in each military sample. The Union Army enlisters were statistically significantly taller than the Regular Army enlisters by 0.816 inches. More stringent enforcement of the minimum height requirement of 64 inches in the Regular Army than in the Union Army is also clear.
HEIGHT DISTRIBUTIONS

I collected data from the census on the property ownership of each individual’s household (expressed in 1860 dollars, using deflators of Lindert and Margo (Reference Lindert, Margo, Carter, Gartner and Haines2006)), the composition of the household (including its size and whether the individual of interest, either the enlister or prospective enlister, was related to its head), the fraction of the household’s county living in an urban area, and whether the individual of interest attended school in the year prior to observation. The occupations of each member of the individual’s household were gathered and classified according to the system used by the Union Army Project (Fogel et al. Reference Fogel, Costa and Haines2000). The household is classified by the highest occupational status of any member; for example, if one member of the household is professional and the other is clerical, the household is categorized as professional. In addition, the birth region of the potential enlister is classified by region (Northeast, Midwest, and South). The sample is restricted to include only native-born whites, so individual nativity and race are not relevant.
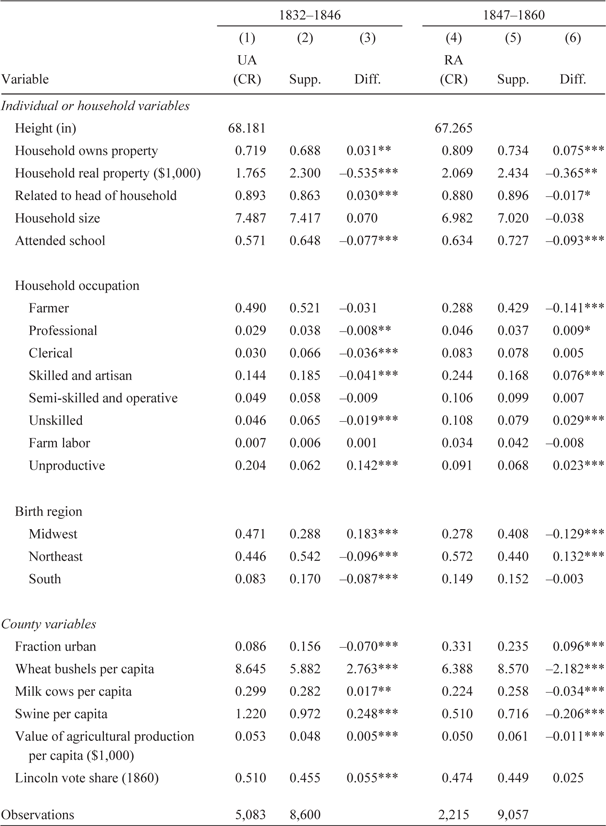
Table 2 summarizes some of the individual- and household-level data taken from the census for each of the choice-restricted and supplementary samples, together with the voting data. Columns (1) and (4) present information for the choice-restricted samples of military enlisters. Columns (2) and (5) present information for the supplementary random samples of census information from the population as a whole. Columns (3) and (6) present -tests of the difference between the supplementary and the choice-restricted samples for each of the military enlistment samples. Nearly all of the t-tests for the differences between the enlisters and the general population indicate statistically significant differences between enlisters and the general population at the 1-percent level, and these differences are largely consistent with expectations. For instance, urban areas are over-represented in the Regular Army, as contemporary reports suggest that they should be, and under-represented in the Union Army. These differences also extend to the voting data with both military samples drawn disproportionately from Lincoln-supporting areas (though the difference in the Regular Army is not statistically significant).Footnote 23
SUMMARY STATISTICS

Significance levels: ***p < 0.01, **p < 0.05, *p < 0.1
Notes: All individual or household variables are binary unless indicated otherwise. Averages for the choice-restricted samples are weighted to correct for selection into linkage on the basis of observable characteristics. Standard deviations and standard errors are omitted for clarity. Sample sizes are the minimum of the column with observations for all variables. Abbreviations are as follows: UA is Union Army, RA is Regular Army, CR is a choice-restricted sample, and Supp. is a supplementary sample, Diff. is a difference.
Source: See text.
ESTIMATION
The estimation of the trend in stature, incorporating the correction for selection on observables and unobservables, proceeds as follows. Steps 1 and 2 are essentially the two-step James J. Heckman (Reference Heckman1979) procedure. Step 3 computes the unconditional trend, which is smoothed in Step 4.
1. Equation (3) is estimated semi-parametrically. The structure of the sample requires that I use an adapted Roger W. Klein and Richard H. Spady (Reference Klein and Spady1993) estimator, described in Online Appendix F. This yields estimates of the conditional enlistment probability
 ${\hat G({{\hat \alpha }_t} + {{{\bf{x'}}}_{it}}{{\hat \beta }_k} + {{{\bf{z'}}}_{it}}{{\hat \delta }_k})}$ and of its linear index ${{{\hat \alpha }_t} + {{{\bf{x'}}}_{it}}{{\hat \beta }_k} + {{{\bf{z'}}}_{it}}{{\hat \delta }_k}}$.
2. Equation (4) is estimated on the choice-restricted sample using Whitney K. Newey’s (Reference Newey2009) method. To take into account the possibility that individuals in their late teens or early 20s might not yet have reached terminal height (Frisancho Reference Frisancho1993), I add to Equation (4) a vector of measurement-age indicators mit with coefficients π to normalize heights to age 21. Estimation of Equation (4) is weighted to account for the separate sampling of the two groups of birth cohorts. This yields an estimate
$E({h_{it}}|{{\bf{x}}_{it}};t) = {\hat \gamma _t} + {{{\bf{x'}}}_{it}}\hat \theta $ and of the selection bias, ${\hat \Omega ({{\hat \alpha }_t} + {{{\bf{x'}}}_{it}}{{\hat \beta }_k} + {{{\bf{z'}}}_{it}}{{\hat \delta }_k})}$.Footnote 243. I estimate the selection-corrected average stature for cohort t by computing
(5)This is accomplished by a regression of the selection- and measurement age-corrected height,$${\hat h_t} = {{{{\hat k}_t}} \over {{N_t}}}\sum\limits_{i \in t} {{{{h_{it}} - {{{\bf{m'}}}_{it}}\hat \pi - \hat \Omega ({{\hat \alpha }_t} + {{{\bf{x'}}}_{it}}{{\hat \beta }_k} + {{{\bf{z'}}}_{it}}{{\hat \delta }_k}) + \hat \mu } \over {\hat G({{\hat \alpha }_t} + {{{\bf{x'}}}_{it}}{{\hat \beta }_k} + {{{\bf{z'}}}_{it}}{{\hat \delta }_k})}}.} $$
${{h_{it}} - {{{\bf{m'}}}_{it}}\hat \pi - \hat \Omega ({{\hat \alpha }_t} + {{{\bf{x'}}}_{it}}{{\hat \beta }_k} + {{{\bf{z'}}}_{it}}{{\hat \delta }_k}) + \hat \mu }$, for each member of the choice-restricted sample on birth-cohort indicators, weighting by inverse enlistment probability (i.e., by ${\hat G{{({{\hat \alpha }_t} + {{{\bf{x'}}}_{it}}{{\hat \beta }_k} + {{{\bf{z'}}}_{it}}{{\hat \delta }_k})}^{ - 1}}}$).Footnote 254. I smooth the estimated average stature for each cohort using a kernel regression of
${{{\hat h}_t}}$ on birth year.Footnote 26


For Steps 1 and 2 standard errors can be computed analytically. For Steps 3 and 4, bootstrapping is required.
To determine whether incorporating the correction for selection on unobservables affects results, I must estimate a trend in heights for comparison that does not adjust for selection on unobservables. To do so, I replace Step 3 with estimation of a truncated regression of height on birth cohort indicators and measurement indicators with a truncation point of 64 inches (A’Hearn Reference A’Hearn, Komlos and Baten1998; Komlos Reference Komlos, Komlos and Baten1998), weighting by inverse enlistment probability. This approach matches the literature standard of correcting for truncation and for selection on observables, but not for selection on unobservables. I do not use a truncated regression in the main estimation procedure (to adjust for selection on both observables and unobservables) because the correction for selection on unobservables should also address truncation, which is a special case of positive selection on unobservables. In this case the binary choice model for military enlistment represents the compound event in which an individual meets the height requirement and chooses to join the military.Footnote 27
RESULTS
Selection into Military Service
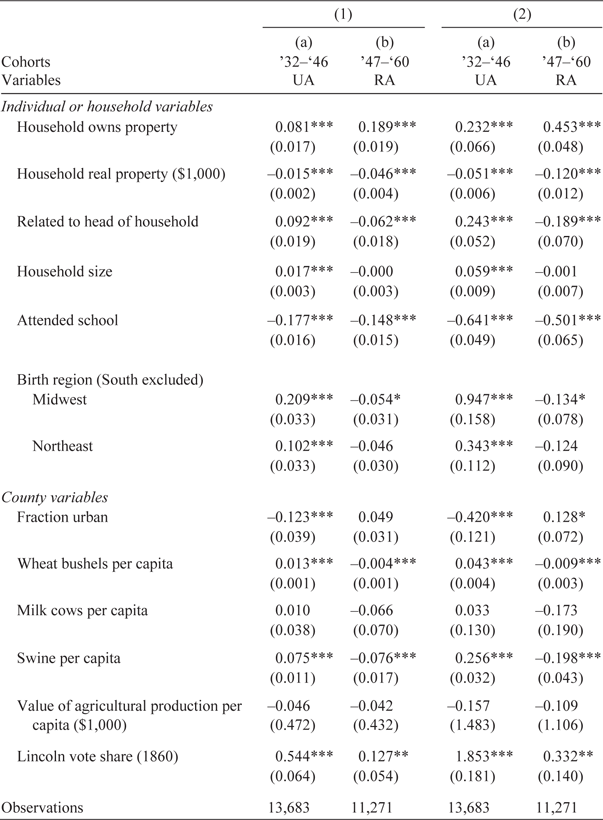
The results of estimation of the binary choice model in Equation (3) for military enlistment are presented in Column (1) of Table 3, with βk and δk presented in separate sub-columns for each cohort group k ϵ {1832 – 1846, 1847 – 1860}.Footnote 28 With the goal of correcting for sample-selection bias, two particular aspects of the results of Column (1) of Table 3 are important. The first is the relevance of the vote share variables to the enlistment decision. In both cohort groups, the vote share for Lincoln in the county of residence enters with a statistically significant coefficient, indicating that ideology, as proxied by voting, was indeed relevant to military enlistment. The second aspect of interest in Table 3 is that a test of equality of the coefficients between cohort groups rejects the null hypothesis of equality at all levels of significance, indicating that the military enlistment did indeed vary by cohort group.
BINARY CHOICE MODEL ESTIMATION

Significance levels: ***p < 0.01, **p < 0.05, *p < 0.1
Notes: Column (1) presents estimates of the coefficients β and δ from the binary choice model. Column (2) presents the average semi-elasticity of the impact of each variable on enlistment probability as implied by the estimates of Column (1). All specifications include cohort indicators and household occupational indicators. Standard errors are clustered at the county level. UA denotes Union Army. RA denotes Regular Army.
Source: See text.
Although the coefficients themselves are important in demonstrating the relevance of the exclusion restrictions (because they generate the needed variation in the single index), they are not straightforward to interpret. I, therefore, present in Column (2) of Table 3, the average semi-elasticities associated with the estimates of Column (1).Footnote 29 The semi-elasticity of the vote share variable indicates that it has an economically significant effect of the expected sign on the enlistment decision. The semi-elasticity of 1.853 for the 1832–1846 cohorts implies that a one-standard deviation increase in the vote share for Lincoln (approximately 23 percentage points) is associated with a roughly 43 percent increase in the probability of enlistment (e.g., a change of enlistment probability from a mean of 0.45 to about 0.69) in the Union Army. In the 1847–1860 cohorts, the semi-elasticity of 0.332 implies that the same change in Lincoln’s vote share is associated with an approximately 7.6 percent increase in enlistment probability in the Regular Army (e.g., a change in enlistment probability from a mean of 2.2 percent to about 2.4 percent). Other semi-elasticities largely reflect the differences between enlisters and the whole population in the summary statistics (Table 2). For instance, school attendance is associated with a lower enlistment probability, as is the value of real property holdings. The fraction of the county of residence that is urban is associated with a higher enlistment probability for the Regular Army (consistent with reports that recruitment efforts were largely concentrated in urban areas), such that an individual from a fully urban county was about 13 percent more likely to enlist than an individual from a fully rural county. Conversely, the fraction of a potential enlister’s county of residence that was urban was associated with a lower probability of enlistment in the Union Army.
Selection-Corrected Height Regressions
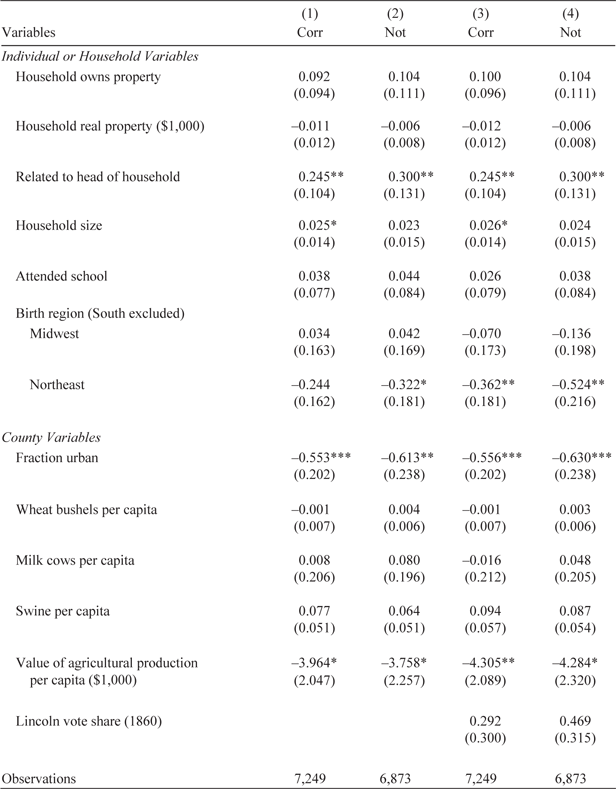
The next step is to estimate Equation (4), the second-stage selection-adjusted height regression. The results of this estimation are presented in Column (1) of Table 4, alongside its unadjusted analog in Column (2).Footnote 30 The results of the selection-adjusted regression of Column (1) are similar to those of the unadjusted regression of Column (2), though there are some exceptions. For example, the Northeast’s conditional height disadvantage relative to the South decreases after the correction and becomes statistically insignificant. The conditional relationship between height and the fraction of the county’s population that is urban is also smaller, though it remains strongly significant. The general similarity of the corrected and uncorrected coefficients would seem to indicate that the selection correction is not impactful, but it should be noted that this table does not present the cohort-specific intercepts γt, which (as the analysis later will reveal) are affected.
HEIGHT REGRESSIONS

Significance levels: ***p < 0.01, **p < 0.05, *p < 0.1
Notes: Standard errors in parentheses. Dependent variable is height, measured in inches. All specifications include age-of-measurement, year-of-birth, and household occupational indicators. The selection-corrected specifications, indicated by the column header Corr, also include the selection-correction function Ω(·). The uncorrected specifications, indicated by the column header Not, correct for truncation with a truncation point of 64 inches. Standard errors are clustered at the county level. The difference in sample sizes between the columns is the results of the need to drop height below 64 inches in the truncation-corrected regressions when not correcting for sample-selection bias.
Source: See text.
It is also possible to provide a direct test of the excludability of the vote share for Lincoln. This variable must satisfy two conditions to be used as an exclusion restriction for identification. The first is that it must be relevant to the enlistment decision. This was established in Table 3, in which it was shown that the vote share enters significantly into the enlistment Equation (3). The second is that it is excludable from the height equation. That is, omitting the vote share from a regression of height on the covariates xit in an unselected sample must not lead to omitted variables bias. Because allowing the coefficients of the binary choice model to differ by cohort group is sufficient for identification on its own, it is possible to include the vote share in the second stage to obtain selection-corrected estimates of its relationship with height, thus, capitalizing on the over-identification of the model to directly test this assumption. Although this approach has validity as the null and assumes that it is appropriate not to include interactions in the second stage, it is informative to consider the results. Column (3) of Table 4 presents the result of this exercise, while Column (4) presents the uncorrected analog. The first item to note is that the relationship of the vote share with height is not statistically significant in Column (3). Moreover, the magnitude of the coefficient is small. Its interpretation is that a one standard deviation increase in the vote share for Lincoln (about 23 percentage points) is associated with a 0.07 inch (or less than 0.035 standard deviation) increase in stature. This result contrasts with the uncorrected regression of Column (4), which shows a larger, but still statistically insignificant coefficient for Lincoln’s vote share. This supports the excludability of the vote share.
Adjusted Trends in Height
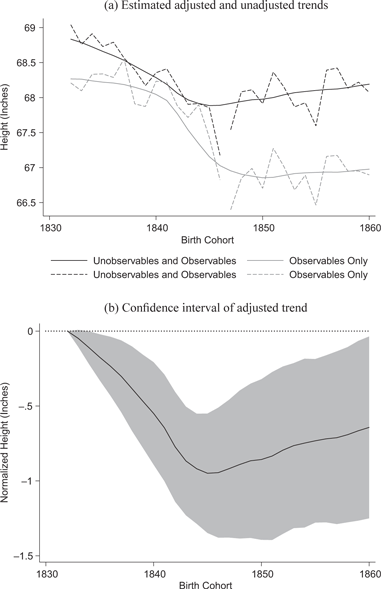
I present the results of incorporating the correction for selection on both observables and unobservables in Figure 2.Footnote 31 Panel 2(a) presents the smoothed and unsmoothed trends in average stature, either incorporating the correction for selection on both observables and unobservables (“Observables and Unobservables”) or adjusting only for truncation and for selection on observables (“Observables Only”). The unsmoothed trends for the 1832–1846 cohorts are based on the Union Army height data, while the unsmoothed trends for 1847–1860 are based on the Regular Army data. For comparability to the existing literature, my main focus is on the smoothed trends. The trend adjusting only for selection on observables represents the current methods of the historical heights literature and shows a decline in average stature from 68.27 inches to 66.98 inches. The trend incorporating the correction for selection on both observables and unobservables is the contribution of this article. This shows a decline in average stature from 68.83 inches to 68.19 inches. A 95 percent confidence interval for the decline in average height implied by the smoothed trend incorporating the correction for selection on both observables and unobservables is presented in Panel 2(b).
TRENDS IN AVERAGE STATURE

Two key insights can be drawn from Figure 2. The first is that my estimated trend incorporating the correction for selection on both observables and unobservables exhibits an Antebellum Puzzle. In the birth cohorts of 1832–1846, the estimated decline in average stature after adjusting for selection on both observables and unobservables and smoothing is 0.94 inches and is statistically different from zero  $(\chi _1^2 = 61.66,{\rm{ }}p \lt 0.01)$. Moreover, the estimated smoothed and adjusted decline in average stature over the birth cohorts of 1832–1860 (i.e., the whole study period) is 0.64 inches and is statistically different from zero
 $(\chi _1^2 = 4.43,{\rm{ }}p = 0.04)$. I, therefore, conclude that the data do not support the view that the decline in average stature of the Antebellum Puzzle is an artifact of sample-selection bias. Of course, even if I had not found evidence of a decline in average heights, that would not constitute sufficient evidence to conclude that the Antebellum Puzzle was resolved. In this case, it would still be necessary to explain why stature did not increase in the presence of rapid economic growth. To resolve the puzzle based on selection alone, the trend incorporating the correction for selection on unobservables would have to show an increase in average stature.
The second key insight, evident in Panel 2(a), is that incorporating the correction for selection on unobservables yields an estimated trend in average stature that is meaningfully different from the trend estimated according to the current literature’s techniques (i.e., adjusting only for truncation and selection on observables).Footnote 32 In particular, when adjusting only for selection on observables, a decline of about 1.24 inches in the birth cohorts of 1832–1846 is evident in the smoothed trend, along with a net decline of about 1.29 inches in the birth cohorts of 1832–1860. Both of these estimates are larger than those reached when incorporating the correction for selection on unobservables (0.94 and 0.64 inches, respectively), although only the decline in average heights for the birth cohorts of 1832–1860 is statistically different between the two curves in Panel 2(a)  $(\chi _1^2 = 5.50,{\rm{ }}p = 0.02)$. Thus, the general argument, that failing to properly account for sample-selection bias may lead to biased estimates of the trends in height over birth cohorts, is supported. Indeed, the difference between the two curves in Panel 2(a) indicates that addressing selection on unobservables reduces by about half the estimated decline in average stature for the birth cohorts of 1832–1860.
Panel 2(a) further indicates that the difference between the estimated trends in stature is largely the product of distinctly different levels of sample-selection bias between the Union and the Regular Armies, and, thus, between the two portions of the sample.Footnote 33 This is supported in part by the fact that the decline in average stature for the birth cohorts 1832–1846 is not statistically different between the two smoothed trends  $(\chi _1^2 = 2.00,{\rm{ }}p = 0.16)$, whereas there is a statistically significant difference between the decline in average stature for the birth cohorts of 1832–1860, as discussed earlier. It is also evident in the fact that in the unsmoothed trends of Panel 2(a), the shift from the Union Army (1832–1846 cohorts) to the Regular Army (1847–1860 cohorts) entails a smaller fall in average stature after incorporating the correction for selection on unobservables.Footnote 34 The confounding effects of sample-selection bias, thus, arise when the two very differently selected samples are placed side by side and used to construct a trend.
When the rates of enlistment in each sample group are considered, this result is not surprising. The basic logic of selection models implies that the magnitude of sample-selection bias is decreasing in the fraction of the population that is represented in the selected sample. It is, thus, not surprising that the transition from the Union Army with its high rate of enlistment to the Regular Army with its lower rate of enlistment would distort the true trend in height to show a greater decline. This result also fits well with the historical accounts that indicate that the postbellum Regular Army was likely to be composed of more negatively selected enlisters than the Union Army.
Cross-Sectional Patterns
Historical anthropometric studies of the United States suggest that the Northeast was the region with the shortest average stature in the antebellum period (e.g., Komlos Reference Komlos2012, p. 444). Whether this height disadvantage should be considered a cross-sectional analog of the temporal Antebellum Puzzle is debatable. On the one hand, Richard Easterlin (Reference Easterlin1960) has shown that income per capita in the Midwest was only 51 percent of that of the Northeast in 1840, implying that there was a cross-sectional Antebellum Puzzle because the better economic well-being in the Northeast did not translate into better health. On the other hand, Robert A. Margo (Reference Margo1999) has shown that real wages were higher in the Midwest than in the Northeast in the antebellum period, seemingly rationalizing the observed patterns in stature. Moreover, greater rates of urbanization and industrialization in the Northeast than in the Midwest can help to explain the Northeast’s height penalty.
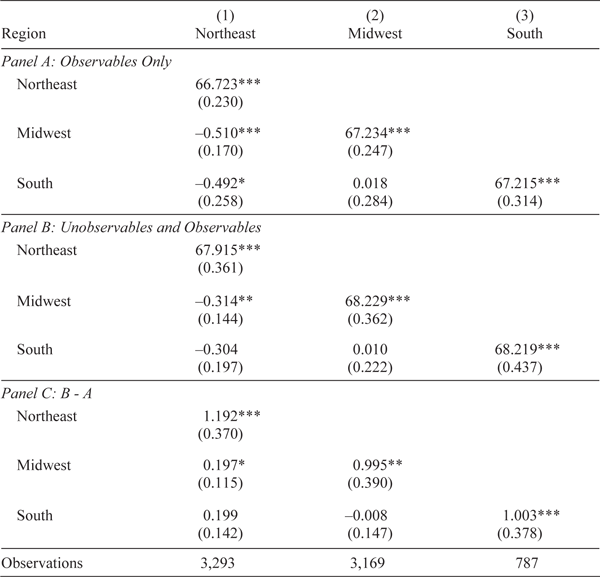
Regardless of whether the Northeast’s height penalty can be rationalized by its relative prosperity, another possibility is that it has been estimated incorrectly as a result of selection on unobservables that differs between regions. To determine whether sample-selection bias is responsible for the Northeast’s height penalty I repeat the estimation noted earlier, averaging over regions (rather than cohorts) of birth. Results are presented in Table 5. Panel A shows the mean heights per region, adjusting for truncation and selection on observables only. The Northeast’s height penalty is evident, with Northeasterners 0.51 inches shorter than Midwesterners. Panel B also incorporates the correction for selection on unobservables. The difference between the Northeast and the Midwest is smaller after this adjustment but is still present and statistically significant at 0.31 inches. Thus, sample-selection bias cannot wholly explain the Northeast’s height disadvantage. But the researcher cannot disregard sample-selection bias, even in cross-sectional comparisons: as shown in Panel C, the difference in heights between Northeasterners and Midwesterners becomes smaller (although the change is only marginally statistically significant), decreasing the difference between the regions by roughly 48.5 percent.
TESTS FOR DIFFERENCES IN LEVELS, REGIONAL DECOMPOSITION

Significance levels: ***p < 0.01, **p < 0.05, *p < 0.1
Notes: In Panels A and B, the diagonals present the estimated mean heights in each region, corrected for minimum height requirements with a truncation point of 64 inches, for the type of selection in the panel title, for measurement age, and for the separate sampling of the two groups of birth cohorts. The off-diagonals present the differences between the diagonal elements. Panel C presents differences between Panels A and B. In all cases, bootstrap standard errors clustered at the county level are in parentheses. Observation numbers are for the region in the column header for the estimates of Panel B.
Source: See text.
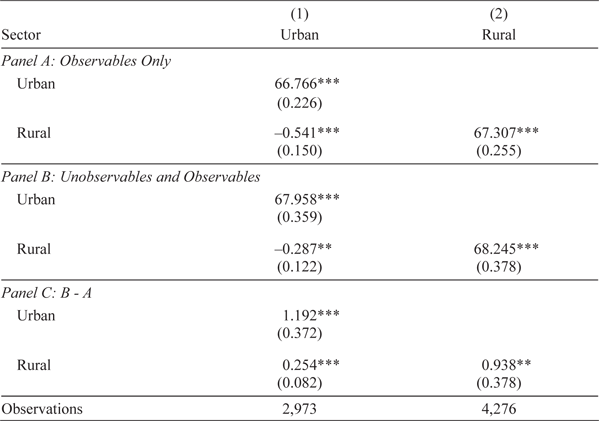
A similar analysis is possible to investigate the urban height penalty—a robust finding that residents of urban areas were shorter than residents of rural areas. This penalty is usually attributed to the separation from food sources and poor sanitary conditions in cities. I define an urban county as one with any urban population (i.e., population living in places of at least 2,500 inhabitants) and a rural county as one with no urban population.Footnote 35 Averaging heights over sector makes it possible to determine to what extent the urban penalty is the result of sample-selection bias that differs by sector. The results of this procedure are presented in Table 6, in which an urban height penalty of 0.54 inches is present when adjusting for truncation and selection on observables (Panel A) and remains present and statistically significant at 0.29 inches when incorporating the correction for selection on unobservables (Panel B). Panel C shows a similar pattern to the regional case: addressing selection on unobservables statistically significantly and meaningfully changes the magnitude of the urban penalty, reducing it by 63.4 percent.
TESTS FOR DIFFERENCES IN LEVELS, SECTORAL DECOMPOSITION

Significance levels: ***p < 0.01, **p < 0.05, *p < 0.1
Notes: In Panels A and B, the diagonals present the estimated mean heights in each sector, corrected for minimum height requirements with a truncation point of 64 inches, for the type of selection in the panel title, for measurement age, and for the separate sampling of the two groups of birth cohorts. The off-diagonals present the differences between the diagonal elements. Panel C presents differences between Panels A and B. In all cases, bootstrap standard errors clustered at the county level are in parentheses. The urban sector is defined as a county with a non-zero urban population. Observation numbers are for the region in the column header for the estimates of Panel B.
Source: See text.
CONCLUSION
The Antebellum Puzzle is a major stylized fact of U.S. economic history. Its surprising implication that living standards in the United States were not unambiguously improved by early modern economic growth has changed economists’ understanding of economic development and led to a 40-year effort to document and explain the response of the human body to modern economic growth. This historical puzzle also has modern relevance. Angus Deaton (Reference Deaton2007) and Seema Jayachandran and Rohini Pande (Reference Jayachandran and Pande2017) report that economic growth in India has not been matched by improvements in height. They also report cross-sectional relationships in height that contradict monetary measures of welfare, with Africa poorer, but taller than India. Similarly, Anjani Trivedi (Reference Trivedi2017) discusses a decline in life expectancy in China during the rapid growth of the 2000s. Thus, deteriorating health may be a symptom of the early stages of rapid economic growth.
It is possible, however, that studies of historical heights have not sufficiently addressed sample-selection bias, which has the potential to undermine the veracity of the Antebellum Puzzle and of its analogs in countries other than the United States. In this article, I address the suggestive evidence from existing studies (Bodenhorn, Guinnane, and Mroz Reference Bodenhorn, Guinnane and Mroz2017; Komlos and A’Hearn Reference Komlos and A’Hearn2016) with the first direct test of whether the Antebellum Puzzle is an artifact of sample-selection bias and ask whether failing to properly address such bias has affected conclusions drawn from historical height data. Based on the estimation of a two-step semi-parametric sample-selection model on a set of military-linked census data from the birth cohorts of 1832–1860 in the United States, I find that the trend in stature adjusted for sample-selection bias from selection on observables and on unobservables differs considerably from the baseline results in the literature and from the trend that I compute using standard techniques of the literature. The difference stems primarily from large changes in the degree of sample-selection bias across different sources of data. This result supports the argument that sample selection might have biased the conclusions of the anthropometric history literature. It also bolsters the general argument that future studies of historical heights must be cautious regarding the threat posed by sample-selection bias wherever it is likely to exist.
At the same time, I show that it is possible to learn from the selected sample without ignoring its potential pitfalls. I find evidence of an Antebellum Puzzle even after incorporating corrections for sample-selection bias, and, thus, conclude that the view that the Antebellum Puzzle is merely an artifact of sample-selection bias is not supported by the data. Moreover, there is no evidence of an increase in average stature, which would be necessary to resolve the puzzle by selection alone. The continuing effort to understand the causes of the Antebellum Puzzle must, therefore, focus on real explanations linking economic growth to health.
It should be noted that, precisely because I am studying the impacts of selection on unobservables, it is not possible to determine, by direct observation, whether I have purged the data of all of the bias induced by this kind of selection. The only way to be completely certain would be to use a sample of height data spanning this period in which selection on unobservables could be definitively ruled out.Footnote 36 Instead, I must rely on economic and statistical theory to indirectly infer the impact of selection on unobservables from the available data. Although I have employed the best available tools to address the possible presence of such selection and have found that the evidence does not support the assertion that the Antebellum Puzzle is a statistical artifact, it is not possible to be completely certain that this was not the case. Moreover, whereas Bodenhorn, Guinnane, and Mroz’s (Reference Bodenhorn, Guinnane and Mroz2017) critique applies to the entirety of the anthropometric history literature and the more general finding of the Industrialization Puzzle, my assessment of its applicability is limited to the U.S. Antebellum Puzzle. In settings where mass mobilizations such as that of the Civil War are not available to provide data, selection on unobservables may exert a greater influence.
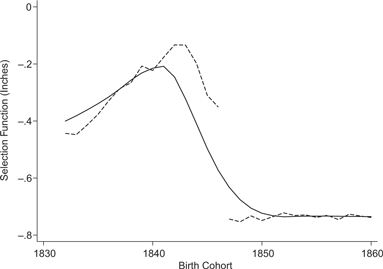
Appendix: Estimated Ω(·) Function by Birth Cohort
ESTIMATED Ω(·) FUNCTION BY BIRTH COHORT