
I. INTRODUCTION
It is well known that the composition of shape memory alloys (SMA) strongly influences the martensitic transformation temperatures (A s, A f, M s, M f) as well as the hysteresis related with the phase transition. Reference Otsuka and Ren1–Reference Mazzer, Kiminami, Bolfarini, Cava, Botta and Gargarella4 Thus, the introduction of alloying elements can be used to modify the transformation temperatures. In NiTi alloys, the temperature standard range for the transition temperature is normally around 40–70 °C, however it is possible to decrease M s to −100 °C for the Ni43Ti50Co7 (at.%) composition Reference Otsuka and Ren5 and increase it to 290 °C for the Ni50Ti30Hf20 (at.%) composition. Reference Zarinejad and Liu6 The mechanism that affects the temperature changing is not clearly explained due to its complexity and to the many factors involved such as grain sizes, precipitation, presence of other phases, texture, etc. Zarinjad and Liu Reference Zarinejad and Liu6,Reference Zarinejad, Liu and Chen7 have proposed that this mechanism is substantially related with the valence electron concentration of the alloy. They claimed that the valence electrons act as a glue that keeps the other electrons and the kernel cohesive, generating the metallic bonds. Reference Callister8 Therefore, the electronic configuration of the alloy will influence its physical properties.
The valence electron concentration in relation with the total number of electrons in the alloy, labeled as c v, is the main parameter used to measure the influence of the valence electrons in the transformation of martensitic phases. This value is obtained by dividing the valence electron of the atom (e v) by the total number of electrons. In the case of an alloy, the expressions for these values are shown in Eqs. (1) and (2), which represent a weighted average of the valence electrons concerning the atomic fraction of each element in the alloy.
 $${{{e_{\rm{v}}}} \over {{\rm{atom}}}} = {f_{m1}}e_{\rm{v}}^{m1} + {f_{m2}}e_{\rm{v}}^{m2} + {f_{m3}}e_{\rm{v}}^{m3} + {f_{m4}}e_{\rm{v}}^{m4} + \cdots + {f_n}e_{\rm{v}}^n\quad ,$$
 $${c_{\rm{v}}} = {{{e_{\rm{v}}}} \over {{e_{\rm{t}}}}} = {{{e_{\rm{v}}}} \over {{f_{m1}}{Z^{m1}} + {f_{m2}}{Z^{m2}} + {f_{m3}}{Z^{m3}} + {f_{m4}}{Z^{m4}} + \cdots + {f_n}{Z^n}}}\quad ,$$
where f is the atomic fraction of the alloy element,
 $e_{\rm{v}}^m$
is the amount of valence electron for the metal m, Z is the atomic number, and e
t is the total number of electrons for the alloy.
One reasonable explanation for the valence electron influence lies on the fact that a larger valence electron layer makes the atomic bonds stronger. Thus, there is one well-known relationship between c
v and elastic deformation. Therefore, there must be a relation between c
v and the shear and volume modulus of the material, and both are related with the elastic modulus of the alloy. The larger the c
v is, the larger these modulus are.
Reference Zarinejad and Liu6,Reference Zarinejad, Liu and Chen7,Reference Frenzel, George, Dlouhy, Somsen, Wagner and Eggeler9
The mechanism that describes how c
v and the modulus influence in the martensitic transformation temperatures for Cu- and NiTi-based SMA were described in details by Ren and Otsuka.
Reference Otsuka and Ren5,Reference Ren and Otsuka10
The authors related the strong dependence of the initial martensitic transformation temperature (M
s) with the required shear for the phase transformation to occur. The explanation lies on the fact that when the material is cooled from the austenitic field, the elastic constant c′ in the basal planes decreases. When c′ reaches the critical value
 ${c'_{{\rm{crit}}}}$
, the transformation from austenite to martensite occurs. This critical value is not dependent on the composition for a particular system, however c′ is dependent on the composition. As a consequence, in alloys with higher elastic modulus (higher c′), M
s will shift to lower temperatures because the temperature should decrease even more to allow the elastic constant reach the critical value.
Reference Frenzel, George, Dlouhy, Somsen, Wagner and Eggeler9–Reference Ren, Miura, Zhang, Otsuka, Tanaka, Koiwa, Suzuki, Chumlyakov and Asai11
Thus, alloying elements that make c v decrease or increase will force M s to increase or decrease, respectively. Zarinejad and Liu Reference Zarinejad and Liu6,Reference Zarinejad, Liu and Chen7 have shown that the relationship between M s and c v for NiTi alloy is almost linear.
In addition to c
v, another parameter that takes into account the strength of the metallic bonds is the valence electron density (VED) in relation with the volume of the unit cell. VED values are directly related to c
v. It is known in the literature that the larger VED is, the larger the volume and shear modulus are.
Reference Gilman12
The relationships between the VED and the elastic modulus are already known for metallic materials. It is known that higher VED results in higher bulk and, therefore, shear modulus (which is usually approximated by 3/5 of bulk modulus in metals and alloys) of the alloy. Thus, the higher the VED, the higher is the elastic modulus.
Reference Ren, Miura, Zhang, Otsuka, Tanaka, Koiwa, Suzuki, Chumlyakov and Asai11–Reference Gilman, Cumberland and Kaner13
Experimental results in Ref. Reference Gilman, Cumberland and Kaner13 have shown a linear relationship between the VED and the bulk modulus of some elements. The softening of the elastic constants was shown experimentally in several thermoelastic martensitic studies.
Reference Otsuka and Ren5,Reference Ren, Miura, Zhang, Otsuka, Tanaka, Koiwa, Suzuki, Chumlyakov and Asai11
Taking the previous arguments into account, it can be said that the elastic modulus decreases during the cooling from the austenitic field until it reaches the critical value and the phase transformation starts. When the modulus is high, the cooling must continue to achieve
 ${c'_{{\rm{crit}}}}$
, making the M
s to shift to lower temperatures, as already stated before. The relationship between the transformation temperatures and c
v has been shown to be a useful tool in the design of the transformation temperature in Ni–Ti–X alloys, where X is a ternary element.
Although the results obtained by Zarinejad and Liu Reference Zarinejad and Liu6,Reference Zarinejad, Liu and Chen7 have shown a general trend for NiTi based alloys, they do not consider microstructural features such as grain sizes, secondary phases, ordering, and defects concentration. This might be the reason for the scattering of the points observed on the graphs, even when a particular system is studied. Reference Zarinejad and Liu6,Reference Zarinejad, Liu and Chen7 Thereby, alloys belonging to the system Cu–Al–Ni are considered to be an exception by the previous authors. Considering the importance of this system regarding the SMA properties, it deserves a thorough analysis concerning the composition influence on the transformation temperatures and the c v values. As it is hard to consider the microstructural features in this type of analysis, a smaller scattering of the data would be achieved when closer compositions are studied. Thus, the objective of this work is to show the relation between c v and the phase transformation features for Cu–Al-based SMA, due to its technological importance in this field.
II. MATERIALS AND METHODS
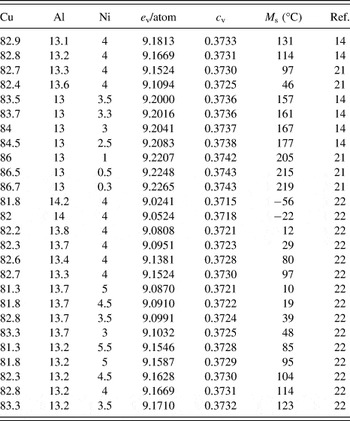
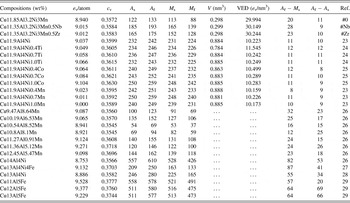
The transformation temperature for several Cu–Al-based SMA was reviewed from the literature. The values found are listed in Tables I and II. The correlation between the composition and M s were taken from experimental data in the literature. An exception was done for the compositions and M s found in Ref. Reference Recarte, Pérez-Sáez, Bocanegra, Nó and San-Juan14, in which the expression M s = 2433–169.9%Al–19.1%Ni (in wt%) was used to obtain the correlations.
Number of valence electron (e v), valence electron concentration (c v) and start martensitic transformation temperature (M s) for Cu–Al–Ni alloys. The compositions are given in wt% and the M s standard deviation is around ±2 °C.

Number of valence electron (e v), valence electron concentration (c v), transformation temperatures, lattice volume, and valence electron concentration (VED) for Cu–Al-based shape memory alloys. The temperatures are given in °C, with a standard deviation around ±2 °C.

Three different alloys with compositions Cu–11.85Al–3.2Ni–3Mn (#0), Cu–11.35Al–3.2Ni–3Mn–0.5Nb (#Nb), and Cu–11.35Al–3.2Ni–3Mn–0.5Zr (#Zr), all in wt%, were arc-melted (Edmund Bühler furnace, Edmund Bühler GmbH, Hechingen, Germany) in a Ti-gettered ultrapure argon atmosphere using pure (>99%) elements. The transformation temperatures for each of the alloys were measured by differential scanning calorimetry (DSC) in a DSC 200 F3 (Netzsch Group, Selb, Germany) at a rate of 20 °C/min.
The crystallographic compatibility between the austenite and the martensite was calculated based on the geometric nonlinear theory of martensite (GNLTM). Reference Hane and Shield15,Reference James and Hane16 By using a transformation stretches matrix in the form of Eq. (3), it is possible to find the parameters that are related with the compatibility between both phases. The middle eigenvalue λ2 of the matrix is the parameter that measures the misfit between the austenite and martensite and when it is equal to 1, it means that the austenite is directly compatible with the martensite. Reference Hane and Shield15–Reference Cui, Chu, Famodu, Furuya, Hattrick-Simpers, James, Ludwig, Thienhaus, Wuttig, Zhang and Takeuchi17 In the present study we consider a transformation from a cubic to a monoclinic unit cell. The components of the matrix are calculated according to the expressions in (3), where α, β, and γ are the transformation stretches and θ is the monoclinic angle:
 $$U = \left( {\matrix{ \varepsilon \rho \rho \cr \rho \sigma \tau \cr \rho \tau \sigma \cr} } \right)\quad ,$$
where,
 $$\varepsilon = {{\alpha \left( {\alpha + \gamma \sin \left( \theta \right)} \right)} \over {\sqrt {{\alpha ^2} + {\gamma ^2} + 2\alpha \gamma \sin \left( \theta \right)} }}\quad ,$$
 $$\rho = {{\alpha \gamma \cos \theta } \over {\sqrt 2 \sqrt {{\alpha ^2} + {\gamma ^2} + 2\alpha \gamma \sin \left( \theta \right)} }}\quad ,$$
 $$\sigma = {1 \over 2}\left( {{{\gamma \left( {\gamma + \alpha \sin \left( \theta \right)} \right)} \over {\sqrt {{\alpha ^2} + {\gamma ^2} + 2\alpha \gamma \sin \left( \theta \right)} }} + \beta } \right)\quad ,$$
 $$\tau = {1 \over 2}\left( {{{\gamma \left( {\gamma + \alpha \sin \left( \theta \right)} \right)} \over {\sqrt {{\alpha ^2} + {\gamma ^2} + 2\alpha \gamma \sin \left( \theta \right)} }} - \beta } \right)\quad .$$
The transformation stretches are calculated by α = a/a
0,
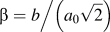 $\beta = {b \mathord{\left/ {\vphantom {b {\left( {{a_0}\sqrt 2 } \right)}}} \right. \kern-\nulldelimiterspace} {\left( {{a_0}\sqrt 2 } \right)}}$
,
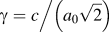 $\gamma = {c \mathord{\left/ {\vphantom {c {\left( {{a_0}\sqrt 2 } \right)}}} \right. \kern-\nulldelimiterspace} {\left( {{a_0}\sqrt 2 } \right)}}$
, where a, b, and c are the lattice parameters for the monoclinic martensite and a
0 is the lattice parameters for the cubic austenite. Thus, once the lattice parameters are known, the transformation stretches matrix can be built and its middle eigenvalue λ2 is used as a parameter of the crystallographic compatibility.
III. RESULTS
A. Transformation temperature dependence with the valence electron concentration
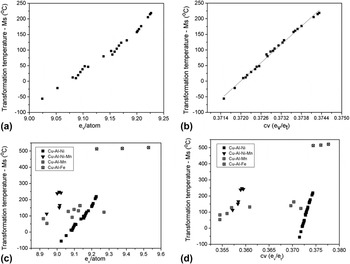
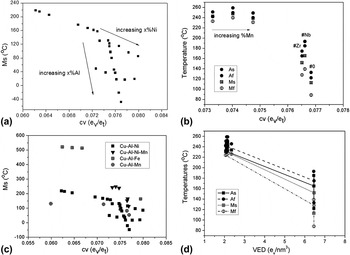
Figure 1 shows the relationship between the number of valence electrons (e v), valence electron concentration (c v), and the start martensitic transformation temperature (M s) for the Cu–Al–Ni alloys [Figs. 1(a) and 1(b)] and for other Cu–Al based systems [Figs. 1(c) and 1(d)]. It can be seen that M s decreases when e v and c v decrease and as observed in Figs. 1(a) and 1(b) the correlation between e v and c v is linear. However, when plotted together with the other compositions in Figs. 1(c) and 1(d) the data is more scattered. Depending on the added alloy element and its atomic number and valence electron, different values of c v will be obtained. It can be seen that the relationship between c v and M s will strongly depend on the composition of the alloy. Even in the same system, such as in Cu–Al–Ni, the transformation temperatures are remarkably affected even with a small change in the amount of solute atoms. Otsuka and Ren Reference Otsuka and Ren5 explained that the change on the number of the valence electrons of the alloy contributes to a change in the elastic modulus of the material, by weakening or straightening the bonds between the atoms. Moreover, because each atom has a different atomic number and valence electron number, they will affect the temperatures in different ways. Therefore, analysis for specific compositions within the same alloy system should be done to understand how different atoms influence the phase transition.

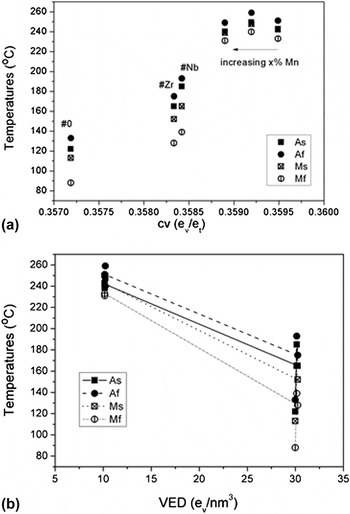
To illustrate the strong dependence of the transformation temperatures on the alloying elements, three alloys of the same system were manufactured and are referred as #0, #Nb, and # Zr in Table II. These alloys were designed to keep the same amount of Cu, and adding similar elements, in terms of atomic number and atomic mass such as Nb and Zr. Therefore, the effect of the difference in the valence electrons concentration in the transformation temperature can be seen in Fig. 2(a).
Dependence of M s for Cu–Al–Ni–Mn–(Zr or Nb) alloys with (a) c v and (b) VED.

As a general trend, it is possible to observe the sensitive dependence of the phase transition on every single type of alloying elements added to Cu–Al-based systems. These alloying elements have been mainly added to Cu–Al–Ni alloys to improve both the mechanical properties, by grain refinement or solid solution hardening, and functional properties, such as shape memory effect and pseudoelasticity. However, a shift in the transformation temperatures occurs by this addition. As stated before the shift of the transition temperatures is caused by a change in the bulk elastic modulus of the austenite. Reference Zarinejad and Liu6,Reference Zarinejad, Liu and Chen7 When the modulus is increased by the addition, a further cooling should take place to achieve the critical value, decreasing the transformation temperatures. The opposite happens, increasing the transformation temperatures. The bulk elastic modulus is directly related with the valence electron concentration. As the modulus is a resistance of a solid to volume change and the valence electrons act in the bonding of nonvalence electrons and the nucleus, the higher is the valence concentration, the higher is the modulus and the lower is the transformation temperature. This effect is obvious for NiTi alloys, which behave exactly the same as predicted by the theory. However, the Cu-based SMA studied here fall in the group of very high c v (c v > 0.34–0.35) and we observed that the smaller the value of c v, the smaller the transformation temperatures. Zarinejad and Liu explained that for high values of c v, the valence “glue” becomes too thick and generate antibonding, making the temperature increase. However, this explanation is not to clear and does not explain all the facts that happen with high c v alloys.
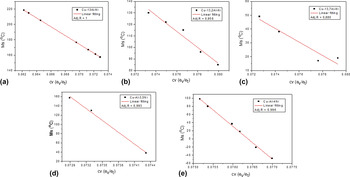
If we observe Fig. 2(b), the valence electron concentration per VED has a strong influence on the temperature transformation. It is known that larger VED results in higher modulus. If we consider it the alloys with bigger VED has a higher modulus, thus decreasing the transformation temperature. Reference Zarinejad, Liu and Chen7,Reference Frenzel, George, Dlouhy, Somsen, Wagner and Eggeler9,Reference Gilman12 This fact can be the reason for the M s to decrease when c v decreases in Cu-based SMA. The explanation lies on the fact that the larger the VED is, the larger amount of bonds that contribute for the elastic modulus, making the M s to decrease. Therefore, when even observing the opposite of the expected effect between c v and M s, one can see that apparently the modulus do increases with increasing c v for the studied alloys, as seen for the relation between VED and M s. This fact goes against the explanation given by Zarinejad and Liu Reference Zarinejad, Liu and Chen7 for high c v alloys, whereupon they state that an alloy with high c v has its bond weakened. They stated that antibonds are created when c v is high, making M s to increase. This supposition must be valid for NiTi alloys, in which the compositions are near the equiatomic in most cases. It has been seen that for Cu–Al–Ni alloys little variation in composition strongly influences the transformation temperatures, Reference Otsuka and Ren1,Reference Otsuka and Wayman2 although it is not influencing the values of c v as it should do. It happens because of the combination of two features of the Cu: its high number of valence electron and its high fraction in the alloys of the systems based on Cu–Al. In transition metals such as Cu, the atomic bonds can involve the orbital 3d as well as the orbital 4s. The more electrons involved, the stronger the bonds are, which can be proved by the high melting points of the transition metals. That’s the reason we and other studies in the same field Reference Zarinejad and Liu6,Reference Frenzel, George, Dlouhy, Somsen, Wagner and Eggeler9,Reference Frenzel, Wieczorek, Opahle, Maaß, Drautz and Eggeler18 used 10 or 11 as the number of valence electron for the copper and 10 for the nickel. In the case of copper, there is a study by Lewis et al. Reference Lewis, Jackson, Doorn, Majidi, King and Giwa19 proving that the most stable hybridization for the Cu atoms results in a minimum of 10 electrons in the most external layer of the atom. Thereby, these features may mask the effect of the other alloying elements in the c v values. Accordingly, similar graphs to the ones in Fig. 1 were plotted but considering the number of copper’s valence electron equals to one, as shown in Fig. 3. For the Cu–Al–Ni system shown in Fig. 3(a), it is seen that little variation in the fraction of Ni and Al strongly influences c v and M s. Thus, it is possible to isolate the effect of each element on the transformation temperatures by the different trends in the curves Ni or Al is varied as indicated in Fig. 3. As a consequence, the influence of the alloying elements becomes more perceptible if compared to Fig. 1, in which all the copper’s valence electrons are considered. Another important observation is that in Fig. 3 the increase in c v yields a decrease in M s, as predicted by the relations obtained by Zarinejad and Liu for NiTi alloys. Reference Zarinejad and Liu6,Reference Zarinejad, Liu and Chen7 Figures 3(b) and 3(c) show the same effect for alloys containing Mn and for other Cu–Al based system, respectively. All the observations so far have led to the following hypothesis: As the element copper is the major in the matrix, its variation does not influence the modulus, which would validate the plot in Fig. 2. The other possibility is that the increase in c v (for high c v alloys) has indeed the opposite effect on M s, which would validate Fig. 1. To check this difference, transformation temperatures and VED were plotted together in Fig. 3(d) in a graphic similar to Fig. 2(b), using the number of copper’s valence electron equals to one. It can still be seen the tendency of the transformation temperature decrease when VED increase. It confirms the fact that there is a direct relationship between VED and the transformation temperatures.
(a) Dependence of M s with c v for Cu–Al–Ni alloys; (b) for Cu–Al–Ni–Mn–(Zr or Nb); (c) for Cu–Al based alloys together, considering the number of copper’s valence electron equals to one; (d) Dependence of transformation temperatures with VED, considering number of copper’s valence electron equals to one.

One plausible explanation is that the Cu content do not contribute strongly with the size of the unit cell, but it does contribute strongly to the values of c v, thus increasing the values of VED. Therefore, for Cu–Al-based SMA, there are two empirical methods to estimate the transformation temperatures based on the previous facts:
-
(i) Purely based on VED values
-
(ii) Disregard the effect of copper’s valence electrons.
The behavior of M s and c v is not well understood when the number of valence electron for Cu is disregarded, therefore this is a more empirical approach.
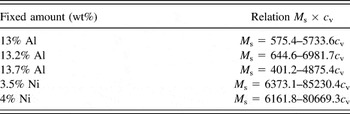
Figure 4 gathers the relationship between M s and c v for several alloys of the Cu–Al–Ni system, fixing the amount of either Al or Ni as indicated in the subtitles. Perfect linear relationship has been obtained for each case. Thus, for Cu–Al–Ni alloys these relationships are shown in Table III.
Correlation between M s and c v for fixed amount of Al equal to (a) 13 wt%, (b) 13.2 wt% and (c) 13.7 wt% and for fixed amount of Ni equal to (d) 3.5 wt% and (e) 4 wt%.

Relation between M s and c v obtained by the fitting of the curves in Fig. 4.

One possible explanation for this linear relationship, which is related to VED values, lies on the fact that a thermoelastic transformation is controlled by a shear of the lattice and involves an elastic accommodation of the volume and shape of the variants and a dissipative force related to the movement of the interfaces. As a consequence, the larger the VED, the larger is the elastic and dissipative forces required for the transformation to happen. Considering this fact, the study of the hysteresis should be done to make the correlation clear.
B. Hysteresis analysis based on thermodynamics of thermoelastic transformation and crystallographic compatibility
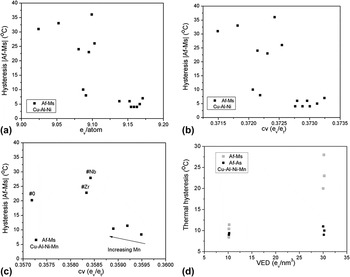
To analyze the influence of the valence electron in the energies involved in the transformation, some comparisons are shown in Fig. 5. It is seen that the hysteresis apparently decreases when e v/atom and c v increases, as shown in Figs. 5(a)–5(c). On the other hand, the hysteresis |A f − M s|, which is related with the interface movement, increases sharply with the increase in VED, as seen in Fig. 5(d). Unlike |A f − M s|, the elastic hysteresis |A f − A s| increases in a lower rate. Once the bonds’ strength is proportional to VED, one can say that they are stronger in higher VED, making more difficult for the interface movement.
Thermal hysteresis with (a) e v and (b) c v for Cu–Al–Ni alloys, (c) c v for Cu–Al–Ni–Mn alloys, and (d) VED for Cu–Al–Ni–Mn alloys.

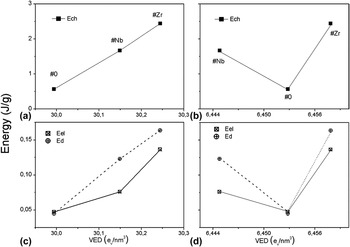
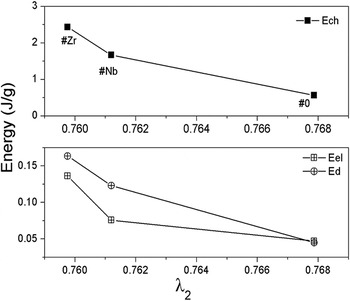
To elucidate that fact, Fig. 6 shows the correlation between the transformations energies with VED considering the copper’s valence electron equals to 11 in Figs. 6(a) and 6(c) and equals to 1 in Figs. 6(b) and 6(d). Fig. 7 shows the relation between the transformation energies and the parameter λ2, which represents the crystallographic compatibility between the austenite and martensite. The parameter λ2 was calculated from the deformation matrix of the transformation and it represents the compatibility of the austenite and the martensite and the volume change in the phase transformation.
Transformation energies versus VED considering number of copper’s valence electron equals to ten (a) and (c), and equals to one (b) and (d).

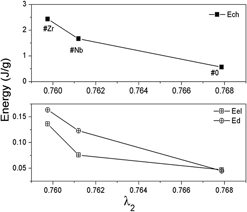
Transformation energies versus λ2.

In Figs. 6(a) and 6(c), it can be observed that the chemical energy (E ch), the elastic energy (E el), and friction energy (E d) increase their values when VED is greater, which corroborates with the fact that the phase transformation gets more difficult when the chemical bonds are more cohesive, forcing the equilibrium temperature T 0 to be in lower values. As a consequence, the transformation temperatures go to lower temperatures as well. The energies involved in the transformation were calculated based on the DSC curves obtained for the alloys #0, #Zr, and #Nb. The chemical component was calculated according to Eq. (4), where T 0 = (M s + A f)/2 and Q M−A are the transformation enthalpy obtained from the DSC curve. The nonchemical components were calculated by the expressions E el = ΔS(A f − A s) and E d = ΔS(A f − M s)/2 for the elastic and dissipative terms, respectively. Reference Mazzer, Kiminami, Bolfarini, Cava, Botta and Gargarella4 The entropy was taken from the expression E ch = T cΔS, where T c should be taken as (A f + A s)/2. Reference Kato, Yasuda and Sasaki20 However, if the copper’s electron valence is considered equal to 1, there is no clear relationship between the energies, as seen in Figs. 6(b) and 6(d). It may happen because the bonds influenced by the copper’s valence electron are not taking into account.
 $${{{E_{{\rm{ch}}}}} \over {{T_0}}} = \int_{{A_{\rm{s}}}}^{{A_{\rm{f}}}} {{{{\rm{d}}{Q_{M - A}}} \over T}} \quad .$$
Owing clarifying all those relationships it is seen in Fig. 7 that the lower the compatibility between the phases (λ2 different from 1) the greater are the energies of the transformation. This means that when the structures of the austenite and martensite are similar, the martensite nucleation is associated with a smaller energy barrier. As a consequence, the greater the VED values the smaller is the compatibility between the phases, making the hysteresis to increase due to the larger spent of energy within the transformation, which is related with both chemical and nonchemical energies of the transformation. This fact corroborates with the relationship of Figs. 6(a) and 6(c).
Considering the fact that the VED takes into account the volume of the unit cell, one thing that arises is the changing of the transformation temperature with the average metallic radius of the alloy. Indeed, for the studied systems of alloys involved in the present work, the changing in M s with the average metallic radius behaves exactly in the same way as seen in Fig. 3(a), showing that the volume plays an important role and must be considered together with the valence electrons to understand the changing of transformation temperature with the composition for a specific system.
Considering the previous statements, the VED values as well as the crystallographic compatibility and the energies of the reaction are useful tools in predicting the temperature of phase transformation in Cu-based SMA with different compositions.
The relationships obtained so far show that the transformation temperatures are sensitive with the alloy’s composition. In turn, this last influences in the lattice parameters of the unit cell. Thus, a clear relationship between VED, λ2, E ch, E el e E d is observed.
IV. CONCLUSION
The prevision of the phase transformations behavior when the composition of a Cu–Al based SMA is changed can be estimated by the valence electron theory provided a good relationship is observed between VED, the crystallographic compatibility, and the transformation energies. It was shown that the larger the VED, the more energy is used in the transformation. The same tendency is present when the crystallographic compatibility is smaller. In this way, the VED plays an important role in the prediction of the temperature transformation and the energies involved in the reaction.
ACKNOWLEDGMENTS
The authors are grateful for the financial support granted by CNPq (202071/2014-6).