Historians of the American mental hospital still do not firmly grasp who mental hospital patients were. Yet their characteristics as a distinct population are an important factor in interpreting the nature of the mental hospital, an issue central to the field.Footnote 1 Scholars have long debated whether the mental hospital was a “repressive” or “humanitarian” institution from various angles (Friedman Reference Friedman1990; Grob 1979, 1994a; Rothman 1981, 1990; Scull Reference Scull1981; Tomes 1994). In the 1970s and early 1980s, principal players in this debate examined the composition of the patient population, among other things, to discern the nature of the mental hospital. Thus, their opposing interpretations of the mental hospital as repressive or humanitarian included matching characterizations of the patients—based on their demographic traits—as victims of repression or beneficiaries of humanitarianism. But those scholars’ demographic analyses were problematic because they were not proficient in the requisite quantitative methods. Since others in the field were no more adept at such techniques, there was actually no critical assessment of the demographic evidence presented to support the competing characterizations of the patients. As historical scholarship moved away from quantitative analysis in the 1980s, the interest in the demographic approach to the debate—and in the patients in general—faded. While historians have since then deepened their understanding of the nature of the mental hospital through qualitative research, there has not been a thorough investigation of the patient population. Mental hospital patients remain elusive in the field that studies mental hospitals.
This article seeks to understand who mental hospital patients were. It ascertains and analyzes the defining characteristics of the patient population within the context of the field's signature debate on the nature of the mental hospital, where such demographic data are sorely needed and can make a large historiographical impact. Of course, this article's demographic analysis will not settle the enduring debate. Its complexity has only increased as historians have investigated such relevant issues as what was deemed insanity; how altruistic mental hospitals’ founders and supporters were; how the public viewed these institutions; who initiated commitment proceedings; and what life inside the hospital was like (Dwyer Reference Dwyer1987; Fox Reference Fox1978; Tomes Reference Tomes1984). Though overlooked since the mid-1980s, who the patients were is still an essential issue for the debate and the historical scholarship of the mental hospital in general as well. The recent availability of formerly inaccessible archival data in machine-readable form can advance our understanding of the patients beyond what we learned from that debate. In depicting the patients as either victims or beneficiaries of the mental hospital based on their demographic traits, each of the opposing camps focused only on a few traits it deemed symbolic of its interpretation of the mental hospital, stripping the patients of their other sides incongruent with that view. This article examines the patients for what they were—a population with many contradictory aspects—using the newly available data that allow multivariate analysis needed to capture such complexity. It demonstrates a configuration of demographic features that not only distinguished the patients from the general population but also made them appear at once victims and beneficiaries of the mental hospital. It thus presents a demographic analysis of the patients that contributes to the effort to transcend the binary framework of the debate on the nature of the mental hospital.
Opposite interpretations of the mental hospital emerged in the late 1960s. Influenced by Michel Foucault and best represented by David Rothman, those critical of the mental hospital compared it to a prison, claiming involuntary commitment was often a convenient way to confine undesirable people (Foucault Reference Foucault1965; Rothman Reference Rothman1971, Reference Rothman1980). By contrast, Gerald Grob, the most tenacious defender of the mental hospital, likened it to an old-age home, insisting it sheltered not only the insane but also other disabled people who could not get assistance anywhere else (Grob Reference Grob1966, Reference Grob1973, Reference Grob1983). Accordingly, Grob regarded mental hospital patients as beneficiaries of humanitarianism, while the critics treated them as victims of repression.
To support the characterization of the patients as victims of repression, the critics stressed the overrepresentation of immigrants and lower classes, who exemplified undesirable people in their interpretive scheme, in the patient population. In The Discovery of the Asylum, Rothman noted the patient population had come to comprise the “foreign-born,” the “poor,” and the “lower-class” by the mid-nineteenth century (1971: 273, 283–86). “The convenience of confining these types of patients,” who accumulated as “incurable cases,” justified the continuation of the no longer therapeutic mental hospital (ibid.: 283, 273). In Conscience and Convenience, he observed that the majority of state hospital patients were “working class,” 40 percent of them “foreign-born or the children of the foreign-born,” in 1890 (1980: 24). In the 1920s and 1930s, there were “[a] disproportionate number of foreign-born” among state hospital patients, the majority of them “laborers” and “chronic” (ibid.: 350–51). Through the years, the mental hospital was “a dumping ground for social undesirables” (1971: 286).
Richard Fox, also critical of the mental hospital, examined San Franciscans committed to state institutions in the early twentieth century in So Far Disordered in Mind. “[B]lue-collar workers,” especially “unskilled laborers”; the “unmarried,” particularly “early widows and widowers”; and “aged women” were conspicuous among San Francisco patients (1978: 114, 119, 118, 131). But two-thirds of them were “odd, peculiar, or simply immoral individuals” without symptoms of insanity (ibid.: 148). Their families, neighbors, and public officials had them committed when their “bothersome and unproductive” behavior, their failure to follow bourgeois social norms, became intolerable (ibid.: 174, 186). The state met the community's need to remove “unwanted persons” “convenien[tly]” by subsidizing their custodial care in mental hospitals (ibid.: 138, 186).
By contrast, Grob emphasized the overrepresentation of those who needed custodial care, especially the senile old, among mental hospital patients in characterizing them as beneficiaries of humanitarianism. In Mental Institutions in America, he, too, noted the predominance of immigrants and lower classes in the mid-nineteenth century (1973: 189, 231–34). But it was “the relative and absolute growth in the number of aged patients” after 1900, the development he detailed in Mental Illness and American Society, 1875–1940, that shaped his view of the mental hospital (1983: 180). Old patients included the senile and had previously accounted for less than 10 percent of all patients (1973: 188). Proportions of patients aged 60 or older ballooned, and nearly 70 percent of patients in a Chicago hospital were “aged or infirm, suffering from no psychoses” in the early 1930s (1983: 181–82, 185). Patients with neurological impairments due to somatic causes such as general paresis also became prominent (ibid.: 188–90). The mental hospital doubled as an “old-age home” for the senile and other disabled persons in the early twentieth century when there were no institutional alternatives for them (ibid.: 183, 195).
However, neither camp firmly established the overrepresentation of the groups it deemed emblematic of its characterization of the patients. In the 1970s and early 1980s, when their debate was most intense, both camps were only able to compare frequency tables of such variables as age, nativity, and occupation (as a proxy for class) between a given patient population and the general population from which it originated, to detect overrepresented groups. But available univariate (and rare bivariate) tables for one population often did not match those for the other population in geographic coverage, hindering proper comparisons. These tables did not allow direct statistical control of relevant covariates, either. Thus, from tables showing a large number of patients in several hospitals were from a certain group, Grob and Rothman more or less assumed its overrepresentation—without carefully examining its size in appropriate general populations or variables that might have affected its presence in these hospitals (Grob 1973: 231, 238; 1983, 181–82; Rothman Reference Rothman1971: 283–84; 1980: 24, 350). Fox did analyze San Francisco patients in relation to the city's general population. But despite obtaining individual-level data of the patients, constrained by tabulated data of the city residents, he compared percentage figures from the two populations without proper statistical adjustments in order to find overrepresented groups (1978: 104–34). The use of aggregate data, with the attendant difficulties of geographically matching patient and general populations and statistically controlling for relevant covariates, marred both camps’ demographic analyses. Neither camp clearly showed how distinct the patient population was from the general population.
Reliance on aggregate data also helped polarize the characterization of the patients. The mode of analysis such data allowed—the inspection of one variable at a time—prevented either camp from examining the demographic traits of its interest and those of the other camp's simultaneously as part of a complex, multifaceted population. Each camp, unable to reconcile frequency tables underpinning its argument with those supporting the other camp's, discounted the latter. It was not so much the nature of the mental hospital as the nature of available data that made the patients appear either victims or beneficiaries of the mental hospital.
This article tackles these problems with individual-level data of patient and general populations collected from federal census manuscripts. Such an approach has become feasible only in the recent decades owing to the Integrated Public Use Microdata Series (IPUMS), which has made it possible to extract from that archival source a sample of any given area's general population, the data previous researchers could not obtain even when they produced a sample of patients as Fox did (Ruggles et al. Reference Ruggles, Alexander, Genadek, Goeken, Schroeder and Sobek2010). This article has drawn observations from the census manuscripts according to the epidemiological “case-control” study design (Gordis Reference Gordis1996). All observations, or “cases” and “controls,” are from 1880 to 1920, the period over which the two camps clashed most.Footnote 2 Unless otherwise noted, the “cases” are public hospital patients aged 15 or older.Footnote 3 Because patients in a public hospital usually came from the area it served, the “controls” are area residents aged 15 or older who could have been committed to that hospital.Footnote 4 (There will be no further reference to “public” unless necessary.) Using multivariate-analysis techniques, this article examines how the cases differed from the controls in such risk factors of institutionalization as age, nativity, and occupation—the variables that interested the two camps—and race, ethnicity, gender, and marital status—the variables that, though given short shrift before, are pertinent to their arguments.Footnote 5 It ascertains the defining characteristics of the patient population through a series of epidemiological studies that investigate, from various angles, which groups in the general population were so likely to become institutionalized as to symbolize the patient population in the late nineteenth and early twentieth centuries.
The first of these epidemiological studies deals with the implications for the patient population of the fact that a large proportion of the insane remained in the general population in this period. The patient population was distinct not because its members were insane but because they were institutionalized when insanity did not necessarily result in institutionalization. Then, groups more prone to institutionalization than would have been expected from their susceptibility to insanity would have symbolized the patient population. Using a nationwide random sample of the sane at large, the insane at large, and the institutionalized insane from the 1880 census manuscripts, this article identifies demographic groups that exhibited such an unusually strong tendency to end up in mental hospitals.
Second, it addresses the static nature of current knowledge about mental hospital patients. Whether and how their demographic traits varied across places and changed over time still awaits close scrutiny. This article investigates which groups were likely to become institutionalized where and when using another random sample that consists of patient and general populations from a dozen hinterland and metropolitan areas across the North from the 1880, 1900, and 1920 census manuscripts. It discovers essentially the same demographic groups ended up in mental hospitals in both the hinterland and metropolitan areas from 1880 to 1920.
Finding the married and the widowed were not among those groups, this article explores a protective effect that being currently or previously married had against institutionalization in the third study. It examines whether such an effect reduced the risk of institutionalization for married and widowed members of high-risk age, racial and ethnic, and gender groups. The data from the North show the protective effect of marriage operated in a way that reflected and reinforced social hierarchies that presumably underlay differential risks of institutionalization among racial and ethnic and gender groups.
Finally, this article integrates its analysis of mental hospital patients into the enduring debate on the nature of the mental hospital. It first assesses, in light of its findings, the two rival camps’ demographic analyses of the patients that underpinned their characterizations as victims or beneficiaries of the mental hospital. Dissecting the data from the North further, this article weaves the demographic traits deemed indicative of the mental hospital's repressiveness and the ones considered reflective of its humanitarianism into a panoptic portrayal that presents the patients as both victims and beneficiaries of the mental hospital. This article's analysis of the patients as a complex, multifaceted population helps transcend the binary framework of the debate on the nature of the mental hospital and deepen our understanding of who they were.
From Sanity to Insanity to Institutionalization
For this article's analytical purposes, to ask who mental hospital patients were is to ask which groups were so likely to become institutionalized as to represent the patient population. The determination of such groups is not straightforward when the risk of institutionalization was disjoined from the risk of insanity. That was particularly the case in 1880, when nearly half of some 92,000 insane persons remained at home (Wines Reference Wines1888: 39).Footnote 6 In these circumstances, not all groups at elevated risk of institutionalization epitomized the patient population. For example, Groups A and B might both have been 1.5 times more at risk of institutionalization than was Group C. But Groups A and B could have been, respectively, 1.7 times more and 1.3 times more at risk of insanity than was Group C. Then, Group A would have been less likely to become institutionalized than would have been expected from its proneness to insanity, and hence could not have conveyed the essence of the patient population as being institutionalized when many of the insane stayed at large. By contrast, Group B, being 1.5 times more at risk of institutionalization when 1.3 times more at risk of insanity, would have been considered to have an unusually strong tendency to end up in mental hospitals. In the late nineteenth century when insanity did not necessarily lead to institutionalization, groups more likely to become institutionalized than would have been expected from their susceptibility to insanity would have represented the patient population.
Which groups had such an unusually strong tendency to end up in mental hospitals? This question situates mental hospital patients at the end of the sequential descent in which a small subset of Americans slid from the state of sanity to the realm of insanity, where the afflicted were not confined immediately, and then a smaller subset proceeded to the final stage of institutionalization. This section examines the workings of such a descent using the data, from the IPUMS, of some 20,000 sane individuals at large; 3,500 individuals who became insane but stayed at large; and 3,000 individuals who became insane and institutionalized in mental hospitals, from 26 states across the country from 1880.Footnote 7 The insane at large are part of “cases” for the analysis of the fall to insanity, but are part of “controls” for the analysis of the plunge to institutionalization, and the cases and controls are matched on the state level.Footnote 8 Fitting partial proportional odds models on the data, this section investigates how likely a given group was to become insane at the first transition on the sequential descent and how likely that group was to become institutionalized at the second transition (Williams Reference Williams2006).
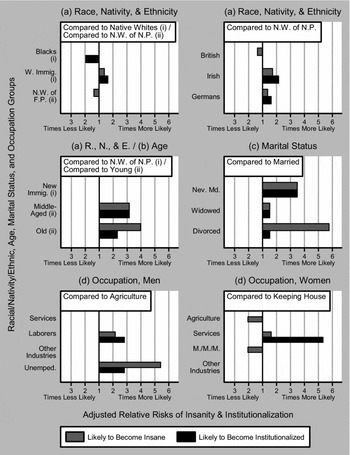
Figure 1 summarizes the analysis of the effects of race, nativity, ethnicity, gender, age, marital status, and occupation on each transition.Footnote 9 Each effect is adjusted for relevant covariates as explained in footnote 9, and is effectively the weighted national average of varying effects from 26 states. Figure 1 shows the effect of each demographic variable on the two transitions as a given group's adjusted relative risk of becoming insane, expressed by a gray bar, and that group's adjusted relative risk of becoming institutionalized, represented by a black bar.Footnote 10 (There are no bars for women or men because the data do not show gender disparities in insanity or institutionalization.) Groups with a black bar longer than a gray bar were more likely to become institutionalized than would have been expected from their relative risks of becoming insane.
Adjusted relative risks of insanity and institutionalization in the United States, 1880.

Figure 1 indicates race and nativity influenced the risk of institutionalization in opposite directions in 1880. Blacks were as likely to become insane but twice less likely to become institutionalized than were native whites. Although the two groups became insane at about the same rate, blacks ended up in mental hospitals at much lower rates than native whites: hospital care was often unavailable for blacks because of their race (Grob 1973: 243–44). However, white immigrants were 1.4 times more likely to become insane but 1.6 times more likely to become institutionalized than were native whites. Not only did they end up in mental hospitals at higher rates than native whites, white immigrants also ended up in mental hospitals at higher rates than would have been expected from their relative risk of insanity.
The ethnicity of white immigrants and the foreign parentage of their American-born children complicated white Americans’ risks of institutionalization (figure 1). British immigrants and native whites of foreign parentage (i.e., of one or both immigrant parents) were no more likely to become institutionalized than native whites of native parentage (i.e., of American parents). Being foreign-born white but British and being native-born white but of foreign parentage provided as good protection against institutionalization as being at least third-generation white American (i.e., being native-born white and of native parentage). But the British and second-generation white Americans (i.e., native whites of foreign parentage) were 1.4 times less likely to become insane than native whites of native parentage. Although these three groups became institutionalized at about the same rate, the first two became insane at lower rates than the last one. In effect, the British and second-generation white Americans ended up in mental hospitals at higher rates than their relative risks of insanity would have suggested. (In 1880, there were not enough “new” immigrants for the effect of their ethnicity to be observed retrospectively.) Compared to native whites of native parentage, German immigrants were 1.4 times more at risk of insanity but 1.6 times more at risk of institutionalization, while Irish immigrants were 1.7 times more likely to become insane but 2.2 times more likely to become institutionalized. When the Irish and Germans ended up in mental hospitals at higher rates than would have been expected from their relative risks of insanity, their circumstances as Irish and German could have hardly failed to play a role in their confinement.
Figure 1 indicates that while the old were more at risk of insanity than the middle-aged, the middle-aged were more at risk of institutionalization than the old. Compared to the young (15–39), the middle-aged (40–59) and the old (60+) were, respectively, about three times more and four times more likely to become insane. But such differentials, reflecting age-specific prevalence rates (i.e., existing cases) of insanity, convey the aging of the insane rather than an increase in the risk of insanity with age. Incidence rates (i.e., new cases) of insanity per 100,000 persons, estimated for the one-year period prior to the 1880 census, were 32 among the young, 41 among the middle-aged, 39 among the old (60+), and 51 among the very old (80+).Footnote 11 The incidence rates among the old and the very old suggest many of the old that the 1880 census counted as insane were actually senile, and the senile were generally not cared for in mental hospitals in the nineteenth century (Grob 1983: 180; 1994b: 117).Footnote 12 Thus, while four times more at risk of becoming insane (or being counted as such) than the young, the old were about twice more at risk of becoming institutionalized than the young. The old ended up in mental hospitals at much lower rates than their relative risk of insanity would have predicted. On the other hand, when three times more likely to become insane than the young, the middle-aged were also three times more likely to become institutionalized than the young. The middle-aged ended up in mental hospitals at higher rates than the old because insanity struck the middle-aged at higher rates, as the aforementioned incidence rates show, and because the insane, not the senile, were to occupy scarce hospital beds.
The unmarried claimed a disproportionately large share of the scarce beds (figure 1). The never married were 3.5 times more likely to become insane and also 3.5 times more likely to become institutionalized than were the married. The never married ended up in mental hospitals at much higher rates than the married, and those rates were commensurate with the former's large relative risk of insanity. The widowed, too, faced a relative risk of institutionalization that was proportional to their relative risk of insanity, though their relative risks were much smaller: the widowed were 1.5 times more at risk of insanity and institutionalization than were the married.Footnote 13 (A very large relative risk of insanity for the divorced is probably due to their small sample size.) Conversely, the married were at much lower risk of institutionalization than the unmarried, partly because the spouses of the insane could have cared for them at home. Disparities in the risk of institutionalization among the unmarried indicate such a protective effect of marriage persisted for those who were no longer married. The previously married, or the widowed and the divorced, were 2.3 times less likely to become institutionalized than the never married.Footnote 14 While both the never married and the previously married lacked spouses, the previously married were more likely to have adult children, who could have cared for them, than were the never married. Being previously married protected against institutionalization, though not as strongly as being currently married did, while the never married would not normally have had spousal or filial safety nets.
The effect of occupation on the risk of institutionalization was opposite for men and women in 1880 (figure 1). Among men of working age (20–59), the unemployed were over five times more at risk of insanity but about three times more at risk of institutionalization than were those employed in agriculture. Compared to the latter, laborers were more than twice as likely to become insane but about three times more likely to become institutionalized. While the unemployed ended up in mental hospitals at considerably lower rates than their relative risk of insanity would have suggested, laborers ended up in mental hospitals at higher rates than would have been expected from their relative risk of insanity. Among women of working age, those employed in agriculture and those engaged in manufacturing, mechanical, and mining industries were twice less likely to become insane but no less likely to become institutionalized than were those keeping house. In effect, the former two groups ended up in mental hospitals at higher rates than their relative risks of insanity would have predicted. Women providing various, mostly personal, services—predominantly domestics and laundresses—were 1.5 times more at risk of insanity but over five times more at risk of institutionalization than were those keeping house. Domestics and laundresses ended up in mental hospitals at vastly higher rates than would have been expected from their relative risk of insanity. (No other occupations affected the risk of insanity or institutionalization.)Footnote 15 Being at the margins or out of the labor force increased men's risk of institutionalization, while being in the labor force at all raised women's.
This section has identified the groups that were more prone to institutionalization than would have been expected from their relative risks of insanity and hence were emblematic of the patient population on the national level in 1880. The old ended up in mental hospitals at higher rates than the young, but those rates were much lower than the former's relative risk of insanity would have suggested. Unemployed men and the divorced, too, faced relative risks of institutionalization that were actually smaller than their relative risks of insanity. The never married ended up in mental hospitals at higher rates than the married, but those rates were commensurate with the former's relative risk of insanity. The widowed and the middle-aged, too, had relative risks of institutionalization that were proportional to their relative risks of insanity. The never married, the widowed, and the middle-aged were prominent but expected components of the patient population. White immigrants ended up in mental hospitals at higher rates than native whites, and those rates were higher than the former's relative risk of insanity would have predicted. The Irish, the British, Germans, second-generation white Americans, laborers, and women working outside the home, especially domestics and laundresses, all displayed such an unusually strong proneness to institutionalization. Ending up institutionalized when insanity did not necessarily result in institutionalization, these groups symbolized the patient population.
Geographical and Temporal Variability
The effects of demographic risk factors of institutionalization might not have been the same across the country or stayed the same after 1880. Of great interest is geographical and temporal variability in such effects in the North (i.e., the Northeast and Midwest) from the late nineteenth to the early twentieth century, when the region accounted for more than 70 percent of all mental hospital patients (US Bureau of the Census 1906: 202; 1926: 92; Wines Reference Wines1888: 39). States such as Massachusetts, New York, Pennsylvania, Ohio, Illinois, and Missouri each maintained a mental hospital serving hinterland counties around the geographic center of the state and another hospital for a metropolis on the state border along the shore (Grob 1994b: 49–53). The influx of white immigrants and blacks at that time, fueling and fueled by the urbanization of the North, impacted its metropolitan areas much more than its hinterland areas, which actually remained demographically representative of the region.Footnote 16 Demographic differentials in the risk of institutionalization under the region's typical demographic conditions could have formed in the hinterland areas, while the metropolitan areas’ extraordinary environments might have distorted such patterns. This section examines how the effects of demographic risk factors of institutionalization might have varied between the hinterland and metropolitan areas of the North from the late nineteenth to the early twentieth century as the major demographic events of the era—immigration and urbanization—unfolded.
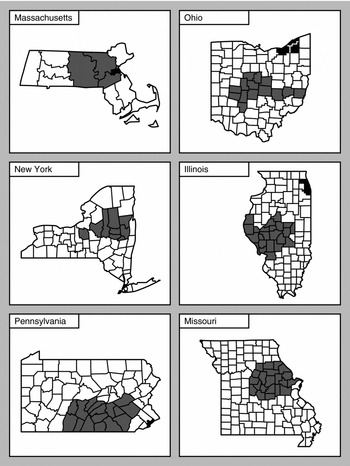
Which groups were likely to become institutionalized where and when? This section addresses such a question with the data of some 14,000 mental hospital patients and 29,000 individuals at large from a dozen hinterland and metropolitan areas in the aforementioned six states from 1880, 1900, and 1920. Figure 2 shows these areas. Each area was actually an institutional district within which the area's hospital admitted its patients. The data from each area from each year consist of 400 patients in the area's hospital and 800 residents who could have been committed to it: “cases” and “controls” matched on the institutional-district level. The data from each state from each year contain a set of these observations from the state's hinterland area and another set from its metropolitan area. The data from each year thus comprise patients in 12 mental hospitals and individuals at large in the 12 areas these hospitals served. While extracting the controls from the IPUMS, this article has collected the cases directly from archival census manuscripts.Footnote 17 Fitting logit models on the data, this section investigates how likely a given group was to become institutionalized in the hinterland and metropolitan areas of the North in 1880, 1900, and 1920.
Institutional districts in six northern states, 1880–1920.

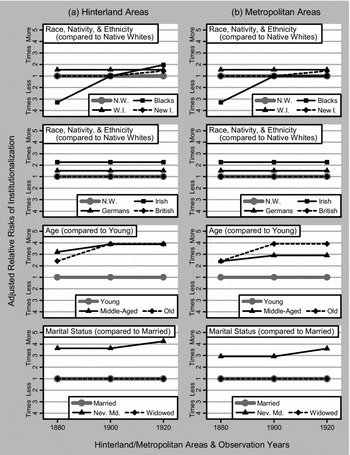
Figure 3 summarizes the analysis of geographical and temporal variability in the effects of race, nativity, ethnicity, gender, age, and marital status on the risk of institutionalization.Footnote 18 The effect of each demographic risk factor is contingent on the effects of time and place, potentially varying from one year to another and from one area to another. Such joint effects are adjusted for relevant covariates as explained in footnote 18. The marker symbol in figure 3 expresses the effect of each demographic variable as a given group's adjusted relative risk of institutionalization in a given area in a given year (i.e., effectively, the weighted average of that group's relative risks from six hinterland or six metropolitan areas in a given year). (Figure 3 does not plot the effect of gender because the data do not indicate gender disparities in either area or in any year.) Figure 3 shows how little the effects of many demographic risk factors varied between the two areas over the four decades.
Adjusted relative risks of institutionalization in the hinterland and metropolitan areas of the north, 1880–1920.

The effects of nativity and ethnicity barely changed despite a significant change in ethnic relations during the period of increased immigration (figure 3). White immigrants were 1.6 times more likely to become institutionalized than native whites in both the hinterland and metropolitan areas from 1880 to 1920. The influx of “new” immigrants did not fundamentally alter existing differentials in the risk of institutionalization among white immigrants. From 1880 to 1920—before the influx, during its peak, and near its halt—British immigrants were no more at risk than native whites in either area. German and Irish immigrants were, respectively, 1.5 times more and 2.3 times more at risk than native whites in both areas through that period. “New” immigrants were at no higher risk than native whites in either area in 1880 or 1900. Even in 1920, at the height of the backlash against them, “new” immigrants were only as likely as Germans and much less likely than the Irish to become institutionalized in both areas. “New” immigrants, who reputedly replaced Germans and the Irish in the lower echelons of society, did not replace them in mental hospital wards (Dolan Reference Dolan2008: 104, 149; Painter Reference Painter2010: 206).
Elevated risks for the Irish were especially noteworthy. To the extent that unfamiliarity with the English language and English-derived customs and systems underlay some of the hardship non-British immigrants experienced, elevated risks for Germans and “new” immigrants might have represented a somewhat expected toll of adjustment to an unfamiliar way of life (Dolan Reference Dolan2008: 136–37). Despite some advantage in these regards, the Irish sustained a 50 percent higher risk than Germans and “new” immigrants during the period marked by Irish Americans’ rise in urban politics (ibid.: 138). Whatever the reasons, the Irish ended up in mental hospitals at much higher rates than other white Americans (ibid.: 91).Footnote 19
Unlike the effects of nativity and ethnicity, the effect of race changed considerably from 1880 to 1920 and differed between the hinterland and metropolitan areas after 1900 (figure 3). In 1880, blacks were over three times less likely to become institutionalized than native whites in both areas. By 1900, as the black population in the North had grown about 25 percent, blacks had become as much at risk as native whites in both areas (US Bureau of the Census 1913: 146–47; US Census Office 1901: cxii). Between 1900 and 1920, the black population in the North grew nearly 45 percent due to the Great Migration of blacks (US Bureau of the Census 1922: 34; 1933: 32, 38). In the metropolitan areas, where most of that growth took place, blacks were no more likely to become institutionalized than native whites in 1920. But in the hinterland areas, where their presence was much smaller, blacks had become twice more at risk than native whites—and, in fact, as much at risk as the Irish—by then. Such variability in the effect of race demonstrates how socially negotiated the confinement of blacks was.
The effect of age, too, differed between the two areas and changed over time (figure 3). In the hinterland areas, the middle-aged were over three times more likely in 1880 and four times more likely in 1900 and 1920 to become institutionalized than were the young. Relative risks for the middle-aged were 25 percent smaller in the metropolitan areas, but such geographical disparities probably did not matter much because the middle-aged were still 2.5 to 3 times more at risk than the young there. In both areas, the old were 2.5 times more likely in 1880 and 4 times more likely in 1900 and 1920 to become institutionalized than were the young. Relative risks for the old rose because local governments moved the senile from county almshouses to state hospitals as state governments began assuming the care of the insane in the 1890s and 1900s (Grob 1994b: 120–21). The effect of age thus reflected changes in public policy.
The effect of marital status varied in such a way as to reveal a protective effect that being currently or previously married had against institutionalization (figure 3). (This and subsequent sections do not analyze the divorced, and hence the previously married will hereafter refer to the widowed.) In the hinterland areas, the never married were 3.5 times more likely in 1880 and 1900 and 4.5 times more likely in 1920 to become institutionalized than were the married. Relative risks for the never married were 20 percent smaller in the metropolitan areas, but such geographical differences hardly call into question a considerable protective effect that marriage exhibited in both areas. Heightened risks for the never married in 1920 might have reflected the eugenics campaign to isolate and sterilize the insane, especially unattached ones, in mental hospitals (Grob 1983: 171–74). On the other hand, the widowed, or the previously married, were at no higher risk of institutionalization than the married in either area from 1880 to 1920. The currently or previously married, presumably protected by their spouses and children, sharply contrasted with the never married with pronounced vulnerability to institutionalization.
This section has found the effects of demographic risk factors of institutionalization were mostly constant across places and over time. Conspicuously featured among mental hospital patients in both the hinterland and metropolitan areas of the North from 1880 to 1920 were white immigrants in general, the Irish in particular, the middle-aged, the old, and the never married. This unenviable roster comprises the same groups the previous section has identified as staples of the patient population in 1880, suggesting national-level institutionalization patterns from that year, except for those parts concerning blacks, might have generally carried over to 1900 and 1920. It may also be reasonable to speculate that in 1900 and 1920, the old (whose risk of institutionalization rose because of a change in public policy) and white immigrants (especially the Irish) might have ended up in mental hospitals at higher rates than their relative risks of insanity would have predicted. Blacks in the hinterland areas might also have shown such an unusual tendency in 1920. In both the hinterland and metropolitan areas of the North, essentially the same demographic groups ended up in mental hospitals from 1880 to 1920.
Protective Effect of Marriage against Institutionalization
The married and the widowed were not among those high-risk groups. The previous section has shown that the Irish and the old were at higher risk than native whites and the young, while men were at no higher risk than women, across marital status groups. It has also shown that, whether across gender groups, age groups, or racial and ethnic groups, the currently or previously married were far less likely to become institutionalized than were the never married.Footnote 20 Could such a protective effect of marriage have alleviated adverse effects associated with being Irish or old, so that relative risks for the Irish and the old might have been smaller among the currently or previously married than among the never married? When there was no excess risk associated with being female or male and hence there was no adverse effect it could have tempered, could the protective effect of marriage have influenced the effect of gender? Could relative risks for men or women have been smaller among the currently or previously married than among the never married? Whereas the previous section has examined the effect of marital status while controlling for other demographic risk factors, this section analyzes interactions between marital status and those other risk factors in order to shed light on the workings of marital protection.
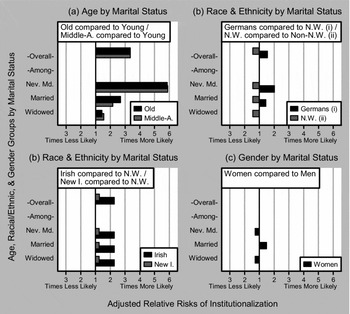
How did marital status interact with the other demographic risk factors? More specifically, did the protective effect of marriage reduce the risk of institutionalization for currently or previously married members of high-risk groups? To tackle such questions, this section examines the previous section's data with logit models again. It investigates how the effects of age, race and ethnicity, and gender on the risk of institutionalization might have varied from one marital status group to another. Figure 4 reports such joint effects, between marital status and each of these demographic risk factors, for the North between 1880 and 1920 as a whole, rather than for the two areas and three years separately.Footnote 21 These effects are adjusted for relevant covariates as explained in footnote 21. The bar in the lower half of each panel in figure 4 expresses a given joint effect as a given age, racial and ethnic, or gender group's adjusted relative risk of institutionalization among a specific marital status group. The bar at the top of each panel represents a given age, racial and ethnic, or gender group's adjusted overall relative risk across marital status groups (i.e., effectively, the weighted average of that group's marital-status-specific relative risks). For any given group, the configuration of bars where the bottom two bars are shorter than the top bar indicates marital protection's moderating influence on that group's excess risk.
Adjusted relative risks of institutionalization for age, racial and ethnic, and gender groups by marital status in the north, 1880–1920.

Figure 4 shows high-risk age groups were quite responsive to such influence. The old were 3.4 times more likely to become institutionalized than the young across marital status groups. But among the married and the widowed, the old were 2.7 times more and 1.5 times more at risk than the young—reduced risks for the old attributable to marital protection. Among the never married, the old were nearly six times more at risk than the young. Such a large relative risk for the never-married old, a doubly high-risk group, was within expectations, though. Marital protection affected relative risks for the middle-aged in essentially the same way. It mitigated strong undesirable effects associated with being middle-aged or old on the risk of institutionalization.
Racial and ethnic groups were mostly impervious to the protective effect of marriage (figure 4). The only exception was German immigrants. They were 1.6 times more likely to become institutionalized than native whites across marital status groups. Among the never married, the married, and the widowed, Germans were twice more, 1.4 times more, and no more at risk than native whites. However, Irish immigrants were 2.3 times more at risk than native whites across marital status groups and among each marital status group. The same pattern held for “new” immigrants, though their relative risks to native whites were much smaller. British immigrants and blacks were at no higher risk than native whites across marital status groups or among each marital status group. (Hence, figure 4 does not show relative risks for the British or blacks.) Moreover, native whites were 1.5 times less likely to become institutionalized than nonnative whites (i.e., blacks and immigrants of any race and ethnicity) across marital status groups and among each marital status group. Marital protection, which could have lessened adverse effects associated with racial and ethnic minorities, mostly did not do so.
The analysis of an interaction between marital status and gender reveals a greater importance of a spouse for men than for women in preventing institutionalization (figure 4). Women were as likely to become institutionalized as men across marital status groups. Yet such overall parity masked disparities that averaged out across marital status groups. Among the married, women were 1.5 times more at risk than men. This does not mean marital protection harmed women, for the married were at lower risk than the never married both among women and among men.Footnote 22 It means the benefit of having a spouse was larger for men than for women: married men were less at risk than married women, who were less at risk than never-married women. Among the never married and the widowed, women were 1.3 times less at risk than men—that is, spouseless men were at higher risk than spouseless women. The effect of not having a spouse was more damaging to men than to women. Had married women been at lower risk than married men, women would have been less likely to become institutionalized than men across marital status groups. Yet a protective effect of a spouse, benefitting men more than women, neutralized what would have been an overall excess risk for men.
This section has found the impact of marital protection was rather modest among age, racial and ethnic, and gender groups. The effect of ethnicity presumably captures sociological dynamics in institutionalization: certain ethnic groups were at elevated risk partly because of the circumstances they were in. The effect of age, while reflecting public policy, probably conveys biological dimensions of institutionalization more strongly: certain age groups were at elevated risk partly because insanity struck them. Marital protection, while moderating the biological forces that made the middle-aged and the old susceptible to institutionalization, barely mitigated the societal forces that made white immigrants, especially the Irish, vulnerable to it. The social conservatism of marital protection was also obvious in gender disparities among marital status groups. Women were less at risk among the widowed (and the never married) but more at risk among the married than were men. Such a seemingly irregular manifestation of marital protection was actually consistent with the normal operation of gender relations, which pivoted on the primacy of the husband. The protective effect of marriage reflected and reinforced social hierarchies that presumably underlay differential risks of institutionalization among gender and racial and ethnic groups.
Mental Hospital Patients in the History of the Mental Hospital
How does the preceding analysis of mental hospital patients improve the prevailing understanding of the history of the mental hospital? In this concluding section, this article examines the competing characterizations of the patients put forth in the field's marquee debate on the nature of the mental hospital. It first assesses the two rival camps’ demographic analyses of the patients that underpin their characterizations as victims or beneficiaries of the mental hospital. However, it recognizes the futility of declaring one camp's characterization more accurate than the other's when each camp focuses only on those demographic traits of the patients that fit its interpretation of the mental hospital. Instead, this article weaves the traits Grob considers reflective of the mental hospital's humanitarianism and the ones Rothman, most influential of the historians critical of the mental hospital, deems indicative of its repressiveness into a multidimensional demographic portrayal of the patients.
Neither camp considers gender a risk factor of institutionalization. Neither Grob nor Fox finds a gender imbalance in the patient population (Fox Reference Fox1978: 123; Grob 1994b: 90). In Women and Madness, Phyllis Chesler asserts “women of all classes and races constitute[d] the majority of the psychiatrically involved population in America” in the 1960s (1997 [1972]: 349, 74). Yet her own data show gender parity among state and county hospital patients, who accounted for 90 percent of all institutionalized patients in 1960 (American Hospital Association 1961: 396; Chesler Reference Chesler1997 [1972]: 334, 337). This article does not find gender per se affected institutionalization, either. But it does discover that married women were more at risk than married men, while spouseless men were more at risk than spouseless women in the North from 1880 to 1920 (figure 4). Gender—in conjunction with marital status—was, in fact, a risk factor of institutionalization.
This article agrees with the two camps, especially the critics of the mental hospital, that the patients were often from lower classes. It finds laborers and unemployed men faced elevated risks of institutionalization across the country in 1880, corroborating Fox's view of the patients as “unproductive” persons in violation of bourgeois values (Fox Reference Fox1978: 174). But it also observes gainfully employed women were at much higher risk than women who kept house. Because the bourgeois values did not necessarily encourage women to be economically productive outside the home, productive women may fit Fox's interpretation. Yet the most unproductive of unproductive men, the unemployed, were far less prone to institutionalization than their susceptibility to insanity would have predicted, while productive, employed women, especially domestics and laundresses, were far more likely to become institutionalized than would have been expected from their tendency to become insane (figure 1). Such twists suggest another way by which gender indirectly—through occupation—affected the risk of institutionalization.
Neither camp has closely analyzed the marital status of the patients, probably because the consequences of insanity for the unmarried were obvious. There are only brief references to the overrepresentation of unmarried men and the widowed in the patient population in Fox's work, though many of old patients Grob discusses might have been spouseless (ibid.: 105, 117–19). While confirming elevated risks of institutionalization for the never married, this article discovers the widowed, or the previously married, were at no higher risk than the currently married in the North from 1880 to 1920 (figure 3). Such findings refine the prevailing notion of the patients as unmarried when they were typically never married, but not widowed.
The parts of the debate on the nature of the mental hospital that involve the patients boil down to how Rothman and Grob see them. Grob considers them beneficiaries of the mental hospital's humanitarianism, while Rothman treats them as victims of its repressiveness. Rothman's archetypal patients are lower-class immigrants, while Grob's are the senile old (and in each exemplar, the two descriptors overlap greatly) (Grob 1983: 181–85; Rothman 1980: 24, 350–51). This article finds that across racial and ethnic groups, the old were more likely to become institutionalized than were the young in the North from 1880 to 1920. It also discovers that across age groups, white immigrants, especially the Irish, were more likely to become institutionalized than were native whites in the North from 1880 to 1920 (figure 3; see footnote 20). Such evidence supports Rothman's and Grob's demographic descriptions of the patients.
There is also some evidence that does not fit their interpretive schemes very well. Rothman seems to overplay a repressive, quasi-prison angle because mental hospitals, supposedly detaining undesirable minorities, admitted blacks at far lower rates than they confined white immigrants in 1880.Footnote 23 However, blacks had become as much at risk of institutionalization as the Irish in the hinterland areas of the North by 1920 (figures 1 and 3). Grob seems to exaggerate a humanitarian, old-age-home aspect because the middle-aged were institutionalized at about the same rate as the old in the hinterland areas of the North from 1900 to 1920 (figure 3). The increased presence of neurologically disabled patients with somatic causes, who Grob implies were between 30 and 60 years old, in the early twentieth century might have accounted for elevated risks for the middle-aged (1983: 189). But these qualified ambiguities do not detract much from Rothman's or Grob's conception of the patients as victims or beneficiaries of the mental hospital.
From this article's multivariate analysis, it is clear that the patients were both disproportionately foreign-born, as Rothman claims, and disproportionately old, as Grob insists. Then, according to these scholars’ interpretive schemes, the patients would also have been both victims and beneficiaries of the mental hospital at once. One may question whether immigrant or old patients necessarily indicate the repressive or humanitarian nature of the mental hospital. However, demographic traits of the patients are probably no more ambiguous a measure of the nature of the mental hospital than other indicators. Even how the patients were treated, generally regarded as a more accurate indicator than their demographic traits, can be misleading: compassionate care could have been repressive when the afflicted were confined against their will, while less-than-adequate care might have been humanitarian when they could have fared worse unless confined. Because of Rothman's and Grob's seminal influence on the debate on the nature of the mental hospital, their formulations of immigrant victims and old beneficiaries should not be dismissed without strong contrary evidence. But this article will not seek to establish the validity of such formulations beyond dispute, either, for the validity of demographic, or any other, indicators cannot be so established. Instead, using these formulations as the basis for further analysis, it will explore institutionalization patterns that can help reconcile Rothman's characterization of immigrant patients as victims of repression with Grob's characterization of old patients as beneficiaries of humanitarianism when the patient population was both heavily foreign-born and heavily old.
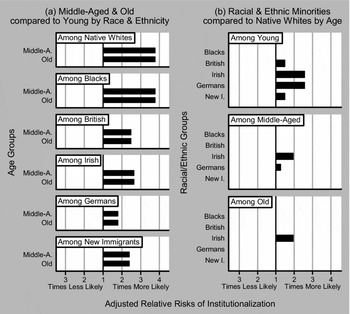
Specifically, it investigates whether the old among immigrant patients might have seemed closer to the mental hospitals’ victims and whether immigrants among old patients could have appeared closer to its beneficiaries. To this end, this article examines how the effect of age on the risk of institutionalization might have differed from one racial and ethnic group to another and how the effect of race and ethnicity might have varied from one age group to another. Figure 5 reports such joint effects of age and race and ethnicity, estimated from the previous section's data with logit models.Footnote 24 These effects are adjusted for relevant covariates as explained in footnote 24. The bar in the left column in figure 5 expresses the effect of age as a given age group's adjusted relative risk of institutionalization among a given racial and ethnic group. The bar in the right column shows the effect of race and ethnicity as a given racial and ethnic group's adjusted relative risk among a given age group. As in the previous section, all relative risks are for the North between 1880 and 1920. Figure 5 suggests Grob's and Rothman's contradictory characterizations of the patients are actually quite complementary.
Adjusted relative risks of institutionalization for age groups by race and ethnicity and for racial and ethnic groups by age in the north, 1880–1920.

Rothman infers the repressive nature of the mental hospital partly from the overrepresentation of immigrants, who symbolized the socially undesirable in his interpretive scheme, in the patient population. But he does not take into account the age composition of immigrant patients in his analysis. Figure 5 shows that among the British, the Irish, Germans, and “new” immigrants, the old (and the middle-aged) were 1.8 to 2.5 times more likely to become institutionalized than were the young. If the mental hospital had been repressive, it would have been Grob's old patients that epitomized Rothman's immigrant victims.
But among immigrant patients, Grob's old patients might not have seemed so much beneficiaries of humanitarianism as he makes them out to be. The old (and the middle-aged) were nearly four times more likely to become institutionalized than the young among native whites and blacks (figure 5). Then, it follows that relative risks for the old were 30 to 50 percent smaller among the foreign-born than among the native-born. Such institutionalization patterns suggest the mental hospital might not have been as humanitarian among the foreign-born as among the native-born. If it had provided humanitarian assistance and if the need for such services among the old (relative to that need among the young) had been the same between the native-born and the foreign-born, the old would have been less likely to become beneficiaries of the mental hospital's humanitarianism among the foreign-born than among the native-born. Among the foreign-born, the old could have been victims not of the mental hospital's repressiveness but of its nativist bias if its humanitarianism had been contingent on the nativity of the old. Of course, more research is needed to substantiate these speculations. But if they are tenable, a humanitarianism tinged with nativism, though it does not directly support Rothman's argument, can create room for his skepticism in Grob's interpretation.
Grob infers the humanitarian nature of the mental hospital partly from the overrepresentation of the old, who symbolized the disabled in need of assistance in his interpretive scheme, in the patient population. But he does not take into account the racial and ethnic composition of old patients in his analysis. Figure 5 shows that among the old, the Irish were twice more likely to become institutionalized than were other racial and ethnic minorities or native whites. If the mental hospital had been humanitarian, it would have been Rothman's immigrant patients that epitomized Grob's old beneficiaries.
But among old patients, Rothman's immigrant patients might not have seemed so much victims of repression as he makes them out to be. Among the young, the age group least prone to insanity, all white immigrant groups were at elevated risk: the Irish and Germans were 2.6 times more likely, and the British and “new” immigrants 1.5 times more likely, to become institutionalized than were native whites (figure 5). Such differentials support Rothman's argument because young foreigners are traditionally seen as a threat to the social order. Had the mental hospital functioned, in part, to control immigrants for the perceived danger their foreignness posed, their age would not have mattered much in their confinement. Yet among the middle-aged, relative risks for the Irish and Germans were much smaller, and the British and “new” immigrants were at no higher risk than native whites. Among the old, the Irish alone were more at risk than native whites. Such institutionalization patterns suggest the mental hospital might not have been as repressive among the old as among the young. Elevated risks for the Irish among the old may actually indicate the mental hospital's humanitarian response to their dire need of assistance, creating room for Grob's perspective in Rothman's interpretation.
When foreign-born patients were disproportionately old and old patients were disproportionately foreign-born (or Irish, to be precise), as shown in figure 5, neither Rothman nor Grob fully grasps mental hospital patients. If Grob's characterization of old patients is tenable, they might not have seemed beneficiaries of humanitarianism among foreign-born patients as much as they did among native-born patients. If Rothman's characterization of immigrant patients is tenable, they might not have seemed victims of repression among old patients as much as they did among young patients. Rothman's and Grob's competing characterizations of the patients can jointly capture their multidimensional complexity far better than separately. For Grob's old beneficiary had the face of Rothman's immigrant patient, and Rothman's immigrant victim had the face of Grob's old patient. The patients could have appeared both victims and beneficiaries of the mental hospital at once from a multivariate-analysis standpoint. Grob and Rothman could not have been oblivious to such twists, but neither would have been able to explore them with his univariate approach based on aggregate data.
As the binary framework of the debate on the nature of the mental hospital had become unproductive by the mid-1980s, a new generation of historians sought to transcend it. For example, in A Generous Confidence, Nancy Tomes cast institutionalization, which might have been repressive to the insane, as a humanitarian relief to their families, who would have been ruined without the services mental hospitals provided (1984). In Homes for the Mad, Ellen Dwyer showed monotony might have described the reality of life inside the mental hospital far better than either humanitarianism or repressiveness (1987). This article continues and contributes to these and other scholars’ efforts by scrambling Rothman's and Grob's formulations of immigrant victims and old beneficiaries.
This article's analysis of mental hospital patients as a complex, multifaceted population helps advance the historical scholarship of the mental hospital, where they have long been elusive. In this article's panoptic portrayal that melds their contradictory aspects, the patients were simultaneously victims and beneficiaries of the mental hospital. Such a portrayal also shows that while the Irish were at higher risk of institutionalization than native whites, the British were not; it was not generic foreignness but specific ethnicity that mattered. While certain ethnic groups were at elevated risk regardless of time and place, how likely blacks were to end up in mental hospitals depended on a specific time and place. While the never married were at higher risk than the married, the widowed were not; having adult children probably shielded the widowed from institutionalization as much as having a spouse protected the married. Although the married were at lower risk than the never married, married women were at higher risk than married men; having a spouse was more beneficial to men than to women. Although unemployment raised men's risk of institutionalization, employment outside the home increased women's. Although the old were at higher risk than the young, the middle-aged were as much at risk as the old; the threshold age to characterize the patients was not 60 but 40. Finally, groups more likely to become institutionalized than would have been expected from their susceptibility to insanity symbolized the patient population, because it was, above all, an institutionalized population. Such groups included the Irish, Germans, laborers, domestics, laundresses, and possibly the old. It is vital to understand who the patients were. For it was the sense of illegitimacy surrounding institutionalization—a lingering suspicion that it had more to do with who the insane were than with how insane they were—that contributed to the dismantling of state mental hospitals in the 1960s and 1970s, a major impetus behind a scholarly inquiry into the history of the mental hospital.
Acknowledgments
I am deeply indebted to Sally Freels, Richard M. Fried, Brian Gratton, Danielle L. Malone, Leo Schelbert, and Carol Richmond Tsang for their guidance, assistance, and encouragement. I would also like to thank the editors and anonymous reviewers at Social Science History for invaluable comments on an earlier draft. I wrote this article so that my late mentor—and friend—Daniel Scott Smith would be proud of me. I hope he is.