


Introduction
Injuries accumulate in organisms dying of ‘old age’. Oxidative reactions, often involving reactive oxygen species, are implicated in ageing (recently reviewed for plant germplasm by Leprince et al., Reference Leprince, Pellizzaro, Berriri and Buitink2017; Nagel et al., Reference Nagel, Seal, Colville, Rodenstein, Un, Richter, Pritchard, Börner and Kranner2019; Waterworth et al., Reference Waterworth, Bray and West2019; Ballesteros et al., Reference Ballesteros, Pritchard and Walters2020; Zhou et al., Reference Zhou, Chen, Luo, Dai, Yang, Zheng, Yang and Shu2020; Zinsmeister et al., Reference Zinsmeister, Leprince and Buitink2020). In dry seeds, ageing reactions affect multiple cellular components (Smith and Berjak, Reference Smith, Berjak, Kigel and Galili1995; Walters, Reference Walters1998; Rajjou et al., Reference Rajjou, Lovigny, Groot, Belghazi, Job and Job2008; Terskikh et al., Reference Terskikh, Zeng, Feurtado, Giblin, Abrams and Kermode2008; Kranner et al., Reference Kranner, Chen, Pritchard, Pearce and Birtić2011; Colville et al., Reference Colville, Bradley, Lloyd, Pritchard, Castle and Kranner2012; El-Maarouf-Bouteau et al., Reference El-Maarouf-Bouteau, Mazuy, Job and Bailly2013; Michalak et al., Reference Michalak, Barciszewska, Barciszewski, Plitta and Chmielarz2013; Kalemba and Pukacka, Reference Kalemba and Pukacka2014; Xin et al., Reference Xin, Tian, Yin, Chen, Zhang, Ng and Lu2014; Morscher et al., Reference Morscher, Kranner, Arc, Bailly and Roach2015; Nguyen et al., Reference Nguyen, Cueff, Hegedus, Rajjou and Bentsink2015; Veselova et al., Reference Veselova, Veselovsky and Obroucheva2015; deSouza-Vidigal et al., Reference deSouza-Vidigal, Willems, Van arkel, Dekkers, Hilhorst and Bentsink2016; Mira et al., Reference Mira, Hill, González-Benito, Ibáñez and Walters2016, Reference Mira, Nadarajan, Liu, González-Benito and Pritchard2019, Reference Mira, Pirredda, Martín-sánchez, Marchessi and Martín2020; Fleming et al., Reference Fleming, Richards and Walters2017, Reference Fleming, Patterson, Reeves, Richards, Gaines and Walters2018, Reference Fleming, Hill and Walters2019; Yin et al., Reference Yin, Xin, Fu, An, Wu, Chen, Zhang, He, Whelan and Lu2017; Kurek et al., Reference Kurek, Plitta-michalak and Ratajczak2019; Nagel et al., Reference Nagel, Seal, Colville, Rodenstein, Un, Richter, Pritchard, Börner and Kranner2019; Wiebach et al., Reference Wiebach, Nagel, Börner, Altmann and Riewe2020; Zhao et al., Reference Zhao, Wang, Fu and Wang2020). Sometimes ageing to death is attributed to a specific chemical change, such as oxidation of acyl double bonds in membrane lipids (Sattler et al., Reference Sattler, Gilliland, Magallanes-lundback, Pollard and DellaPenna2004; Wiebach et al., Reference Wiebach, Nagel, Börner, Altmann and Riewe2020) or accumulation of abnormal L-isoaspartyl residues in the proteome of dry seeds (Ogé et al., Reference Ogé, Bourdais, Bove, Collet, Godin, Granier, Boutin, Job, Jullien and Grappin2008). However, cause–effect relationships between changes in specific cellular components and death have always been elusive, especially as we continue to discover more cellular components damaged by time. Accordingly, we have suggested that ageing results from an accumulation of small changes; at some point, a minor change has a major lethal effect, analogous to a ‘straw that breaks the camel’s back’ (Fleming et al., Reference Fleming, Richards and Walters2017, Reference Fleming, Patterson, Reeves, Richards, Gaines and Walters2018). The distinction between possible mechanisms for ageing to death – one, specific, major event or many non-specific minor events – affects how we might detect ageing, predict longevity and reinvigorate (if possible) damaged germplasm.
Deciphering the ageing mechanism(s) of dry seeds is further complicated by our inability to pinpoint the time of death. There is a discrete period during storage when dry germplasm has and then loses the potential to complete germination (Walters, Reference Walters1998). The timing of this transition between alive and dead (i.e. longevity) varies considerably within and among species and cell types for reasons yet unknown (recently reviewed by Colville and Pritchard, Reference Colville and Pritchard2019; Ballesteros et al., Reference Ballesteros, Pritchard and Walters2020; Solberg et al., Reference Solberg, Yndgaard, Andreasen, von Bothmer, Loskutov and Asdal2020). Moreover, this transition occurs discreetly in dry seeds because we have limited tools to measure aliveness in ‘cryptobiotic’ organisms. Therefore, we learn that a dry organism perished when it does not revive upon hydration. Could hydration itself deliver the lethal blow? Early research suggesting that hydration induces ageing reaction cascades (Smith and Berjak, Reference Smith, Berjak, Kigel and Galili1995) is supported by evidence of programmed cell death metabolism in aged, imbibing seeds (Kranner et al., Reference Kranner, Birtić, Anderson and Pritchard2006; El-Maarouf-Bouteau et al., Reference El-Maarouf-Bouteau, Mazuy, Corbineau and Bailly2011; Chen et al., Reference Chen, Osuna, Colville, Lorenzo, Graeber, Kuester, Leubner-metzger and Kranner2013; Wang et al., Reference Wang, Li, Xue, Pritchard and Wang2015). Alternatively, early imbibition is a time for repairing damaged cellular components (Ogé et al., Reference Ogé, Bourdais, Bove, Collet, Godin, Granier, Boutin, Job, Jullien and Grappin2008; Waterworth et al., Reference Waterworth, Masnavi, Bhardwaj, Jiang, Bray and West2010, Reference Waterworth, Footitt, Bray, Finch‐savage and West2016, Reference Waterworth, Bray and West2019; Rajjou et al., Reference Rajjou, Duval, Gallardo, Catusse, Bally, Job and Job2012; Sano et al., Reference Sano, Rajjou, North, Debeaujon, Marion-poll and Seo2016) or activating transcription, translation and post-translational modifications essential for germination (Rajjou et al., Reference Rajjou, Duval, Gallardo, Catusse, Bally, Job and Job2012; Bai et al., Reference Bai, Peviani, van der Horst, Gamm, Snel, Bentsink and Hanson2017; Yin et al., Reference Yin, Wang and Komatsu2018; Galland et al., Reference Galland, Huguet, Arc, Cueff, Job and Rajjou2014; Sano et al., Reference Sano, Rajjou and North2020; Zhou et al., Reference Zhou, Chen, Luo, Dai, Yang, Zheng, Yang and Shu2020). Conceivably, death may occur when repair pathways take precedence over seedling development pathways (Masubelele et al., Reference Masubelele, Dewitte, Menges, Maughan, Collins, Huntley, Nieuwland, Scofield and Murray2005; Rosental et al., Reference Rosental, Nonogaki and Fait2014; Dirk and Downie, Reference Dirk and Downie2018; Cai et al., Reference Cai, Kim, Li, Zhou and Wang2020; Sano et al., Reference Sano, Rajjou and North2020).
This paper focuses on transcription in dry-stored seeds as an essential component of germination potential (GP) (Rajjou et al., Reference Rajjou, Duval, Gallardo, Catusse, Bally, Job and Job2012; Bai et al., Reference Bai, Peviani, van der Horst, Gamm, Snel, Bentsink and Hanson2017; Dirk and Downie, Reference Dirk and Downie2018). Our study assesses the transcriptome of aged, imbibed seeds, compared to our earlier studies, where we examined the transcriptome of aged, dry seeds. Numerous studies show continuous, possibly linear, degradation of RNA with time in dry storage (El-Maarouf-Bouteau et al., Reference El-Maarouf-Bouteau, Mazuy, Job and Bailly2013; Fleming et al., Reference Fleming, Richards and Walters2017, Reference Fleming, Patterson, Reeves, Richards, Gaines and Walters2018, Reference Fleming, Hill and Walters2019; Sano et al., Reference Sano, Rajjou and North2020; Walters et al., Reference Walters, Fleming, Hill, Dorr and Richards2020; Zhao et al., Reference Zhao, Wang, Fu and Wang2020), which links rates of RNA degradation and longevity. However, correlation of mortality with degradation of a specific amount of total RNA or mRNA, or a specific transcript, was not demonstrated for dry seeds (Fleming et al., Reference Fleming, Richards and Walters2017, Reference Fleming, Patterson, Reeves, Richards, Gaines and Walters2018). We, therefore, explore the possibility of a ‘death signature’ in aged seeds during hydration. In particular, we looked for up- or down-regulation of a total of 3,492 ‘germination genes’. The subset of genes with changed regulation included transcription factors implicated in soybean seed longevity, enzymes critical for DNA repair (including PIMT, PARP, DNA ligases and cyclins), homologs of genes required for germination in Arabidopsis (ABI3, HSFA9, PEPCK and TIM), endo-beta-mannanases, LEAs and enzymes involved in fermentation, lipid degradation, sugar metabolism, protein biosynthesis and protein homeostasis (reviewed by Bellieny-Rabelo et al., Reference Bellieny-Rabelo, DeOliveira, da Silva Ribeiro, Costa, Oliveira and Venancio2016b; Pereira-lima et al., Reference Pereira-Lima, Buitink, Lalanne, Rossi, Pelletier, Amaral da Silva and Leprince2017; Cai et al., Reference Cai, Kim, Li, Zhou and Wang2020; Sano et al., Reference Sano, Rajjou and North2020; Zinsmeister et al., Reference Zinsmeister, Leprince and Buitink2020; Zhou et al., Reference Zhou, Chen, Luo, Dai, Yang, Zheng, Yang and Shu2020; also references in this paper).
We hypothesized that imminent death would be reflected by differences in expression of key ‘germination genes’ in healthy and dying seeds. We predicted down-regulation of key transcripts in dying seeds because the transcripts might be preferentially fragmented during dry storage (Fleming et al., Reference Fleming, Richards and Walters2017, Reference Fleming, Patterson, Reeves, Richards, Gaines and Walters2018, Reference Fleming, Hill and Walters2019) and enzymatically degraded during imbibition. We also postulated that de novo transcription, which could replace degraded transcripts, would be impaired by damage suffered by transcriptional machinery during storage.
Radicle emergence occurs in healthy soybean seeds about 24 hours after the start of imbibition (HAI). We compared transcriptomes of dry and 24-h-imbibed embryonic axes among three cohorts from a unique collection of Williams 82 seeds harvested and stored cold and dry since 1988: one cohort was mostly vigorous, one was mostly dead, and one exhibited signs of rapid viability loss (Fleming et al., Reference Fleming, Richards and Walters2017; Walters et al., Reference Walters, Fleming, Hill, Dorr and Richards2020). A cotyledon greening assay was used to assess germination capacity in the dying cohort, which had nearly equal proportions of viable and inviable seeds. A further comparison to a time course conducted in the first 24 hours of imbibition, using healthy soybean seeds, clarified whether transcriptomes of dead or dying seeds were abnormal (Bellieny-Rabelo et al., Reference Bellieny-Rabelo, DeOliveira, Da silva ribeiro, Costa, Oliveira and Venancio2016a). Instead of the predicted down-regulation of key transcripts, we found strong evidence that axes that could not complete germination still actively transcribed ‘germination genes’, but at a much slower pace.
Materials and methods
Plant material
Soybean (Glycine max (L.) Merr, cv. ‘Williams 82’) seeds are part of a legacy collection of cohorts harvested between 1988 and 2019 (Fleming et al., Reference Fleming, Richards and Walters2017). Seeds were received 3–6 months after harvest, and germination percentages were high (between 98 and 100%) for all cohorts. Seeds were stored at 5 °C in sealed bags in a refrigerator with a measured humidity ranging from 30 to 50% relative humidity (RH) during the experiment. Under these conditions, germination percentages tend to decline after about 10–15 years (Walters et al., Reference Walters, Fleming, Hill, Dorr and Richards2020). For this study, we selected cohorts that either showed no evidence of ageing (harvested in 2015, referred to hereafter as ‘2015H’), rapid viability loss (harvested in 1999, ‘1999H’) and severe ageing (harvested in 1996, ‘1996H’), which correspond to 3, 19 and 22 years in storage, respectively. About half of the 1996H cohort was dead by 2008 (P50 = 12 years), and nearly all were dead by 2013 (data not presented). The 1999H cohort began exhibiting symptoms of ageing in 2014 and 2015 assays (data not presented).
Viability assessments
Seed cohorts were monitored for viability annually or biennially using germination assays. Germination assays occurred in 2017, 2018 and 2019 and flanked the time that RNA was extracted in 2018. Monitor tests consisted of about 50–200 seeds that were prehydrated overnight at near 100% RH, then rolled in wet paper towels (Anchor Paper Co., St Paul, MN, USA) and incubated in the dark at 25 °C for seven days. Seedlings were scored for normal germination following AOSA criteria (AOSA, 2012); radicle length was also measured to assess vigour.
We associated cotyledon greening with embryonic axis growth in all cohorts, especially in 1999H seeds. The reliability of this method was tested in a number of cohorts. Embryonic axes were separated from cotyledons of both dry seeds and seeds imbibed in the dark for 24 hours. To check the viability of the embryonic axes, excised axes were placed on Murashige and Skoog basal media or on dampened paper with axes considered viable if they germinated in culture or expanded at least 2 cm on paper within 2–3 days after imbibition. Cotyledons were imbibed on paper in the dark for 24 hours, then placed in transparent plastic boxes in room light for 3–4 days and scored for whether they remained yellowish white, greened on the flat cotyledon surface or greened throughout. Thorough cotyledon greening invariably occurred in recently harvested cohorts, in which axes readily germinated (on nutrient medium) or expanded (on paper). Cotyledon greening rarely occurred in low-germinating cohorts stored for at least 22 years. In cohorts that had a mixed population of germinable and non-germinable seeds (such as 1999H), cotyledon greening provided a reliable marker of which axes were able to expand.
To compare germination speed among cohorts, time courses for water uptake, axis growth and cotyledon greening were developed. Seeds rolled in wet paper towels (20–25 rolls containing 25–30 seeds each) were sampled every 2–8 hours for radicle emergence, cotyledon and axis fresh mass and axis dry mass; dry mass was measured after heating axes at 95 °C for 2 days. Seeds were considered germinated when radicles elongated >2 mm from the testa. Cotyledons that were severed from axes at each time point were placed in light and observed periodically for colour changes. For each roll, germination proportions were calculated as the number of germinated seeds divided by the number of seeds in the roll.
RNA extraction, characterization and sequencing
In 2018, we extracted RNA from embryonic axes for transcriptome sequencing. Seeds were prehydrated overnight at near 100% humidity and then imbibed at 25 °C in the dark. Embryonic axes were excised at the cotyledonary node 24 HAI, leaving the plumule attached to the cotyledon. A total of 20 axes were excised from 1996H and 2015H seeds, and 60 axes were excised from 1999H seeds. Each axis was flash-frozen in liquid nitrogen and stored at −80 °C. To estimate GP, cotyledons were kept moist in constant room-light conditions (cool white fluorescent lights). At 72 HAI (48 hours of cotyledon light exposure), each cotyledon was examined for greening, presence of microbial contamination and plumule elongation. Based on this response, each excised axis was categorized as viable (1999H and all 2015H) or inviable (1999H and all 1996H).
Embryonic axes, excised from dry (0 HAI) and hydrated (24 HAI) seeds, were ground individually to a fine powder in a Retsch (Haan, Germany) Bead Mill under liquid nitrogen in microcentrifuge tubes containing 1 mg of polyvinylpyrrolidone-40 (Fisher Scientific, Fair Lawn, NJ, USA). RNA was extracted from each ground axis using the Qiagen (Hilden, Germany) Plant RNeasy kit following the recommended protocol, with the additional step of repeating the final wash with 500 µL of buffer RPE to reduce guanidine hydrochloride contamination.
RNA yield was quantified using a Nanodrop 1000 spectrophotometer (Thermo Fisher Scientific, Wilmington, DE, USA). Samples were diluted to 1 ng µL−1 of nucleic acids in nuclease-free water. Integrity of diluted RNA was quantified on an Agilent (Waldbronn, Germany) Bioanalyzer, using Agilent RNA 6000 Pico chips and the Plant RNA Pico assay (Agilent 2100 Expert software version B.02.08.SI648 R3), following the manufacturer’s protocols. The five axes for each combination of cohort (1996H, 1999H, 2015H), imbibition time (0–24 hours) and viability category (for 1999H imbibed axes) were selected for sequencing on the basis of their RNA Integrity Numbers (RINs); axes with the highest RINs were used to prevent RNA quality from confounding data analysis.
Total RNA was submitted to the University of Delaware Sequencing and Genotyping Center. After poly-A selection, 1 µL of a 1:50 dilution of ERCC Spike-In mix (Ambion, Thermo Fisher Scientific, Wilmington, DE, USA) was added to each sample. All libraries were pooled and sequenced on two lanes of an Illumina (San Diego, CA, USA) HiSeq with 250 bp paired-end reads. The sequencing dataset for Williams 82 axes from 1996H, 1999H and 2015H cohorts is referred to hereafter as the ‘storage time experiment’.
Transcriptome data from the storage time experiment were compared with RNA-seq data collected for healthy soybean axes of cv. ‘BRS 284’ at 0, 3, 6, 12 and 24 HAI (Bellieny-Rabelo et al., Reference Bellieny-Rabelo, DeOliveira, Da silva ribeiro, Costa, Oliveira and Venancio2016a). All 50 datasets from this experiment were downloaded from the Sequence Read Archive using SRA Explorer (sra-explorer.info) and project accession number PRJNA326110. This sequencing dataset is referred to hereafter as the ‘imbibition time experiment’. All analyses were conducted on both the storage time and imbibition time experiments simultaneously.
Identifying significantly differentially expressed transcripts
Adapters were trimmed from all reads with CutAdapt v. 2.5 (Martin, Reference Martin2011), and any reads < 15 bp were excluded. Reads were aligned to the most recent soybean reference transcriptome (Gmax_508_Wm82.a4.v1.transcript.fa; Joint Genome Institute, Phytozome) using hisat2 v. 2.1.0 (Kim et al., Reference Kim, Paggi, Park, Bennett and Salzberg2019) with standard parameters and converted to indexed BAM files using SAMtools v. 1.9 (Li et al., Reference Li, Handsaker, Wysoker, Fennell, Ruan, Homer, Marth, Abecasis and Durbin2009). The number of reads associated with each transcript (counts) was extracted from indexed BAM files using the SAMtools function ‘idxstats’ (Tables S1 and S2). Differential expression of transcripts in imbibed versus dry samples was identified in R (R Core Team, 2018) using edgeR v. 3.26.8 (Robinson et al., Reference Robinson, McCarthy and Smyth2010; McCarthy et al., Reference McCarthy, Chen and Smyth2012). Imbibed samples were compared to the dry (0 h) controls from their respective experiment (storage time or imbibition time). Before calculating differential expression, lowly expressed transcripts were automatically identified and removed from further consideration using the filterByExpr function, and libraries were normalized based on library size using the calcNormFactors function. Transcripts were considered significantly differentially expressed (SDE) when |log2 fold-change (FC) in expression| ≥ 2 and adjusted p-value < 0.001 (Tables S3 and S4).
Functional characterization and transcriptome clustering
An X4 MapMan v. 3.6.0RC1 (Thimm et al., Reference Thimm, Bläsing, Gibon, Nagel, Meyer, Krüger, Selbig, Müller, Rhee and Stitt2004) mapping for soybean was generated with Mercator4 v.2 (Schwacke et al., Reference Schwacke, Ponce-soto, Krause, Bolger, Arsova, Hallab, Gruden, Stitt, Bolger and Usadel2019). Transcripts were automatically assigned to annotation bins (Table S5), which were then used to assess over-representation of annotations within similarly expressed clusters of transcripts (see below). Log2FC values for SDE transcripts in a given treatment were visualized using the ‘X4.1 Metabolism overview R1.0.xml’ map.
Heatmaps were generated in R using pheatmap v. 1.0.12 (Kolde, Reference Kolde2019) to cluster experimental treatments and transcripts by expression values. Log2FC values were converted to z-scores [z = (x – µ)/σ, where x is the observed value, µ is the sample mean, and σ is the sample standard deviation] before plotting, confining values to the same scale for each transcript. A negative z-score indicates that log2FC for that transcript in that sample was lower than the mean across all samples. As the imbibition time experiment used much deeper coverage than the storage time experiment, z-score transformation was done independently for each experiment.
Any transcript identified as SDE in the storage time experiment was included in the heatmap (19,340 transcripts). Transcripts were clustered using z-score-transformed log2FC values from the storage time experiment, calculating the distance matrix with Euclidean distance and using the complete linkage method for hierarchical clustering (Table S6). Experimental groups (no-, low- and high-GP 24 HAI [storage time experiment] as well as 3, 6, 12 and 24 HAI [imbibition time experiment]) were clustered with the same clustering parameters, using z-score transformed values from all experiments.
After clustering, a two-proportion z-test was performed to identify which MapMan annotation categories were over- or under-represented in each cluster of transcripts. This test compares the abundance of a category within a cluster to the abundance of that category in the entire population of SDE transcripts. A Bonferroni-corrected alpha level of 0.0003 (= 0.05/174) was used to determine categories with significant over- or under-representation within a cluster (Table S7).
‘Germination genes’
A literature survey was performed to identify genes important for germination. Most genes were characterized in Arabidopsis; Glycine max homologs to Arabidopsis genes were identified using TAIR (arabidopsis.org). In Soybase (soybase.org/correspondence), gene IDs were converted from genome version a2 to a4 and paralogous genes within the Glycine max genome were identified. In some cases, only a general class was identified (e.g. ‘fermentation’), which could always be matched to a MapMan annotation bin. Expression of all genes within the bin was examined (Table S8). The expression of 5,712 transcripts (corresponding to 3,492 ‘germination genes’) that were SDE in any GP category was visualized with pheatmap using the same z-score adjustment and clustering parameters described above (Table S9).
Results
Seed health
Germination time course and cotyledon greening assays
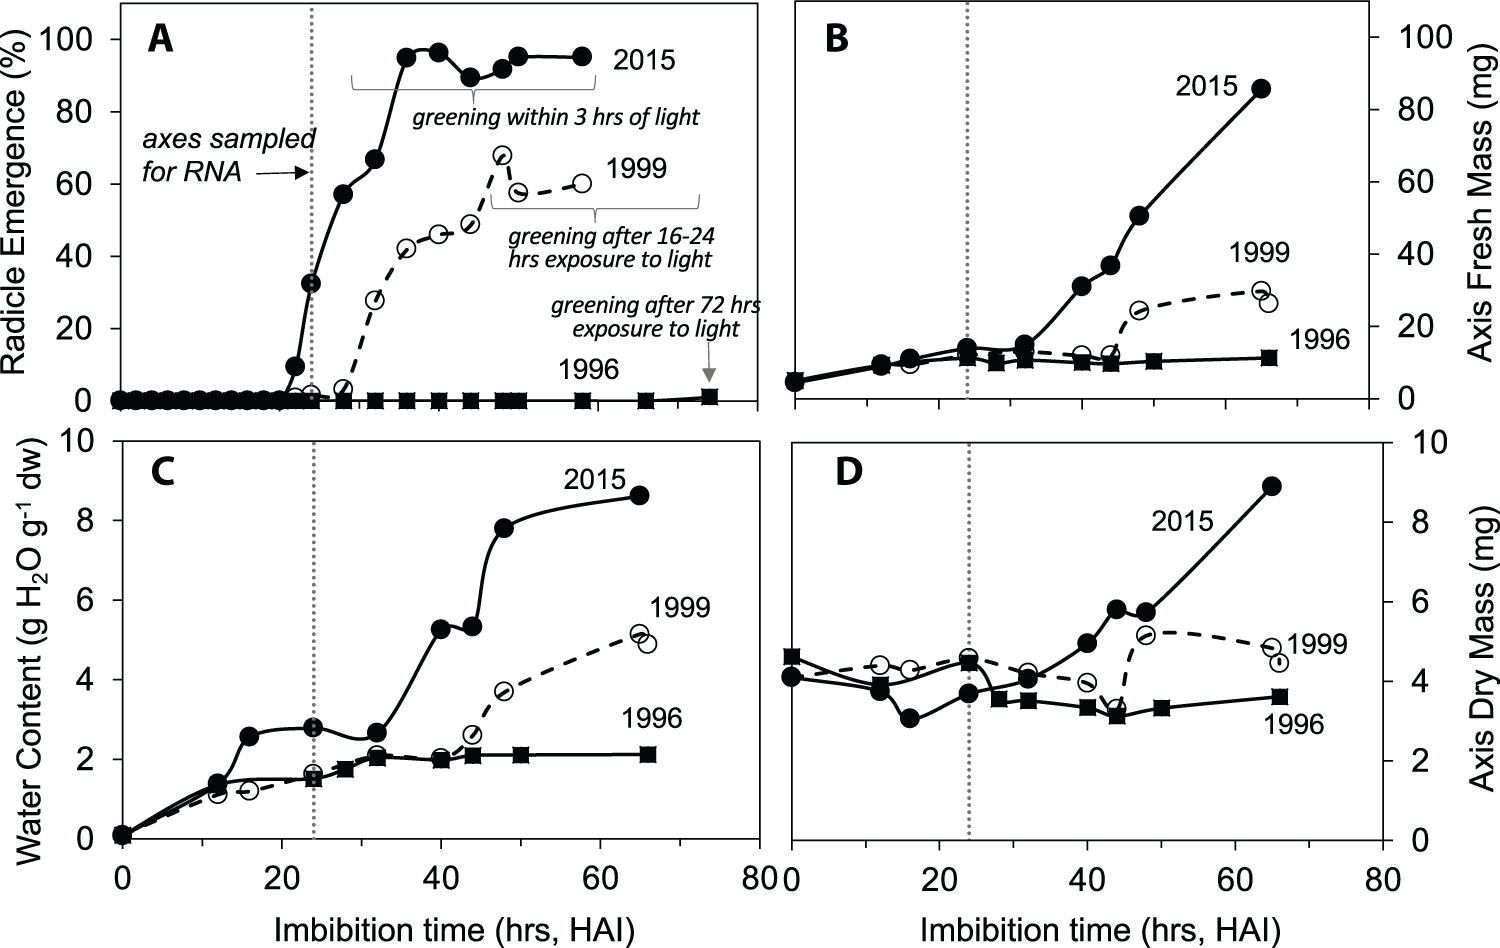
Germination percentages, measured four times between 2017 and 2019, were 98–99% (2015H), 60–90% (1999H) and 0–3% (1996H) corresponding to 3, 19 and 22 years in storage, respectively. A germination time course, conducted in 2019, revealed the timing of germination events during imbibition, which indicated the health of the cohort as well as individual seeds. Radicle emergence was first observed 22 HAI in the 2015H and 1999H cohorts, though at different proportions (9 and 1%, respectively) (Fig. 1A). Within 36 HAI, radicles emerged from 95 to 42% of seeds from the 2015H and 1999H cohorts, respectively, compared to 0% in the 1996H cohort. By 72 HAI, total germination of 95, 64 and 1% was observed for 2015H, 1999H and 1996H cohorts, respectively. Water content increased for all cohorts over 12 hours, from 0.076–0.096 g H2O g−1 dry weight (dw) to 1.2–1.4 g H2O g−1 dw (Fig. 1B). Rapid increases in water uptake and fresh mass occurred at 32 and 42 HAI for 2015H and 1999H axes, respectively, and were not observed for 1996H axes (Fig. 1B,C). Axes from the 2015H cohort began to accumulate dry matter 32 HAI, but this capacity was weakly or not observed in 1999H or 1996H axes even 66 HAI (Fig. 1D).
Markers of germination capacity in imbibing soybean (cv. ‘Williams 82’) seeds harvested in 2015 (filled circles), 1999 (open circles, dashed curve) and 1996 (filled squares). Data reflect % radicle emergence (A), axis water content (B), and axis fresh (C) and dry (D) mass measured at indicated times for separate damp paper towel rolls containing 20–30 seeds incubated at 25 C. The dotted vertical line indicates the timing of RNA extraction of isolated axes and light exposure of corresponding cotyledons.

Figure 1 Long description
The image A showing a line graph with the text a. The vertical axis label is Radicle Emergence (percent). The horizontal axis label is Imbibition time (hrs, HAI). The horizontal axis range is 0 to 80. The vertical axis range is 0 to 100. A vertical dotted line is drawn near 24 on the horizontal axis. Text near the left reads axes sampled for RNA. Series labels shown near the right are 2015, 1999, 1996. Marker and line styles: 2015 uses filled circles with a solid line; 1999 uses open circles with a dashed line; 1996 uses filled squares with a solid line. Additional text reads greening within 3 hrs of light, greening after 16 to 24 hrs exposure to light and greening after 72 hrs exposure to light. Trend description: the 2015 series stays near 0 percent up to around 20 to 24 hours, then rises steeply to near the upper part of the axis and remains near a high plateau through later times. The 1999 series stays near 0 percent through around 24 hours, then rises gradually to a midrange level and levels off later. The 1996 series stays near 0 percent across the full time range. Readable plotted coordinate pairs are not clearly shown as numeric point labels. The image B showing a line graph with the text b. The vertical axis label is Water Content (g H2O g superscript minus 1 dw). The horizontal axis label is Imbibition time (hrs, HAI). The horizontal axis range is 0 to 80. The vertical axis range is 0 to 10. A vertical dotted line is drawn near 24 on the horizontal axis. Series labels shown near the right are 2015, 1999, 1996. Marker and line styles match image A: 2015 filled circles with solid line; 1999 open circles with dashed line; 1996 filled squares with solid line. Trend description: all three series rise from near 0 at the start to around 2 by about 20 to 30 hours. After about 30 hours, the 2015 series increases sharply to a higher level and reaches the highest values by the end of the time range. The 1999 series increases more gradually to a midrange level by the end. The 1996 series remains near a low, nearly flat level after the early rise. Readable plotted coordinate pairs are not clearly shown as numeric point labels. The image C showing a line graph with the text c. The vertical axis label is Axis Fresh Mass (mg). The horizontal axis label is Imbibition time (hrs, HAI). The horizontal axis range is 0 to 80. The vertical axis range is 0 to 100. A vertical dotted line is drawn near 24 on the horizontal axis. Series labels shown near the right are 2015, 1999, 1996. Marker and line styles match image A. Trend description: the 2015 series increases over time and shows the largest rise after about 30 to 40 hours, reaching the highest values by the last time point. The 1999 series increases modestly after about 40 hours and remains well below the 2015 series. The 1996 series stays near a low level with little change across the time range. Readable plotted coordinate pairs are not clearly shown as numeric point labels. The image D showing a line graph with the text d. The vertical axis label is Axis Dry Mass (mg). The horizontal axis label is Imbibition time (hrs, HAI). The horizontal axis range is 0 to 80. The vertical axis range is 0 to 10. A vertical dotted line is drawn near 24 on the horizontal axis. Series labels shown near the right are 2015, 1999, 1996. Marker and line styles match image A. Trend description: the 2015 series varies around the midrange early, then increases after about 40 hours and reaches the highest values by the end. The 1999 series stays around the midrange with a smaller rise around the middle of the time range, then remains below the 2015 series. The 1996 series stays near a lower, nearly flat level across the time range. Readable plotted coordinate pairs are not clearly shown as numeric point labels.
The cotyledon greening assay reliably indicated axes that would and would not elongate, and cotyledon attachment was not required for axis expansion or cotyledon greening (Fig. S1). Greening was rapid in 2015H seeds, usually occurring after 3 hours of light exposure (data not shown). Greening took longer in 1999H seeds (data not shown) and rarely occurred in 1996H seeds.
RNA integrity among seed cohorts
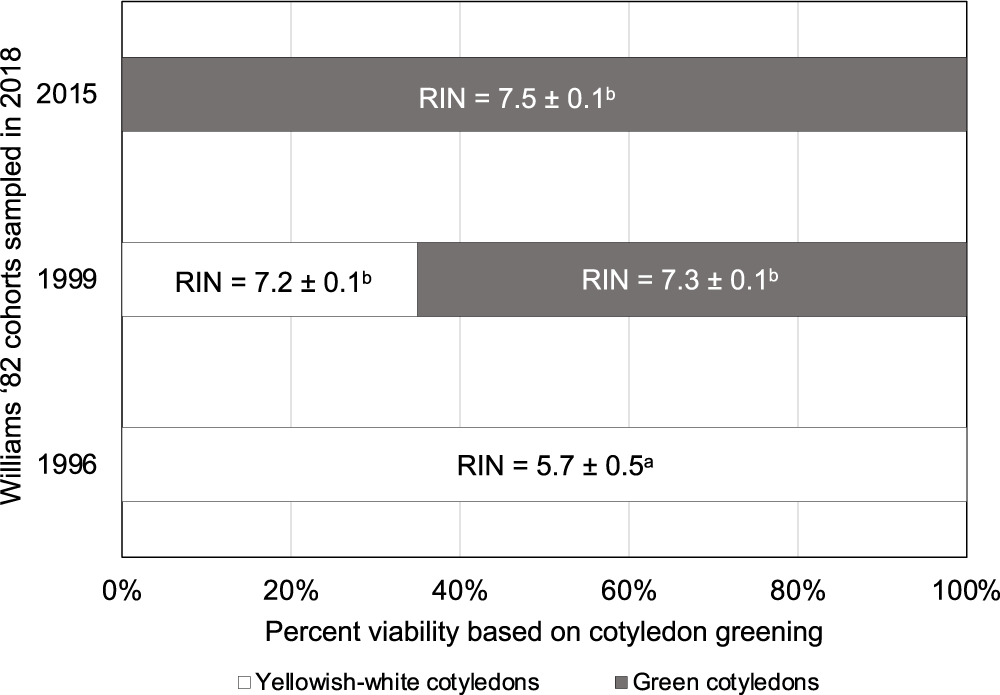
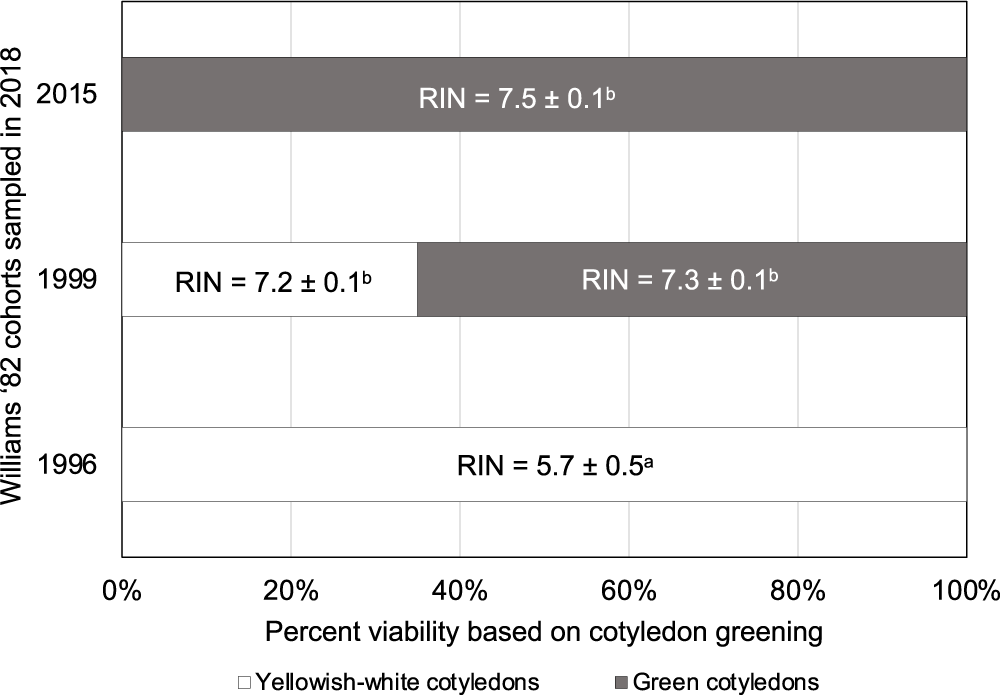
RNA was extracted in 2018 from dry (0 h) and imbibed (24 h) embryonic axes, providing data for seeds stored for 3, 19 and 22 years. Notably, there was no change in RINs upon imbibition (p > 0.05, Tukey’s HSD, Fig. 2, Table S10). RINs were similar for 2015H and 1999H axes, regardless of the greening response of their corresponding cotyledons (p > 0.05, Tukey’s HSD). RINs were significantly lower for 1996H axes compared to the 1999H and 2015H cohorts (p < 0.05, Tukey’s HSD) (Fig. 2).
RNA integrity, as measured by RIN (Schroeder et al., Reference Schroeder, Mueller, Stocker, Salowsky, Leiber, Gassmann, Lightfoot, Menzel, Granzow and Ragg2006) of five excised embryonic axes from different soybean (cv. ‘Williams 82’) cohorts imbibed for 24 hours. Shaded boxes represent the proportion of 100, 200, and 100 axes for 2015H, 1999H and 1996H cohorts, respectively, in which corresponding cotyledons greened (indicating positive germination capacity of axes). Values in each bar represent the average RIN ± standard deviation for each cohort and viability class. RINs marked with different superscript letters are significantly different at p < 0.05 (see Table S2 for details).
Consistent with the RINs, electropherograms from imbibed 2015H and 1999H axes were mostly indistinguishable, showing typical patterns of high-integrity plant RNA, with two prominent peaks for the 18S and 25S rRNA subunits, minor peaks for the 5S rRNA subunit and plastid rRNAs and an absence of prominent peaks in the ‘fast’ region (27.25–41 s) (Fig. S2). Electropherograms from 1996H dry and imbibed axes had reduced 25S peaks relative to 18S peaks, as well as more prominent peaks in the ‘fast’ region, indicating RNA fragmentation as reported previously (Fig. S3) (Fleming et al., Reference Fleming, Richards and Walters2017, Reference Fleming, Patterson, Reeves, Richards, Gaines and Walters2018, Reference Fleming, Hill and Walters2019).
Transcriptome overview
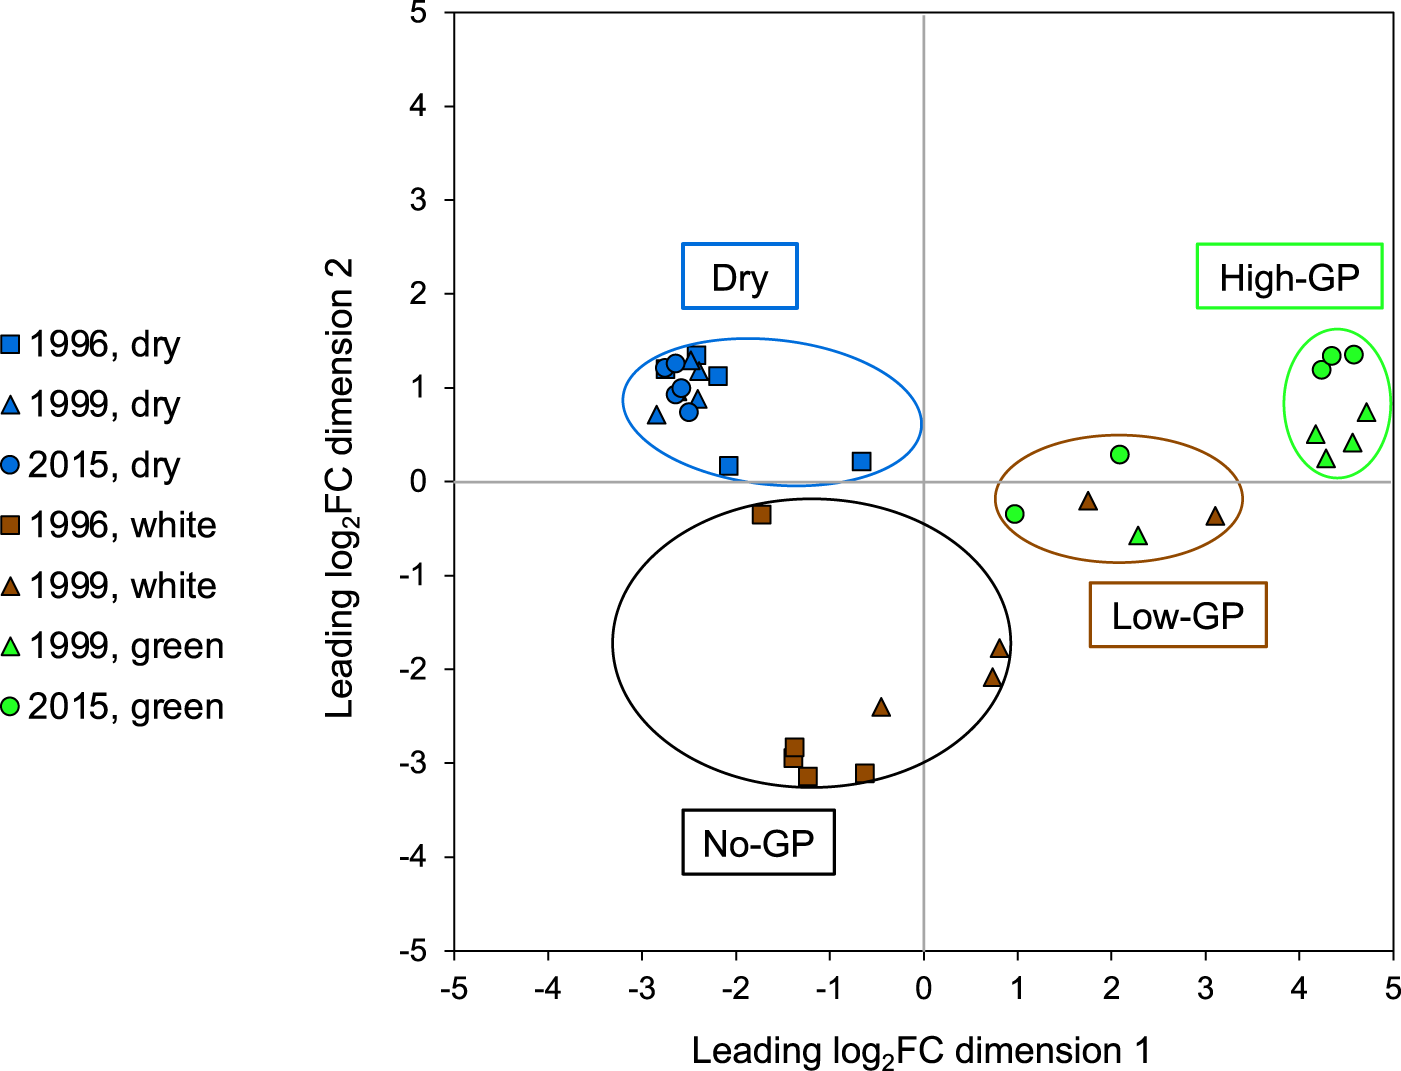
Global differences in log2FC expression among transcriptome libraries from individual embryonic axes were compared in a multidimensional scaling plot (Fig. 3). Axes separated into four clusters corresponding to dry axes (all cohorts), axes from seeds with green cotyledons (‘high GP’, 1999H and 2015H), axes from seeds with white cotyledons (‘no-GP’, 1996H and 1999H) and a fourth group including axes from both 2015H and 1999H seeds having white or green cotyledons. This intermediate cluster, named ‘low-GP’, was spatially separated from the high-GP and no-GP clusters and was treated separately in subsequent analyses.
A multi-dimensional scaling (MDS) plot summarizing relationships between transcriptomes, where each point represents the transcriptome from a single dry (blue symbols) or imbibed (green or brown symbols) soybean (cv. ‘Williams 82’) embryonic axis, and proximity indicates higher similarity. Imbibed axes have corresponding cotyledons that did or did not green, indicated by green and brown symbols, respectively. Seed cohort is represented by circles (2015H), triangles (1999H) and squares (1996H). Axes clearly separated based on dry/imbibed. Imbibed axes sorted into three groups based on cotyledon colour, interpreted as representing the entire seed’s likely germination potential (GP): all white cotyledons (no-GP), all green cotyledons (high-GP), and a mixture of white and green cotyledons (low-GP).
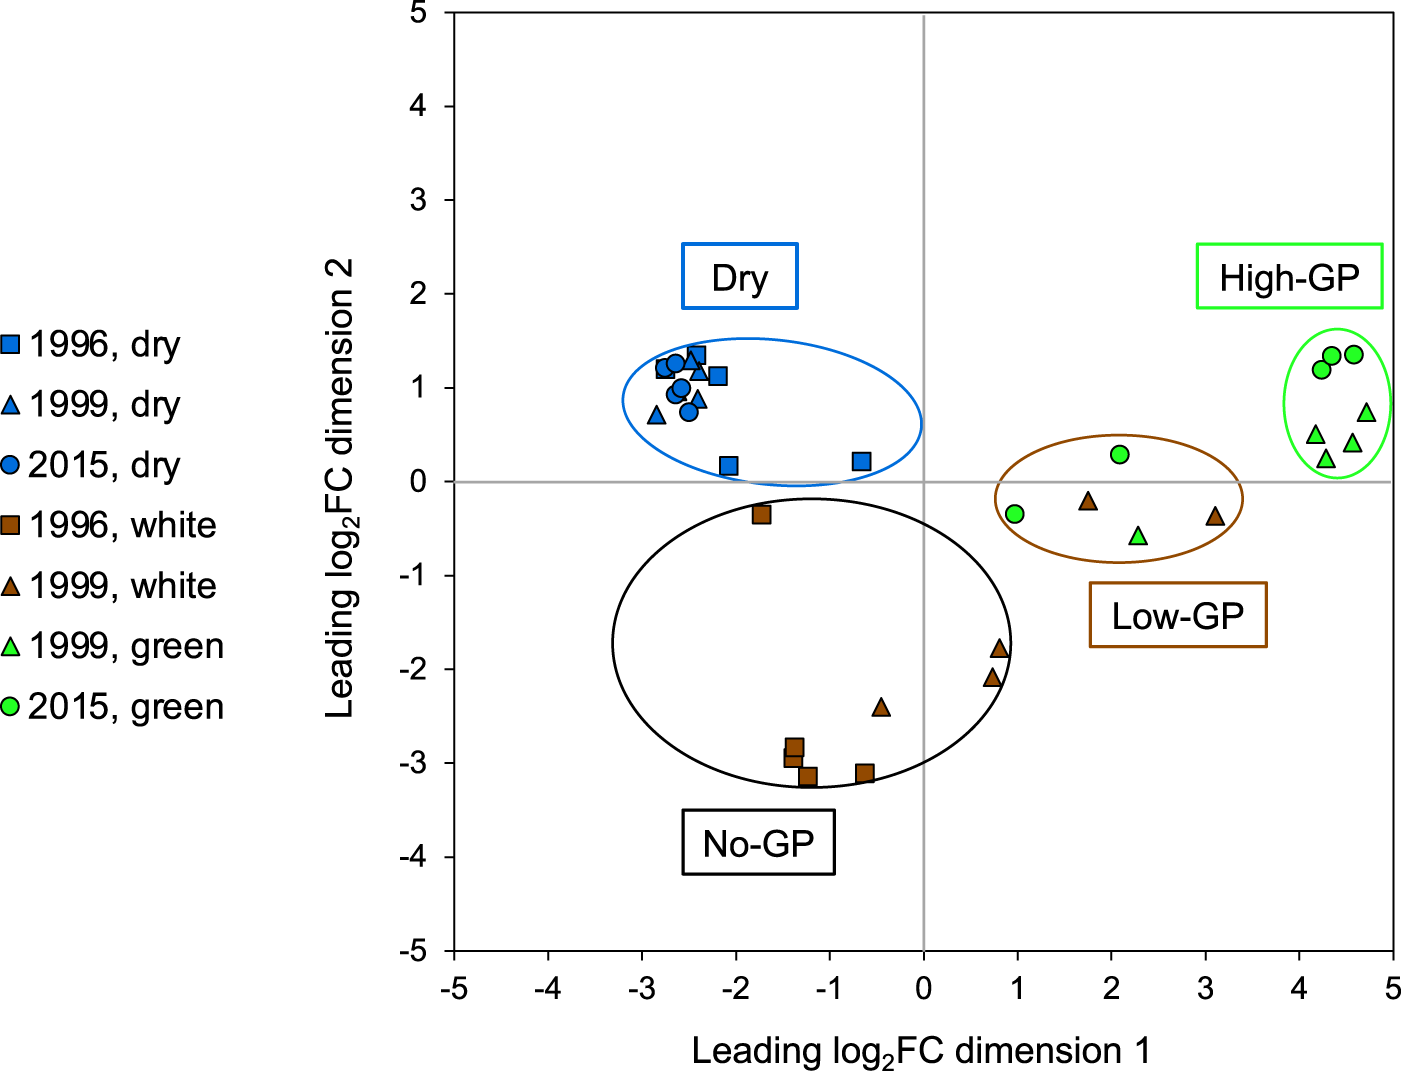
Figure 3 Long description
The horizontal axis label is “Leading log2FC dimension 1” with tick labels from negative 5 to 5. The vertical axis label is “Leading log2FC dimension 2” with tick labels from negative 5 to 5. A vertical reference line is drawn at 0 on the horizontal axis and a horizontal reference line is drawn at 0 on the vertical axis. A legend lists seven categories with marker shapes: “1996, dry” (square), “1999, dry” (triangle), “2015, dry” (circle), “1996, white” (square), “1999, white” (triangle), “1999, green” (triangle) and “2015, green” (circle). Four labeled group regions are drawn as ellipses with nearby text labels: “Dry”, “No-GP”, “Low-GP” and “High-GP”. The “Dry” ellipse encloses a cluster of points with horizontal axis values around negative 3 to about negative 1 and vertical axis values around 0 to about 1.5. Within this ellipse, multiple points are tightly grouped near horizontal axis values around negative 2.5 to negative 2 and vertical axis values around about 0.8 to 1.3, with two points closer to the horizontal axis near vertical axis values around 0. The “No-GP” ellipse encloses points with vertical axis values mostly below 0, including several points near vertical axis values around negative 3, with horizontal axis values around negative 2 to about 0. One point appears near horizontal axis around negative 2 and vertical axis around negative 0.5. Additional points appear near horizontal axis around negative 0.5 to 0 and vertical axis around negative 2 to negative 1.5. The “Low-GP” ellipse encloses a small set of points with horizontal axis values around 1 to about 3.5 and vertical axis values around negative 1 to about 0.5. The “High-GP” ellipse encloses a cluster of points with horizontal axis values around 4 to about 5 and vertical axis values around 0 to about 1.5. Point density is highest within the “Dry” ellipse and within the “High-GP” ellipse, where several markers are close together. The plotted points are separated into the four labeled ellipse regions across the two axes.
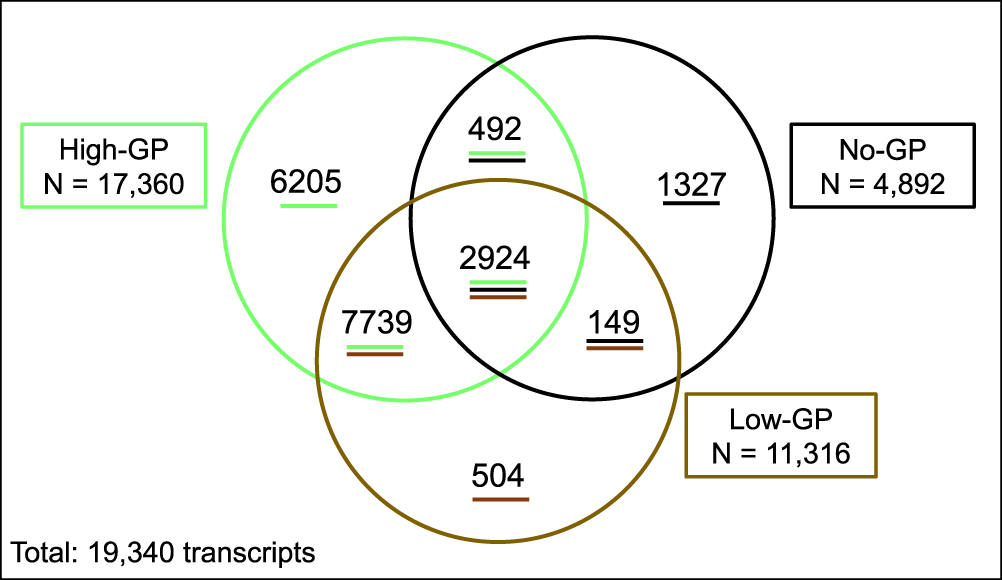
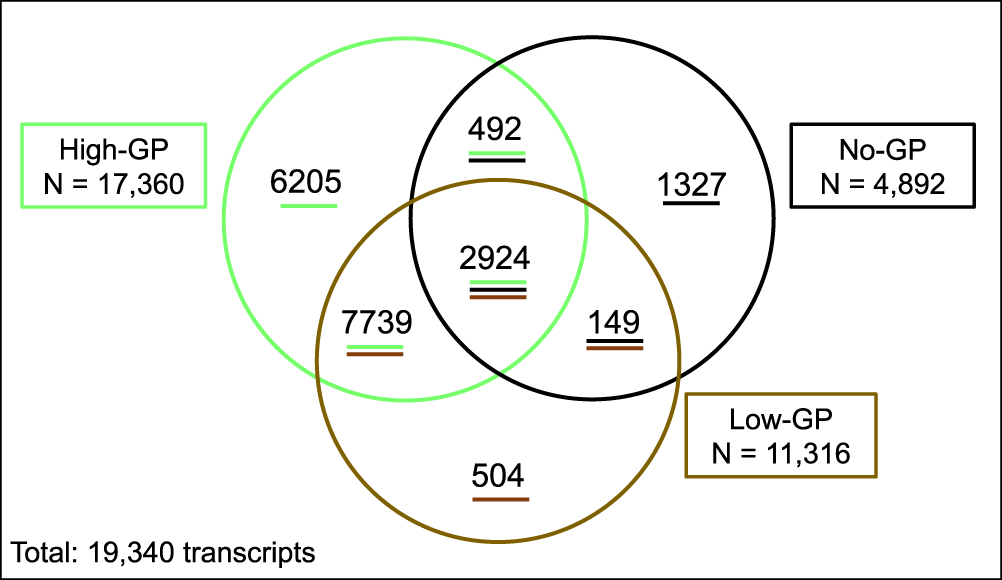
Overall, in the storage time experiment, 19,340 genes were SDE in imbibed compared to dry axes, according to stringent criteria of |log2FC| > 2 and p-value < 0.001. More than half (58%) of SDE genes were shared among GP categories (Fig. 4, Table S3). High-GP axes differed most from dry axes (17,360 SDE genes) and no-GP axes differed least from dry axes (4,892 SDE genes). Most (94%) of the SDE genes in low-GP axes were also SDE in high-GP axes.
Venn diagram of transcripts significantly (|log2FC| > 2 and p < 0.001) differentially expressed in soybean (cv. ‘Williams 82’) axes from different cohorts 24 hours after imbibition compared to dry axes from all cohorts. A total of 19,340 transcripts were differentially expressed in at least one germination potential (GP) category, indicated by clusters in Figure 3. High-GP axes had the largest number of differentially expressed transcripts, and no-GP axes had the fewest. The majority of transcripts differentially expressed in no-GP axes were identified in all GP categories. Low-GP axes had an intermediate number of differentially expressed transcripts, most of which were shared among high- and no-GP axes.
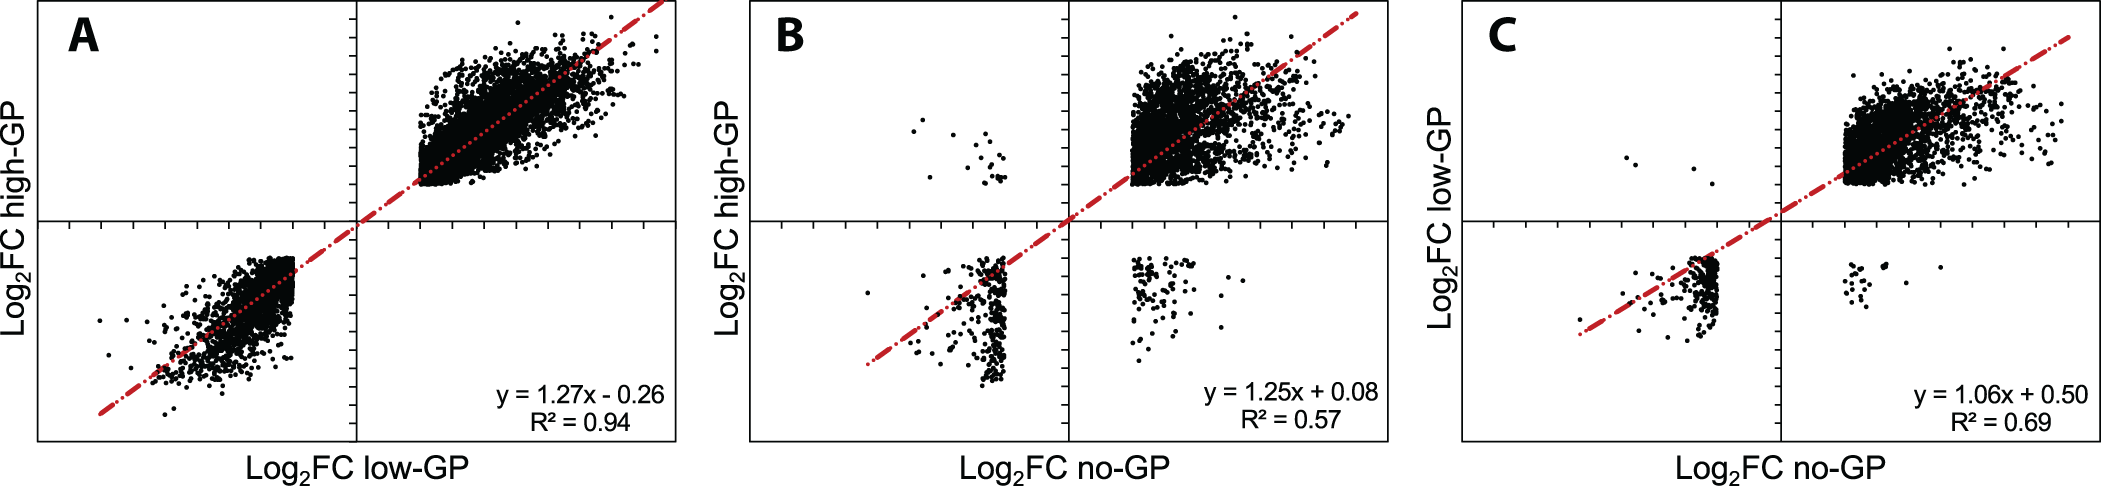
Of the SDE genes in each GP category, 67, 76 and 90% of transcripts were up-regulated in high-, low- and no-GP axes, respectively (see upper quadrants in Fig. 5A–C). Gene expression in high- and low-GP axes was highly correlated (R 2 = 0.94, p ≪ 0.01), and the slope of correlation of 1.27 ± 0.01 (uncertainty of slope at 95% confidence) indicated more intense DE in high- compared to low-GP axes (Fig. 5A). The correlation was weaker between high-GP and no-GP axes (R 2 = 0.57, p ≪ 0.01, slope = 1.25 ± 0.04 at 95% confidence), but the slopes were not significantly different (p > 0.15, t-test of slopes) (Fig. 5B). Some transcripts were SDE in both high- and no-GP axes, but in opposite directions (lower right and upper left quadrants). Comparisons of the log2FC for low- and no-GP axes were also significantly correlated (R 2 = 0.69, p ≪ 0.001), and the slope of 1.06 ± 0.03 was significantly different than correlations involving the high-GP group (p ≪ 0.01, t-test of slopes) (Fig. 5C).
Correlations between intensity of expression (log2FC) of significantly differentially expressed soybean genes shared between different germination potential (GP) categories: 10,663 genes shared between high- and low-GP (A), 3,416 genes shared between high- and no-GP (B), and 3,073 genes shared between low- and no-GP axes (C). The equation for the regression line and the correlation coefficient for each relationship are indicated. All relationships are significant at p ≪ 0.01. Slopes between regression lines in (A) and (B) are not significantly different (p > 0.05), but the slope of the regression line in (C) is significantly different from the slopes in (A) and (B) (p < 0.05). Of note are the number of genes in the upper left and lower right quadrants in (B) and (C), indicating opposite regulation of these genes in no-GP axes that lowers the correlation coefficient.
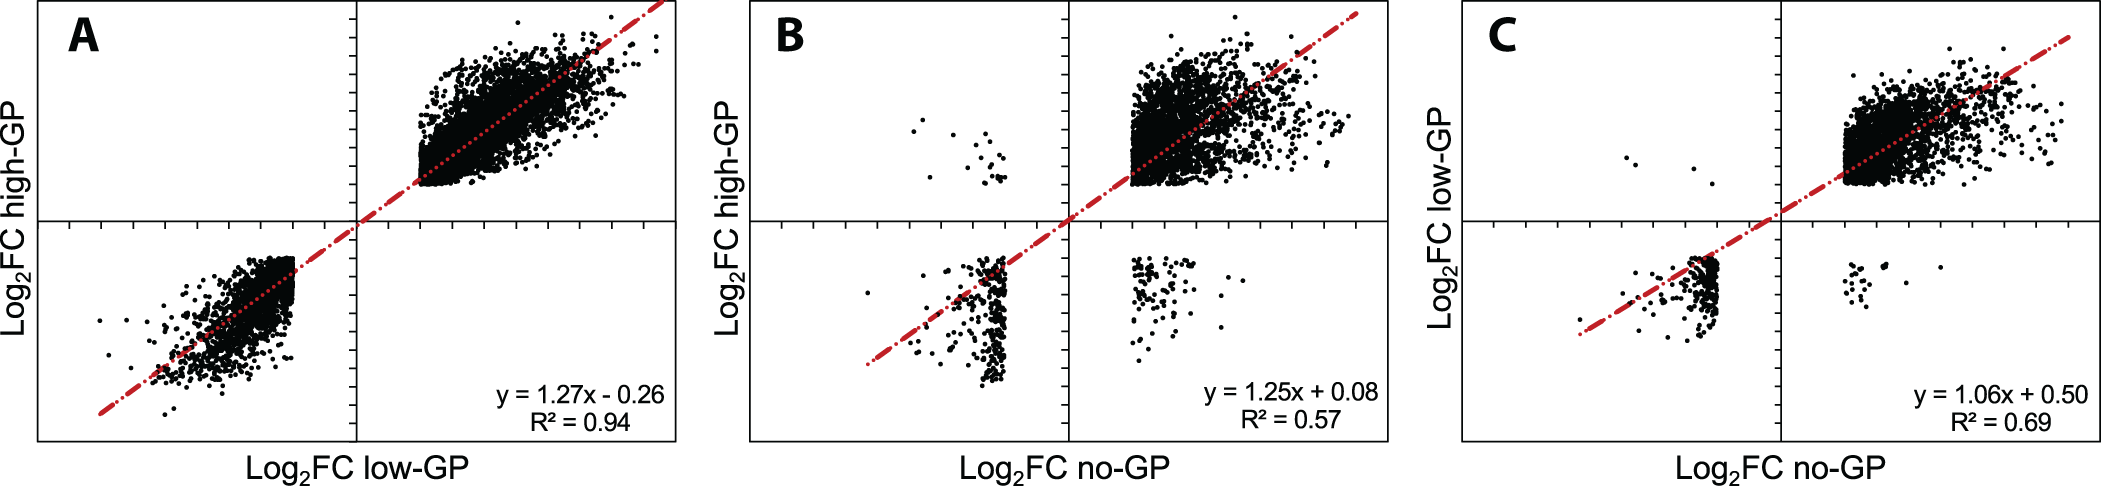
Figure 5 Long description
The image contains three scatter plots comparing the intensity of expression (Log2FC) of soybean genes across different germination potential (GP) categories. The first plot compares high-GP and low-GP. The horizontal axis is labeled ′Log2FC low-GP′ and the vertical axis is ′Log2FC high-GP′. A regression line indicates a strong positive correlation with the equation y equals 1.27x minus 0.26 and R squared equals 0.94. Data points are densely clustered along the line, showing a consistent relationship. The second plot compares high-GP and no-GP. The horizontal axis is labeled ′Log2FC no-GP′ and the vertical axis is ′Log2FC high-GP′. The regression line shows a moderate positive correlation with the equation y equals 1.25x plus 0.08 and R squared equals 0.57. Points are more dispersed, indicating variability in the relationship. The third plot compares low-GP and no-GP. The horizontal axis is labeled ′Log2FC no-GP′ and the vertical axis is ′Log2FC low-GP′. The regression line shows a moderate positive correlation with the equation y equals 1.06x plus 0.50 and R squared equals 0.69. Points are moderately clustered, suggesting a consistent but weaker relationship compared to the first plot. No color coding or additional symbols are used to encode categories. The plots illustrate the varying degrees of correlation between gene expression levels across different GP categories.
Functional differences in transcriptomes of aged versus healthy seeds
Transcripts were assigned to MapMan annotation categories, and log2FC values for SDE genes in each GP category were mapped based on their annotation to understand how metabolism might differ between GP categories (Fig. 6, Tables S3 and S5). High-GP axes had SDE genes distributed among all major metabolic pathways (Fig. 6A), including pathways essential for photosynthesis (light reactions, reactive oxygen species, Calvin cycle). Other categories with many SDE genes in high-GP axes included catabolism of lipids and raffinose oligosaccharides, compounds which accumulate in the embryonic axis during soybean seed development. MapMan annotation categories were more sparsely populated in low- and no-GP axes because there were fewer SDE genes (Fig. 6B,C). For example, genes involved in lipid or carbohydrate mobilization or nucleotide metabolism are somewhat and barely represented in low- and no-GP axes, respectively. This overview of embryonic axis metabolism 24 HAI revealed no dominant metabolic category for any GP class. SDE genes in no-GP axes, which had 72% less differential expression than high-GP axes, were distributed among annotation categories in approximately the same ratio as in high-GP axes.
Mapman displays of genes significantly differentially expressed (SDE) in high germination potential (GP) (A), low-GP (B) and no-GP (C) soybean (cv. ‘Williams 82’) axes. Various grey shapes represent metabolism categories, and red and blue squares represent up- and down-regulation of SDE genes, respectively. Intensity of colour represents |log2FC| with light pink or blue indicating |log2FC| = 2 and the most intense colour indicating |log2FC| = 8. High-GP axes (A) show high |log2FC| values in several metabolism categories that are absent from no-GP axes (C) and intermediate in low-GP axes (B). Metabolism categories discussed in the text are noted with a dashed outline.

Figure 6 Long description
The image consists of three parts labeled a, b and c, each representing Mapman displays of genes significantly differentially expressed in soybean axes with varying germination potentials. Part a shows high germination potential axes with numerous red and blue squares indicating up- and down-regulation of genes across various metabolism categories. Part b represents low germination potential axes with fewer colored squares, indicating intermediate regulation. Part c depicts no germination potential axes with minimal regulation. Each part includes gray shapes representing different metabolism categories such as amino acids, sucrose and TCA cycle. The intensity of red and blue squares correlates with the magnitude of gene expression changes, with lighter colors indicating lower log fold change values and more intense colors indicating higher values. Dashed outlines highlight specific metabolism categories discussed in the text.
Gene expression during imbibition: From dry seed to completed germination or death
Gene expression patterns of healthy soybean seeds during an imbibition time course provide a useful context for interpreting the effects of storage time. Publicly available transcriptomic data from an imbibition time course of healthy soybean (cv. ‘BRS 284’) axes (‘imbibition time experiment’, Bellieny-Rabelo et al., Reference Bellieny-Rabelo, DeOliveira, Da silva ribeiro, Costa, Oliveira and Venancio2016a) were compared to transcriptomes of high-, low- and no-GP axes (‘storage time experiment’). In the imbibition time experiment, the number of SDE (|log2FC| > 2, p-value < 0.001) genes in imbibed compared to dry axes increased at each time point, with 2,888, 7,267, 14,796 and 28,032 SDE genes observed after 3, 6, 12 and 24 HAI (Fig. S4, Table S4). A core set of 1917 genes was SDE at all time points, and 982 of these genes were also SDE in high-, low- and no-GP axes. More genes were up-regulated than down-regulated at all imbibition time points, but the proportion of down-regulated genes increased from 1 to 33% of SDE genes between 3 and 24 HAI.
Similar to the storage-time experiment, SDE transcripts were found in all the major metabolic pathways at all time points in the imbibition-time experiment. The magnitude of differential expression increased with imbibition time (Fig. 7), and at 24 HAI, gene expression patterns for ‘BRS 284’ axes were similar to high-GP ‘Williams 82’ axes, with all metabolic pathways represented (compare Fig. 7D with Fig. 6A). In ‘BRS 284’ axes 3 HAI, fewer genes were SDE, and these genes had smaller changes in differential expression (Fig. 7A), compared to no-GP ‘Williams 82’ axes 24 HAI (Fig. 6C).
Mapman displays of genes significantly differentially expressed (SDE) in imbibed compared to dry soybean (cv. ‘BRS 284’) axes at sequential imbibition times based on data from Bellieny-Rabelo et al. (Reference Bellieny-Rabelo, DeOliveira, da Silva Ribeiro, Costa, Oliveira and Venancio2016b), illustrating increased expression at 3 hours after imbibition (HAI) (A), 6 HAI (B), 12 HAI (C) and 24 HAI (D). As with Figure 6, red and blue squares represent up- and down-regulation of SDE genes, respectively. Intensity of colour represents |log2FC| between 2 and 8.
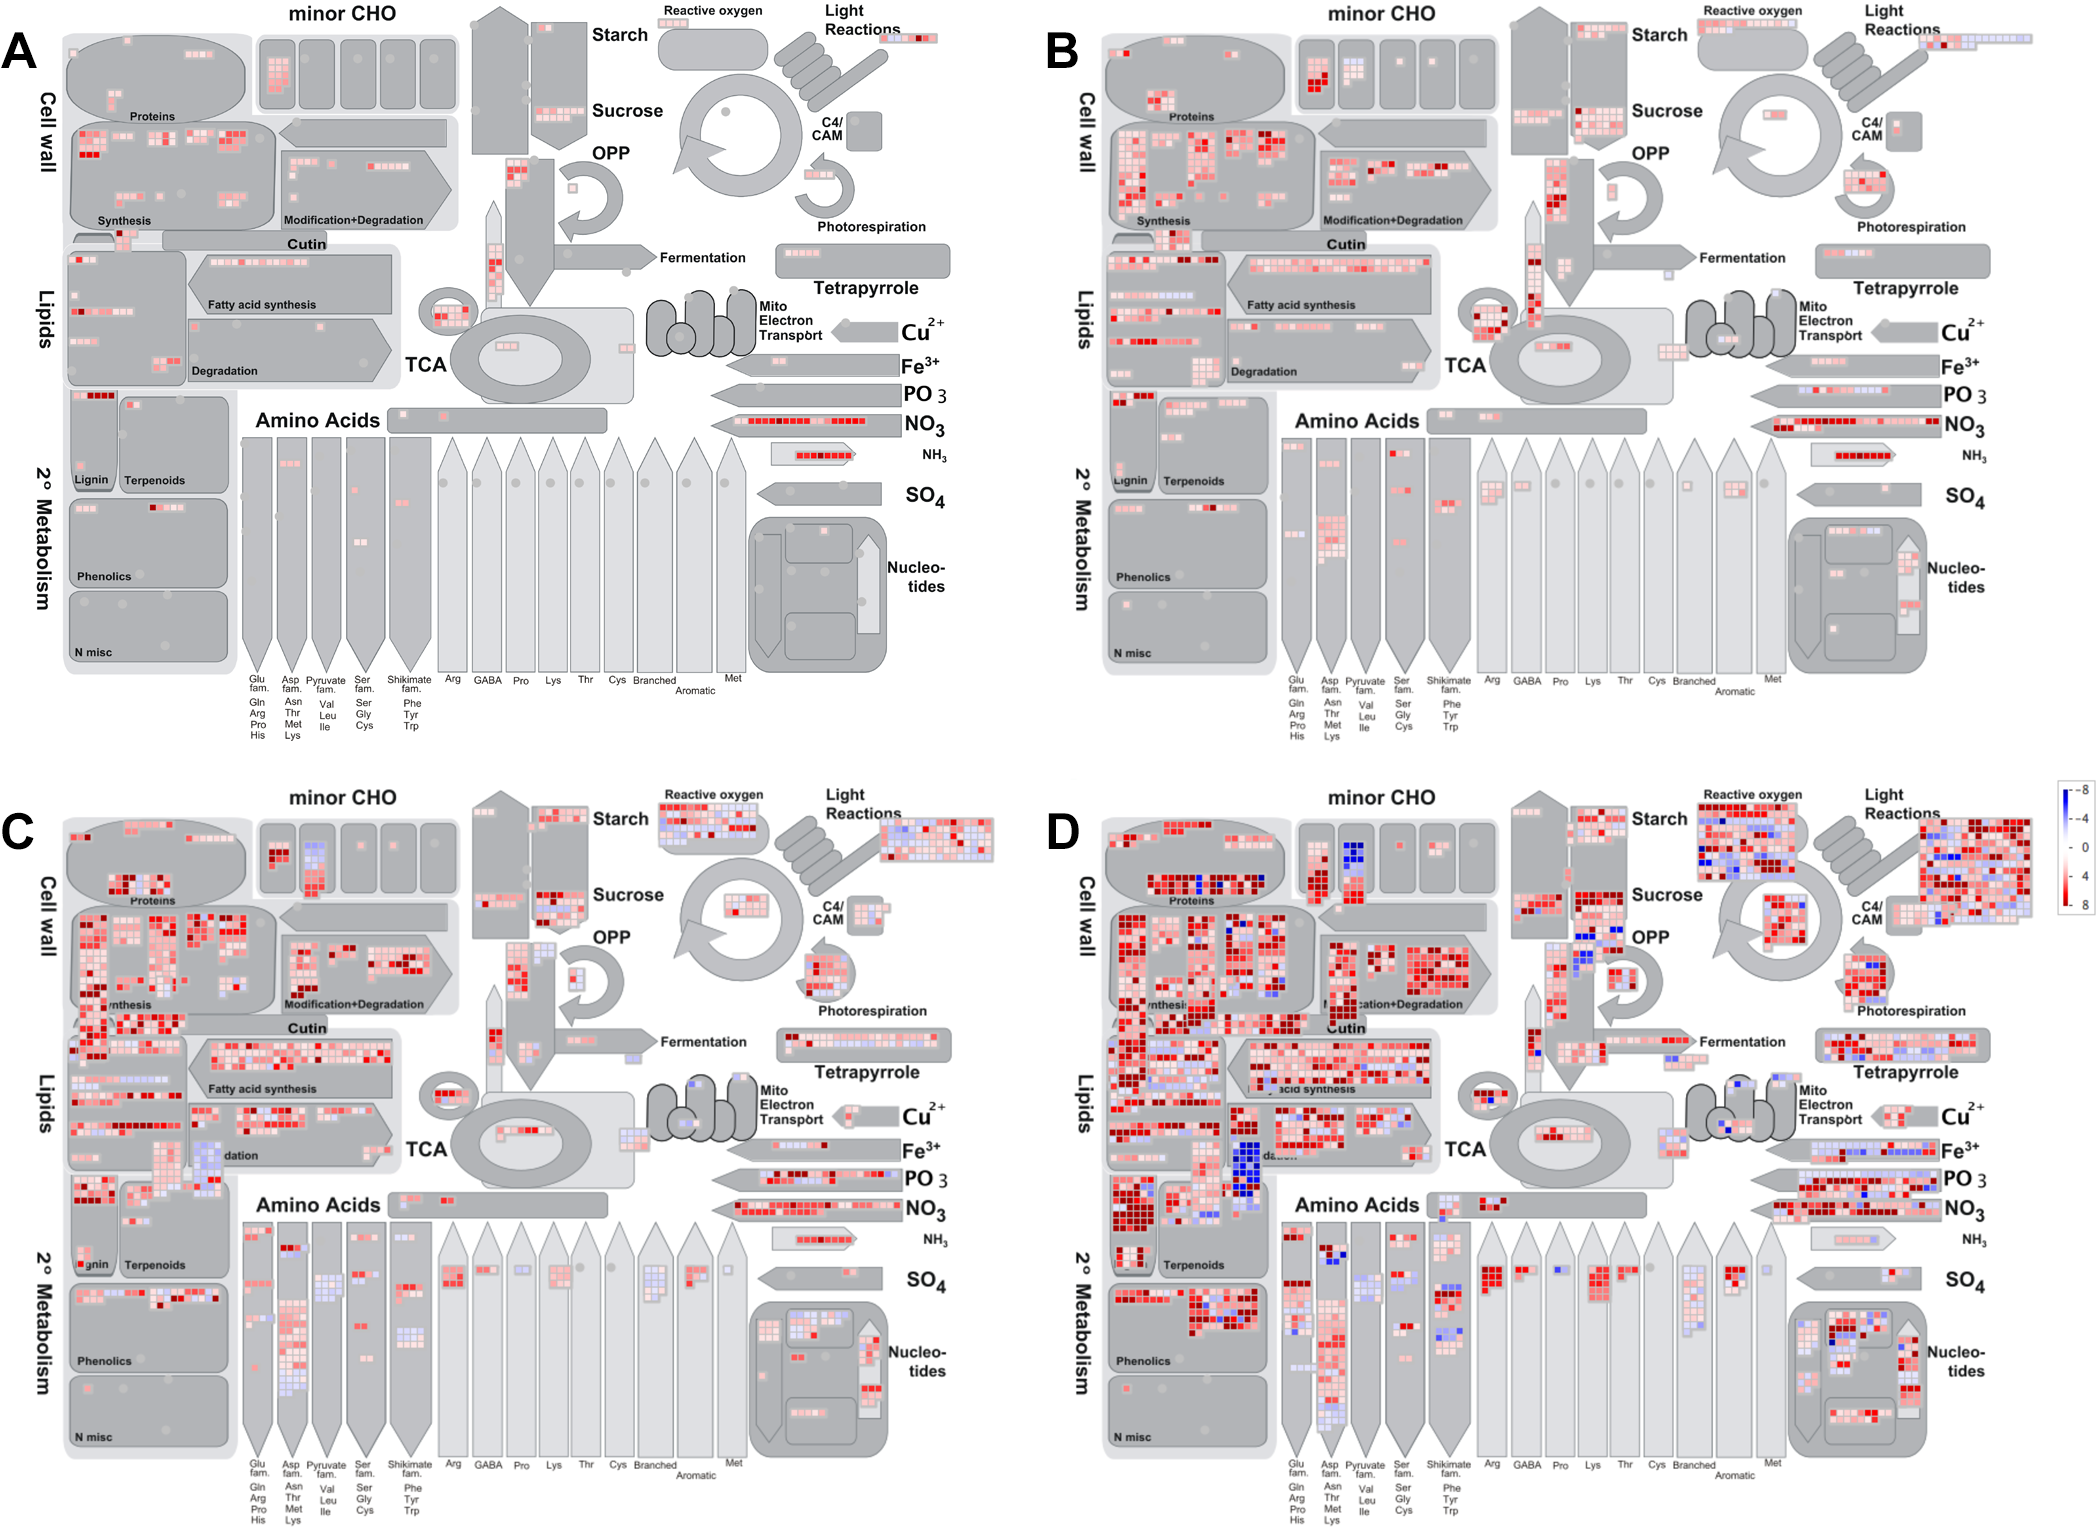
Figure 7 Long description
The image consists of four panels labeled a, b, c and d, each showing Mapman displays of genes significantly differentially expressed in soybean axes at different imbibition times. Each panel represents a specific time point: 3 hours, 6 hours, 12 hours and 24 hours after imbibition. The panels illustrate various metabolic pathways, including major CHO, starch, sucrose, glycolysis, TCA cycle, amino acids and others. Red squares indicate up-regulation, while blue squares indicate down-regulation of genes. The intensity of the color represents the magnitude of differential expression. The panels show changes in gene expression across different pathways, with more intense expression changes visible at later time points, particularly in panel d. Each pathway is labeled and the diagrams include cellular components like mitochondria and chloroplasts, indicating where these processes occur.
To further compare expression patterns between storage time (high-, low- and no-GP in cv. ‘Williams 82’ axes 24 HAI) and imbibition time (3, 6, 12 and 24 HAI in healthy cv. ‘BRS 284’ axes), we used a heatmap of the 19,340 genes identified as SDE in any GP category in the storage-time experiment (Figs 4 and 8). Hierarchical clustering by treatment (GP category or imbibition time) showed that high-GP axes (Fig. 6A) clustered with ‘BRS 284’ axes 24 HAI; low-GP axes (Fig. 6B) clustered with ‘BRS 284’ axes 6–12 HAI; and no-GP axes (Fig. 6C) clustered with ‘BRS 284’ axes 3 HAI. Axes of different GP categories did not cluster together, and only axes 6 and 12 HAI, among all imbibition time points, clustered together.
Heat map of all 19,340 transcripts significantly (|log2FC| > 2, p < 0.001) differentially expressed in any germination potential (GP) category (compared to dry soybean cv. Williams 82 axes) that were also expressed at all four imbibition time points [3, 6, 12 and 24 hours after imbibition (HAI)]. Log2FC values were corrected by z-score independently for GP categories and imbibition time points. Rows were clustered by expression profile in the three GP categories; columns were clustered by expression profile in all seven treatments. Six major clusters were observed among transcripts; three clusters were observed among treatments. No-, low- and high-GP axes clustered independently from each other; increasing GP was associated with longer imbibition times. Generally, intensity of expression was opposite in no-GP/3 HAI axes compared to high-GP/24 HAI axes, while expression in low-GP/6 HAI/12 HAI axes was intermediate.

Figure 8 Long description
Cluster number. A heatmap with hierarchical clustering shown as a dendrogram for rows and a dendrogram for columns. The columns are labeled, in order: No-GP; 3 HAI; Low-GP; 12 HAI; 6 HAI; High-GP; 24 HAI. The rows are grouped and labeled, in order: 5; 2; 1; 3; 4; 6. A legend labeled z-score shows tick labels 1.5, 1, 0.5, 0, minus 0.5 and minus 1. The heatmap cells use a gradient keyed to the z-score legend, with higher z-score values at the 1.5 end of the legend and lower z-score values at the minus 1 end of the legend. Across the row group labeled 5, the No-GP and 3 HAI columns are mostly near the lower end of the z-score scale, while the Low-GP, 12 HAI and 6 HAI columns are mostly mid to higher on the z-score scale and the High-GP and 24 HAI columns are mostly higher on the z-score scale. Across the row groups labeled 2 and 1, the No-GP and 3 HAI columns are mostly higher on the z-score scale, the Low-GP, 12 HAI and 6 HAI columns are mostly mid-range and the High-GP and 24 HAI columns are mostly near the lower end of the z-score scale. Across the row groups labeled 3, 4 and 6, the No-GP and 3 HAI columns show mixed values, the Low-GP, 12 HAI and 6 HAI columns show mixed values and the High-GP and 24 HAI columns are mostly near the lower end of the z-score scale. No numerical values are printed inside the heatmap cells.
Six general gene expression clusters were identified based on expression in high-, low- and no-GP axes. The largest (Cluster 5: 10,325 genes) included genes with the highest expression in high-GP and healthy axes 24 HAI and the lowest expression in no-GP axes and healthy axes 3 HAI. A smaller cluster (Cluster 1: 6,073 genes) showed the opposite pattern, with the highest expression in no-GP and healthy axes 3 HAI and the lowest expression in high-GP and healthy axes 24 HAI. In most clusters, approximately average expression was found in low-GP axes as well as healthy axes 6 or 12 HAI (Table S6).
Genes belonging to a cluster may share functions as well as expression patterns. To identify functions associated with the different clusters, we tested whether any of the 28 MapMan annotation categories were significantly over- or under-represented in any cluster using a two-proportion z-test (Tables S6 and S7). Significantly over-represented categories in Cluster 5 (highest expression in high-GP/24 HAI axes) included cell cycle organization, cell wall organization, photosynthesis and cytoskeleton organization; cytoskeleton organization was also over-represented in Cluster 2. Categories significantly under-represented in Cluster 5 included RNA biosynthesis and RNA processing. RNA processing, along with protein biosynthesis and homeostasis, was over-represented in Cluster 1 (highest expression in no-GP/3 HAI axes).
A closer look at genes important for seed germination in healthy and aged seeds
A total of 5,712 transcripts, representing 3,492 genes of known importance for seed germination, were identified from the literature. Only 27% of these ‘germination genes’ were SDE in high-, low-, or no-GP axes from the storage time experiment (Table S8). Hierarchical clustering by treatment (GP category and imbibition time), using only the SDE germination genes (Fig. 9, Table S9), produced identical clusters as in Fig. 8, in which all SDE genes were considered: high-GP clustered with 24 HAI, no-GP clustered with 3 HAI and low-GP clustered with 6–12 HAI axes. Most gene functional categories contained a mixture of expression patterns, with some genes showing the highest expression in no-GP/3HAI axes and the lowest expression in high-GP/24 HAI axes, and the remaining genes showing the opposite expression pattern. However, all SDE ABI3 homologs (Category F, Fig. 9), longevity-associated transcription factors (Category J) and mRNA quality control genes (Category Q) showed the highest expression in no-GP/3 HAI axes, while all SDE PARPs (Category D) and fermentation genes (Category H) showed the highest expression in high-GP/24 HAI axes.
Heat map of z-score-corrected log2FC for 5712 transcripts involved in germination (see Table S7), ordered on the y-axis by annotation and decreasing z-score in no-GP soybean axes, and clustered on the x-axis by expression profile. Log2FC values were corrected by z-score independently for GP categories and imbibition time points. Genes were significantly differentially expressed in at least one of the GP categories. The same patterns observed in Figure 8 were seen here also: GP categories did not cluster together, and increasing GP was associated with increased imbibition time; opposite expression intensity was found in no-GP/3 HAI versus high-GP/24 HAI, while low-GP/12 HAI/6 HAI axes were intermediate. No misregulation of germination genes in no- or low-GP categories compared to their early imbibition counterparts was apparent.

Figure 9 Long description
The heat map displays z-score-corrected logFC for 5712 transcripts involved in germination. The vertical axis lists annotations labeled A to Y, while the horizontal axis includes columns labeled no-GP, 3 HAI, low-GP, 12 HAI, 6 HAI, high-GP and 24 HAI. The color gradient represents z-score values, with higher values indicating increased expression levels. The dendrogram above suggests clustering by expression profile. Notable patterns include higher expression in high-GP and 24 HAI columns, while no-GP and 3 HAI show lower values. Key annotations include PIMT1 orthologs, HSFA9 orthologs and protein biosynthesis categories. The legend on the right provides annotation details, mapping each letter to specific gene categories.
Discussion
In this paper, we sought a transcriptional signal corresponding to lost viability in hydrated soybean seeds that had been stored dry for decades. We hypothesized that seeds become inviable during imbibition (Smith and Berjak, Reference Smith, Berjak, Kigel and Galili1995), because transcriptomes of dry seeds did not reveal a ‘death’ signal (Fleming et al., Reference Fleming, Richards and Walters2017, Reference Fleming, Patterson, Reeves, Richards, Gaines and Walters2018, Reference Fleming, Hill and Walters2019). We sequenced transcriptomes of dry and imbibed axes from three seed cohorts at different stages of degradation (Walters et al., Reference Walters, Fleming, Hill, Dorr and Richards2020): no viability loss (98–99% germination, 2015H, 3 years of storage), almost complete loss (0–3% germination,1996H, 22 years of storage) and rapid loss (60–90% germination, depending on assay conditions, 1999H, 19 years of storage) (Walters et al., Reference Walters, Fleming, Hill, Dorr and Richards2020). Transcriptomes of dry axes from all cohorts were similar. Imbibition for 24 hours resulted in three distinct patterns of gene expression, which we named high-, low- and no-GP (Fig. 3). Healthy axes (2015H) were found in both high- and low-GP categories; dying axes (1999H) were found in all three GP categories. Transcript expression was less intense overall, and few genes were down-regulated, in the no-GP cluster compared to the high-GP cluster (Fig. 5B). However, comparing no-GP axes (imbibed for 24 hours) to healthy axes imbibed for less time showed that the expression profile of no-GP axes was very similar to healthy axes imbibed for just 3 hours (Figs 6C, 7A and 8). These data contribute to the growing understanding of the metabolic burst that transitions dry seeds into seedlings (Rajjou et al., Reference Rajjou, Duval, Gallardo, Catusse, Bally, Job and Job2012; Galland et al., Reference Galland, Huguet, Arc, Cueff, Job and Rajjou2014; Bellieny-Rabelo et al., Reference Bellieny-Rabelo, DeOliveira, da Silva Ribeiro, Costa, Oliveira and Venancio2016b; Bai et al., Reference Bai, Peviani, van der Horst, Gamm, Snel, Bentsink and Hanson2017). Our work further suggests that damage to seeds during dry storage decreases metabolic competence, reducing the metabolic burst to a fizzle.
Significant differential expression occurs in vigorous axes
Differential expression in high-GP ‘Williams 82’ axes and ‘BRS 284’ axes 24 HAI was similar (Fig. 8). For example, genes involved in photosynthesis were found to be up-regulated, indicating preparation for transitioning to autotrophic growth (Figs 6 and 7, Table S6). The similarity of transcriptomes of healthy axes from different cultivars allowed us to compare expression patterns between ‘Williams 82’ axes of different GPs and ‘BRS 284’ axes imbibed for different times.
Many genes previously implicated in germination were found to be SDE when comparing consecutive imbibition time points (e.g. 3–0, 6–3, 12–6 and 24–12 HAI) (Bellieny-Rabelo et al., Reference Bellieny-Rabelo, DeOliveira, da Silva Ribeiro, Costa, Oliveira and Venancio2016b). Our analysis of the imbibition time experiment data compared each imbibition time point to dry (0 HAI) axes, so that we could determine if transcripts expressed in no-GP and low-GP axes were a typical part of early germination. In our study, many of these ‘germination genes’ were not SDE, which is expected since differential expression was evaluated differently. Additionally, the identification of ‘germination genes’ based on SDE during imbibition may be masked because their transcripts or proteins were already produced during seed maturation (Pereira-lima et al., Reference Pereira-Lima, Buitink, Lalanne, Rossi, Pelletier, Amaral da Silva and Leprince2017).
Overall, our findings suggest that GP hinges on swiftly reaching a baseline level of metabolic competence, rather than effective transcription or translation of specific ‘germination genes’.
New transcripts produced in axes from ‘dead’ seeds
Transcriptomes of no-GP axes 24 HAI were distinct from dry axes and from healthy imbibed axes (Fig. 3). Many SDE genes in no-GP axes were up-regulated (Figs 4 and 5), even though the same SDE genes were strongly down-regulated in high-GP axes (note low R2 for log2FC in high-GP versus no-GP axes in Fig. 5B). In fact, no-GP axes produced new transcripts, although their weaker expression and misregulation in comparison with high-GP transcriptomes suggest that no-GP transcriptomes may be too small or uncoordinated to complete germination. We saw no evidence of divergent metabolic pathways in high-GP and no-GP axes that explain failed germination in the latter.
The transcriptome of no-GP axes 24 HAI largely reflects expression during early imbibition of healthy axes (3 HAI) (Figs 6C, 7A, 8 and 9), further suggesting that axes that failed to germinate have slow or arrested metabolism. Future studies will examine no- and low-GP axes at times shorter and longer than 24 HAI to distinguish these scenarios. Ideally, time points will be identified at which axes with different GPs are at the same developmental stage, with the expectation that their transcriptomes will then be similar. Slowed metabolism as a consequence of ageing provides an opportunity for ‘rescue’ by extending germinating times and preventing microbial invasion.
Adding insult to injury
Pinpointing the lethal event is confounded in seeds because damage continues to accumulate postmortem. The 1996H cohort died (or no longer germinated) by 2013 (Walters et al., Reference Walters, Fleming, Hill, Dorr and Richards2020), meaning that damage measured in 2018 was beyond the lethal event. The low RIN values in dry seeds of this cohort reflect degraded ribosomal subunits (Schroeder et al., Reference Schroeder, Mueller, Stocker, Salowsky, Leiber, Gassmann, Lightfoot, Menzel, Granzow and Ragg2006), though some intact ribosomes appear present based on identifiable 18S and 25S peaks in electropherograms (Fig. S3). Poor recovery of RNA integrity 24 HAI in 1996H seeds suggests that translation is also impaired, and yet de novo protein synthesis is needed to complete germination (Rajjou et al., Reference Rajjou, Lovigny, Groot, Belghazi, Job and Job2008). Imbibition time courses of proteomic changes in healthy vs. aged seeds may illuminate the relationship between translational competence and overall metabolic vigour and radicle emergence.
Lethal events were occurring in the 1999H cohort at the time RNA was extracted in 2018 (Walters et al., Reference Walters, Fleming, Hill, Dorr and Richards2020). However, damage to rRNA (RIN values < 7) was not obvious in this cohort for dry or imbibed axes (Fig. 2, Figs S2 and S3, Table S10). In other words, some 1999H axes experienced a ‘death blow’, but it was not detected by loss of RNA integrity per se (Fleming et al., Reference Fleming, Richards and Walters2017, Reference Fleming, Patterson, Reeves, Richards, Gaines and Walters2018). More likely, the lethal event is reflected by languishing metabolism upon hydration (Fig. 6B).
Are low-GP axes dead or alive?
The low-GP category (Fig. 3) includes axes from both 2015H and 1999H (98–99% and 60–90% germination, respectively), the latter having an approximate 2:1 ratio of green and white cotyledons after 72 hours of light. Low-GP axes shared over 90% of their SDE genes with high-GP axes, but up- and down-regulation was much less intense (smaller log2FC values) in low-GP axes (note R 2 = 0.94 and slope = 1.27 > 1, p ≪ 0.01 in Fig. 5A). The low-GP category may be more aptly named ‘slow germination potential’ to highlight the similarity in expression patterns with healthy axes 6 or 12 HAI (Bellieny-Rabelo et al., Reference Bellieny-Rabelo, DeOliveira, da Silva Ribeiro, Costa, Oliveira and Venancio2016b) (Fig. 8). Although the time required for radicle emergence varies, it overlaps for 2015H and 1999H (Fig. 1A); the low-GP category may capture later-germinating seeds from each cohort. Low-GP seeds also may or may not be fully capable of completing germination, as evidenced by the mixture of white and green cotyledons associated with these axes. The occurrence of some 2015H axes (paired with green cotyledons) in the low-GP category may be the first sign of age-related damage in this relatively fresh, healthy seed lot. In low-GP seeds that successfully germinate, delayed transcription may catch up to match high-GP axes if given sufficient imbibition time (Waterworth et al., Reference Waterworth, Bray and West2019). In other words, low-GP axes may germinate, or not, depending on experimental conditions, giving high uncertainty to exact germination percentages as well as a greater probability of type 1 statistical errors (classifying a seed as dead when it is not [Fig. S1]).
Detecting an intermediate class of GP argues for a transition between ability and inability to germinate that is more continuous than characterizations of alive and dead or green and white cotyledons. Transcriptome size, coordinated gene expression, RNA integrity and the extent that radicle emergence is delayed may provide usable signals that quantify damage in ageing seeds before germination capacity is entirely lost. Assessments of seeds that are dying but retain some possibility of surviving are likely to reveal other cellular signals too. Quantitative metrics of damage are needed to phenotype segregating populations of seeds that are ageing rapidly or slowly. Observing an intermediate class also provides a new framework to adjust our notions of how dry seeds die, away from catastrophic events and towards slow attrition and eventual death. Here, we find no single molecular failure that signals mortality. However, a threshold of metabolic competence may ultimately separate an embryo that cannot be revived from one that can, when given substantial intervention to prolong imbibition and retard microbial growth.
Conclusion
Dry seeds are neither overtly alive nor dead. Imbibition initiates the process of germination, a complex developmental cascade of fluctuating gene expression that culminates (sensu stricto) in radicle emergence. Germination-related transcripts are detected in lethally aged seeds, and self-destruct pathways are not, ruling out a clear metabolism-based ‘death signature’. Rather, the distinction between alive and recently dead appears to be kinetic. That is, dead seeds fail to muster a sufficient transcriptome response before microbial infestations dominate. Therefore, global gene expression may serve as an excellent ‘canary in the coal mine’ to indicate seed health or imminent demise.
Supplementary material
The supplementary material for this article can be found at https://doi.org/10.1017/S0960258526100191.
Acknowledgements
M.F. was supported through the ARS postdoctoral fellowship program. USDA is an equal opportunity employer and provider.
Author contributions
Design of the research: M.F., E.P., C.W.; performance of the research: M.F.; data analysis and interpretations: M.F., E.P., C.W.; writing the manuscript: M.F., E.P., C.W.
Data availability
The data from the storage time experiment that support the findings of this study are openly available in the SRA database at ncbi.nlm.nih.gov/sra, reference number PRJNA675850 (Fleming et al, Reference Fleming, Patterson and Walters2020). The data from the imbibition time experiment that support the findings of this study were derived from resources in the public domain, available at the SRA database at ncbi.nlm.nih.gov/sra, reference number PRJNA326110, or in the GEO database at ncbi.nlm.nih.gov/geo/, accession number GSE83481 (Bellieny-Rabelo et al., Reference Bellieny-Rabelo, DeOliveira, Da silva ribeiro, Costa, Oliveira and Venancio2016a).


 Open access

