1 Opinions in user-generated Web content
The user-generated Web content refers to publicly available data produced by the Web end users (Directorate for Science, Technology and Industry, 2007). For instance, blogs, social network profiles, and consumer-written product reviews are parts of the user-generated textual content. In those texts, users share their personal stories, discuss life experience, and comment on various events, making the Web content more personalized and subjective. This rapidly growing phenomenon has attracted attention of many researchers, at the same time adding new analysis areas to the field of text and language studies. In traditional text mining applications, texts (documents) were often classified according to their topics. In studies of user-generated texts, the focus shifted from topic classification to sentiment and opinion analysis. Opinion studies often analyze user-written reviews to predict opinions about the consumed goods. Our work focuses on opinion analysis methods applicable when the product consumers reveal their opinions in a non-emotional way. We want to establish a link between non-emotional expressions and reviewer's opinions.
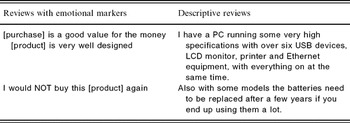
Opinion is a private state that may not be objectively observed or verified (Quirk et al. Reference Quirk, Greenbaum, Leech and Svartvik1985). Opinions, nevertheless, can be reliably predicted if we gain access to useful language indicators. If the reviewer explicitly states her attitude, then the expressed sentiments can be used to determine whether opinion is positive or negative. In other cases, consumers describe their experience without invoking positive or negative emotions. Table 1 presents reviews with emotional markers in the left column and descriptive, non-emotional reviews in the right column. Hereinafter, all examples in this font are taken from user-generated Web content.
Examples of emotional and descriptive reviews written by consumers

In the three examples of emotional opinions in the left column of Table 1, we can rely on positive and negative markers to determine the opinion label: [product] is very well designed and [purchase] is a good value for the money infer positive opinions, I would NOT buy this [product] again – a negative opinion. The opinion analysis becomes more nontrivial if the users avoid emotional positive and negative statements. In order to understand the expressed points of view in the two descriptive, non-emotional opinions in the left column of Table 1, we want to look at both the sentences from the context of the product use:
(i) I have a PC running some very high specifications with over six USB devices, LCD monitor, printer, and Ethernet equipment, with everything on at the same time.
(ii) Also with some models the batteries need to be replaced after a few years if you end up using them a lot.
The first sentence says that the PC runs high specifications with over several devices, the second sentence tells about the model's need for the battery replacement after a few years. Comparison of several positive and negative reviews helps us to find that ability to run high specifications over several devices is a positive hint for the PC users, whereas the need for a frequent change of batteries is a negative hint. The first sentence, thus, is positive, whereas the second sentence leans toward a negative opinion.
We hypothesize that it is possible to predict opinions from general, non-emotional descriptions, which discuss place, time, manner, comparison, and physical conditions. Those descriptions are not topic- or domain-specific. We elicit them with questions where, when, how and what shape, what size. Free-form, free-content format stimulates responses that list important features of reviewers' experience. For instance, kitchen utensils reviewers frequently refer to water in their messages.
Processing large numbers of reviews is imperative for the reliability of results if prediction is based on unsolicited descriptions. Access to a large number of reviews brings in several advantages, mainly by mutual neutralization of reviewers' personal biases. The Web-posted product reviews aggregate consumers' choices, consequently reducing the influence of individual's personal choice. Although some product evaluations can be relative to the taste and senses of an individual consumer (Lasersohn Reference Lasersohn2005), we do not need to relativize them while working with a large pool of random consumers. Instead, we refer to a general theory of opinion, which was developed by Quirk et al. (Reference Quirk, Greenbaum, Leech and Svartvik1985) and later advanced by Biber et al. (Reference Biber, Johansson, Leech, Conrad and Finegan1999) and Leech and Svartvik (Reference Leech and Svartvik2002).
We start discussion with a new taxonomy of opinion analysis studies. The taxonomy categorizes the studies according to the writing style of data contributors and the opinion-bearing unit of studies. Further, the paper shows motivations and the linguistic foundations for the choice of descriptive word categories, then introduces a semantic hierarchy of product assessment. We present the information extraction (IE) procedure and report empirical evidence for classification and regression. The obtained results show statistically significant improvement over other approaches. We discuss the related work and conclude with ideas for future work. This work generalizes studies by Sokolova and Lapalme (Reference Sokolova and Lapalme2009a, Reference Sokolova and Lapalme2009b).
2 Taxonomy of opinion analysis studies
Product reviews are the object of studies that combine Natural Language Processing (NLP), Machine Learning (ML), and Information Extraction to the tasks originated in the business community (retail, marketing, advertizement, etc.). Recognition of expressed opinions about the consumed products is, perhaps, the most popular task, which is greatly benefitted from the availability of public Web forums. Among related works, Natural Language Processing- and ML-based opinion analysis hace been surveyed with respect to Web mining and sentiment learning (Liu Reference Liu2007; Pang and Lee Reference Pang and Lee2008).
We view opinion analysis from the perspective of global text characteristics and the learning target. In order to account for the text characteristics, we look at opinion analysis done on the contrived and noncontrived texts. The two text types differ in following manner:
(t-1) Contrived text is better edited and uses more conventional grammar and style (Crystal Reference Crystal2006); opinion analysis studies contrived text when the data are provided by papers written by movie critics (Pang, Lee and Vaithyanathan Reference Pang, Lee and Vaithyanathan2002), journalists (Yu and Hatzivassiloglou Reference Yu and Hatzivassiloglou2003, Wilson, Wiebe and Hwa Reference Wilson, Wiebe and Hwa2006), elected politicians (Pang and Lee Reference Pang and Lee2005), etc.
(t-2) Noncontrived texts can be informal in style, vocabulary, bear conversational features, and grammatical shortcomings; opinion analysis studies noncontrived text when the data are given by lay persons, for instance, product consumers (Benamara et al. Reference Benamara, Cesarano, Picariello, Reforgiato and Subrahmanian2007) or social activists (Kim and Hovy Reference Kim and Hovy2007).
To take into account the learning target, we consider three opinion-bearing units: individual words, a text segment, and a complete text. Those units are subjects of different opinion analysis problems and invite different processing approaches as follows:
(u-1) For a word, the aim can be to assess the objective/subjective orientation of the word and its use in the context of the overall expression of an opinion (Esuli and Sebastiani Reference Esuli and Sebastiani2007); for example, honest and disturbing are subjective, whereas triangular is not (Esuli and Sebastiani Reference Esuli and Sebastiani2006b); another subfield is a study of positive and negative opinions based on the polarity of subjective opinion-bearing words, such as positive nice and negative nasty (Turney and Littman Reference Turney and Littman2003); another approach is to consider word combinations, for instance, very very good conveys a strong opinion and possibly less expensive conveys a weak opinion (Benamara et al. Reference Benamara, Cesarano, Picariello, Reforgiato and Subrahmanian2007);
(u-2) Text fragments, including sentences, can be objective, subjective, or neutral; some grammatical structures imply evaluation, as comparative sentences (Jindal and Liu Reference Jindal and Liu2006); the fragments can present more opinion clues than the sum of their words and, at the same time, show a restricted number of opinion indicators if compared with texts (Andreevskaya and Bergler Reference Andreevskaia and Bergler2008); the fragment boundaries often include clues pointing to the same sentiment (Hu and Liu Reference Hu and Liu2004; Stoyanov and Cardie Reference Stoyanov and Cardie2008): The strap is horrible and gets in the way of parts of the camera you need access to.
(u-3) A complete text sometimes presents various, even conflicting or not trustworthy, opinions; thus, to determine the overall opinion can be a puzzling task (Turney Reference Turney2002); reviews were classified into opinion spam and non-spam based on the statistical analysis of vocabulary, e.g., uni-gram and bi-gram distribution, frequency of product, and brand features mentioned (Jindal and Liu Reference Jindal and Liu2008); positive and negative opinions were found through the application of supervised and nonsupervised optimization learning algorithms (Blitzer, Dredze and Pereira Reference Blitzer, Dredze and Pereira2007); in online debates on product characteristics, stance recognition was done with the help of web mining for product preferences associated with each stance (Somasundaran and Wiebe Reference Somasundaran and Wiebe2009).
Opinion classification results are highly susceptible to the classification task, the data characteristics, and selected text features. For news data, opinion-bearing sentences are classified against facts with the Precision of 80%–90% (Yu and Hartzivassiloglou Reference Yu and Hatzivassiloglou2003). In Wall Street Journal articles, propositional opinions in sentences are found with the Precision of 54%–68% (Bethard et al. Reference Bethard, Yu, Thornton, Hatzivassiloglou and Jurafsky2004). For consumer reviews, opinion-bearing text segments are classified into positive and negative categories with the Precision of 56%–72% (Hu and Liu Reference Hu and Liu2004). For online debates, the complete texts (i.e., posts) were classified as positive or negative stance with F-score of 39%–67% (Somasundaran and Wiebe 2010). When those posts were enriched with preferences learned from the Web, F-score increased to 53%–75%. In Jindal and Liu (Reference Jindal and Liu2008), the authors obtained 90% area under curve in opinion spam reviews versus genuine reviews classification. For positive and negative review classification, Accuracy is 75.0%–81.8% when data sets are represented through all the uni- and bigrams (Li et al. Reference Li, Lee, Chen, Huang and Zhou2010b).
3 The goal of the current opinion study
In this work, we are concerned with consumer-written reviews, which belong to t-2 in our taxonomy, and opinions expressed in a complete text (u-3, ibid.). Less contrived, conversational-type language has certain syntactic and lexical properties that we will be using to build text representations. Complete texts allow the use of a wider context, which is helpful when we cannot rely on direct emotional clues. By context, we refer to a writer's communication ‘with someone (listener/reader) about events and topics in the world in which he lives’ (Stern Reference Stern1983: p. 135).
So far, opinion learning has been focused on the emotional polarity of texts as expressed by the use of affective words: This is an excellent view shows positive polarity through the use of an affective word excellent. Leaning toward emotional studies can be attributed to prevalence of such studies in Psychology and Cognitive Linguistics. The former examines the process of evaluation and resulting emotion, the latter is focused on subjectivity and its expression in language. Both disciplines extensively analyze emotional aspects of opinions (Bednarek Reference Bednarek2009). Another closely related area is the analysis of attitudes, their formation, representation, and activation done by De Houwer (Reference De Houwer2009), who distinguishes opinion, evaluation, and attitude. Other researchers (Thompson and Hunston Reference Thompson, Hunston, Hunston and Thompson2000; Bednarek Reference Bednarek2009) refer to them as the same concept. In this work, we consider opinion and evaluation as equivalent. Opinion can be expressed about a fact of matter and should not be treated as identical to ‘sentimental expression’ (Lasersohn Reference Lasersohn2005).
The majority of the research in the field considers opinions in a binary classification setting, albeit different problems bring in different category pairs. Categories can be positive/negative opinions (I recommend this camera . . . versus This book is awful . . .), emotive or factual statements (The movie was awesome versus We saw the movie yesterday), and, for example, opinion spam or non-spam (Jindal and Liu Reference Jindal and Liu2008). Wilson et al. (Reference Wilson, Wiebe and Hwa2006) have addressed finer problems of three-class classification. Studies of human evaluation of opinions have revealed that in many cases the agreement level is below 0.80 (Nigam and Hurst Reference Nigam and Hurst2004; Wilson et al. Reference Wilson, Wiebe and Hwa2006).
The processing of large data volume invites application of Information Extraction and Machine Learning. Both techniques handle well large amount of data although in different ways: IE methods are useful for confirming or rejecting already stated hypothesis; ML algorithms are able to extract new knowledge from previously unseen examples. We apply Information Extraction on an intermediate step of constructing word patterns used in the product assessments. This step is performed when the review is classified into opinion categories (classification) or its opinion numerical value is predicted (regression). Later, ML classification and regression methods are used to learn opinions expressed in the reviews. This work being focused on English, our framework is based on the pragmatics and grammar of the English language and uses intrinsic characteristics of that language.
4 Descriptive evaluation of products
The Internet medium has significantly increased opportunities of expressing one's opinion with the introduction of user-generated media (Crystal Reference Crystal2006). The advantage is especially important for publishing end-user opinions, which lacked open forums in the pre-Internet era. The Web-posted product reviews allow us to study what consumers say about products. In those Web reviews, the users are inclined to post opinionated, subjective messages, as it may be difficult to achieve an objective utterance that does not bear attitudinal evaluations or value judgements (Bednarek Reference Bednarek2006).
In the reviews, people reveal their experience with the consumed products in a multitude of ways. One's opinion involves emotional and sentimental expressions and a fact of the matter presentation. Consider the following product review: I love this electric kettle! I use it 3 or 4 times a day to boil water for french press coffee, oatmeal, tea, etc.. Here the first sentence (I love this electric kettle!) is more emotional than the rest (I use it 3 or 4 times a day to boil water . . .). The second sentence, in contrast, says in details about the consumer's use of the kettle; in this case, a multiple use on a daily basis. Thus, both sentences can be taken as indicators of a positive opinion. (One can argue that the language of the first sentence is strong enough and does not need confirmation of the user's positive opinion, whereas the latter part does need it. It can happen, however, that the user has been sarcastic. Both sentences invite more information.)
Opinions can be expressed in a descriptive and assessing way, without necessarily being emotionally charged. Recollection of general characteristics, their comparison, and correlation have a pronounced ‘evaluative force’ (Labov Reference Labov1972). Functionally, in those characteristics, some words cannot be modified, whereas associated words can be changed (Leech, Deuchar and Hoogenraad Reference Leech, Deuchar and Hoogenraad1982). Those words are called descriptors. For instance, hot water, boiling water, and cold water are three most frequent remarks about water in kitchen utensils reviews. Here water represents the target concept, thus cannot be modified. The accompanying words hot, boiling, and cold change depending on consumer choices. The predictive power of the descriptors emerges from conscious choices made by consumers when selecting such words. Table 2 shows examples of possible modifications of descriptions.
Examples of description modifications. Descriptions are in italics

In the reviews, consumers evaluate the product by pointing out features that are important to them (e.g., longevity of a car, speed of water boiling by a kettle, and commonplace of social networking). They speak about sensation (warm, bitter), perception (narrow, short), put in pair and group comparison (lighter, tallest), discuss happenstance (always, never), time (now, yesterday), space (above), etc. The descriptive reviews introduced in Table 1 have the following descriptors (in that font):
(i) I have a PC running some very high specifications with over six USB devices, LCD monitor, printer and Ethernet equipment, with everything on at the same time.
(ii) Also with some models the batteries need to be replaced after a few years if you end up using them a lot.
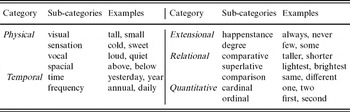
We concentrate on five categories of descriptive characteristics (physical, temporal, quantitative, extensional, and relational), which are further divided into sub-categories (Biber et al. Reference Biber, Johansson, Leech, Conrad and Finegan1999). Table 3 lists the categories, their sub-categories, and examples of individual words.
Description categories, their sub-categories and word examples

The descriptors intensify attention to their references. If the reference is frequently commented on, this may be indicative of its significance and what reviewers consider to be more important in their experience with the product. We, thus, hypothesize that knowledge of how reviewers describe their experience may help in the prediction of opinions. To gather this knowledge, we start with a ‘seed’, i.e., a list of words essential for each sub-category presented in Table 3.
We take several steps to populate the seed for the knowledge extraction. First, we separate between the professional and lay person writing. Both the reviewer groups promote different descriptor types, and we want to omit lexical categories that are more prominent in the professional writing. The professional vocabulary overrepresents such word categories as topical (social, medical), affiliative (royal, American), foreign (ersatz); the used descriptors are often derived (bound-less, nation-al) (Biber et al. Reference Biber, Johansson, Leech, Conrad and Finegan1999). Hence, such words will not be used in the seed.
In contrast, description written by a lay person can be elicited by questions where, when, how, what size, shape, etc. It often contains general quantitative properties (high, some), temporal and frequency parameters (old, yesterday), confidence in happening (can, necessary, probably), and reference to personal experience (anybody, my) (Biber et al. Reference Biber, Johansson, Leech, Conrad and Finegan1999). We are especially interested in a lexicon that describes the experience outreach (everybody, sometimes, yesterday), physical conditions (large, old, hot) and compares goods (different, tallest, cooler, first).
This translates the description categories presented in Table 3 into the following word categories: pronouns of degree; adverbs of time, frequency, degree, and stance; adjectives of size, quantity, extent, time and relation, including comparative and superlative adjectives; ordinal and cardinal numbers.
We purposefully omit emotionally charged words. Note that emotionally charged words can be found in such sources as WordNet-Affect (Strapparava and Valitutti Reference Strapparava and Valitutti2004) and SentiWordNet (Esuli and Sebastiani Reference Esuli and Sebastiani2006a). These sources extend the lexical resource WordNet,Footnote 1 thus, include only the words that are present in the original source. Our choice of descriptors excludes affective words; hence, we expect a restricted overlap with both sources. Indeed, only the descriptor close appears in WordNet-Affect, which assigns it with the joy label. A few descriptors appear in SentiWordNet, where they are assigned with different positive and negative scores. For example, regular, daily, and some have positive and negative scores 0.0, hot has positive score 0.5 and negative score 0.0, cold has positive score 0.0 and negative score 0.375.
Reviewer's stance on issues (I will), proposition of ideas (We believe), and personal appeal (my daily routine) are principal components of delivering personal messages (Sokolova and Szpakowicz Reference Sokolova and Szpakowicz2007). Those factors can emphasize or subdue the experience description. For example, often is stronger in I will often [do something] than in I might often [do something], daily is stronger in personally linked my daily routine than in impersonal a daily routine. In order to account for the possibilities, we augment the initial feature set with stance indicators. These include modal verbs: can, may, will), markers of propositional suggestions (mental verbs: believe, think), and indicators of personal appeal (personal pronouns: I, my, you). The descriptor can be altered by negations (not, nor); thus, we include them in the feature set.
We determined the list of seed words for these word categories in Bolinger (Reference Bolinger1972) and Biber et al. (Reference Biber, Johansson, Leech, Conrad and Finegan1999) and added their synonyms from an electronic version of Roget's Interactive Thesaurus (Roget Reference Roget2006). In order to illuminate the role of factual descriptors, the seed purposefully avoids evaluative/emotive words (excellent, disgusting, poorly). We also refrain from descriptors that are mainly used in reference to humans; hence, omit such words as brave, silly, hurriedly, and slim.
5 Semantic hierarchy of description
We aim to generalize the product reviewing in a way that helps to understand the type of assessment a consumer has just made. We consider that the product characteristics can be assessed directly and indirectly. For example, hot air gives a direct assessment of the air temperature, whereas hotter air assesses it indirectly, through comparison with another temperature. In the direct description of a product, consumer uses absolute terms to assess physical characteristics, duration, timing, and frequency. He/she provides the indirect description of the product by using comparative and superlative words or by estimating happenstance and degree.
In our description categories, the direct description consists of physical, temporal, and quantitative; the indirect description consists of extensional and relational. Each group addresses a specific semantic aspect of the product description:
DirectQuantitative specifies multiplicity and order.
DirectPhysical lists visual, sensual attributes of the reference.
DirectTemporal places references in relative and absolute time frames.
IndirectExtensional reflects on the certainty about the happening of events and their broadness.
IndirectRelational presents a comparative evaluation of the discussed issues.
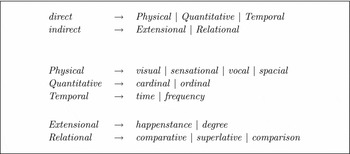
Figure 1 shows the rules for organizing product descriptions in text. The rules have the following form:

where non-terminal must be replaced by one of the alternatives. Alternatives are composed of other non-terminals and individual words (terminals), which are the pieces of the final lexical string. The word assignment to the five groups completes the hierarchical taxonomy of the product description.
Rules for the identification of descriptive comments in text. ‘|’ separate alternatives.

The corresponding hierarchy is built from descriptors introduced in Section 4, it then arranges these words into five groups of comments, and finally combines the groups into direct and indirect types. Individual words are the lowest level of the hierarchy; the middle level generalizes word categories into groups; the highest level applies to the text as a whole. There are 303 rule terminals, not counting the negation terminals. The lowest, lexical, level presents terminals for the word categories discussed in Section 4. The middle level organizes word categories into semantic groups. The highest, the most general, level is concerned with the direct and indirect types of the product assessment.
6 Extraction of syntactic patterns
Our core hypothesis is that under certain condition descriptive words can be useful in Text Mining applications. If a large corpora of product reviews are available, descriptive words can be used to predict consumer opinions. We assume that we can ‘judge a word by the company it keeps’ (Firth 1957). Finding the ‘company’ in which descriptive words appear in the corpora, we can find patterns of how consumers refer to the most memorable experience with the product. We illustrate the idea on the examples from Section 1; the descriptors are in italic; the ‘companion’ words are in bold.
(i) I have a PC running some very high specifications with over six USB devices, LCD monitor, printer and Ethernet equipment, with everything on at the same time.
(ii) Also with some models the batteries need to be replaced after a few years if you end up using them a lot.
In a corpora of reviews, we want to find the set of words that collectively are considered important for the reviewers. We use the rule terminals of the hierarchy introduced in Section 5 and the syntactic features of consumer reviews. Consumer reviews are examples of noncontrived text, i.e., loosely edited, written in the conversational language style. In the noncontrived texts, syntactic choices usually put the descriptors before their correlated references (Biber et al. Reference Biber, Johansson, Leech, Conrad and Finegan1999). For instance, blue shirt, often seen, and normal level appear frequently, whereas built nearby does not. Hence, to find information that is important for the opinion detection, we seek words on the right side of the descriptors.
In order to build the set of words most emphasized by the descriptors, we look for those with a high probability of appearance on the right side of rule terminals. We estimate this conditional probability p(wj|T) by computing the following:
(1)

(2)
where wj is a word, T is the set of all terminals, ti is a terminal, x|y is the event where the word x appears after y in text, m is the size of the data vocabulary, and n(.) is the number of occurrences of an event in the data.
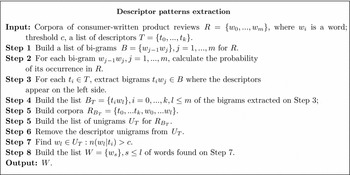
The idea behind the search is the following: two-word sequences ti wj – bigrams that have terminals on their left side – capture the modified and intensified words. After extracting such bigrams, we find modified and intensified words. By calculating the probability of the word occurrence after a terminal, we can find the most frequently modified and intensified words. Concentrating on one-side bigrams prevents the multiple extraction of the same word. We want to insure that the remaining bigrams give a reliable representation of data. Bigrams may not be reliable if they do not appear often in data, for example, if their counts are less that of a threshold c, i.e., n(wj|ti) < c. To determine the threshold, we use N-gram counts, i.e., the number of times N-grams appears in data. Katz' assessment of N-gram counts suggests that counts large than five are reliable (Katz Reference Katz1987; Jurafsky and Martin Reference Jurafsky and Martin2009). The procedure Descriptor Patterns Extraction is presented in Figure 2. Further, the patterns represent text in the learning experiments.
The procedure for finding and extracting frequently modified and intensified words in text. The procedure uses the same notations as in (1) and (2).

7 Problem statement in terms of machine learning
We apply supervised learning techniques that construct a function on a set of input and output pairs ( , y), where represents a text and y is its opinion label (training data). This function is then used to predict opinion labels on previously unseen examples (testing data). Most sentiment analysis studies are stated as binary classification problems; for instance, positive/negative word orientation, subjective/objective statements, and texts belonging to positive/negative categories. In this work, however, we solve two kinds of learning problems:
Regression: The review texts are assigned numerical opinion tags, the learning goal is to predict the tags of previously unseen reviews.
Classification: The review texts are labeled into positive and negative opinion categories, the learning goal is to classify previously unseen reviews as positive or negative.
We hypothesize that consumer opinions can be accurately learned from the descriptors used in the product reviews. To find opinions in reviews, we build text representations from the descriptors discussed in Section 4. The semantic hierarchy is applied to extract lexical features from texts. It avoids the use of emotionally charged words; consequently, the constructed text representations do not necessarily exhibit sentiments and emotions. The extracted features represent the texts in ML experiments. In the experimental part, we show that the text representation allows the learning algorithms to reliably predict the author's opinion about the products.
We learn opinion not from separate words or phrases but from complete texts, labeling the texts as positive or negative (classification) or with numeric values (regression). In the learning experiments, each text is represented by a vector x 1, . . ., xn, y, where xi is the number of occurrences of a word wi, a feature, appearing in the text, and y is the opinion label. As a weighting factor, we use normalization of the vector attributes with respect to the number of words in the text. It eliminates the bias introduced by the length of the text. On the basis of the rule terminals and the extracted words, we construct the following three feature sets for text representation:
(1) Terminals of direct rules augmented by personal pronouns; c was determined by the lowest frequency of personal pronouns.
(2) Terminals of all the hierarchy rules augmented by the most frequent extracted words; c was determined by the lowest frequency of personal pronouns.
(3) The terminals and all the words extracted by the procedure presented in Figure 2; we used Katz' estimate to determine the cut-off threshold c = 5 (Katz Reference Katz1987; Jurafsky and Martin Reference Jurafsky and Martin2009).
We solve the binary classification problem on four data sets, one more data set is used to solve both the regression and classification problems.
We use Support Vector Machine (SVM), K-Nearest Neighbor (KNN) and decision tree algorithms, M5P Trees, (regression), and REP Trees (classification). We use Weka's machine learning package (Witten and Frank Reference Witten and Frank2005). To estimate the utility of our text representation, we applied the following baselines: for regression – the mean overall baseline, and for classification problems – the majority class baseline. Both baselines allow us to show how the linguistics-based approach is better than a random choice. For the best learner selection, we use ten-fold cross-validation because of its generalization accuracy and the reliability of its results, Classification measures use the counts given in Table 4.
(3)
evaluates the overall performance. Sensitivity and Specificity provide details about the performance on positive and negative classes, respectively,
(4)
(5)
Confusion matrix for binary classification

In order to evaluate the performance on regression problems, we use Relative Absolute Error (RAE) and Root Relative Squared Error (RRSE) as follows:
• Relative Absolute Error shows how well an algorithm approximates data as a whole
(6)
• Root Relative Squared Error applies finer-grained estimation that uses real value distances from its mean
(7)
where yi, i = 1, . . ., N are numerical labels provided by data, ai is the numerical value of yi as decided by an algorithm, y is the mean of data's labels, and N is the data size. RRSE's values, which reflect on approximation of individual entries, complement RAE.
8 Empirical results of opinion learning
8.1 Classification
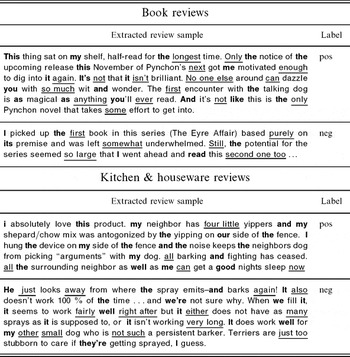
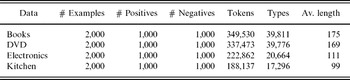
We experiment on messages posted on the Internet written by the general public. This type of data is suitable for the application of tools based on the general use words (Crystal Reference Crystal2006). We ran binary classification experiments on reviews of four product types: books, DVD, electronics, and kitchen & houseware. Every set assessed one type of consumer goods, it has 2,000 labeled reviews, all evenly split between 1,000 positive and 1,000 negative examples. A typical review contains many fields of information, of which we only kept the texts. See Table 5 for examples of texts. In those texts we have marked two types of features: those directly found in the hierarchy of Figure 1 and those determined through the extraction procedure of Figure 2.

The review texts are long enough to provide meaningful communication and lexical information. Table 6 shows some descriptive statistics of the data.
Customer-written reviews from Amazon.com pre-processed by Blitzer et al. (Reference Blitzer, Dredze and Pereira2007). Texts (from all four data) they considered as ambiguous opinions were deleted

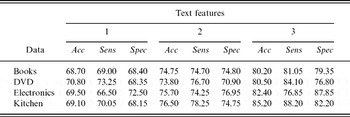
We want to establish a link between information extracted by patterns and the text opinion categories, positive or negative. We expect nonlinear dependencies between the terminals' appearance in texts and a speaker's opinion. SVM performed considerably better than other algorithms on all the four data sets. SVM, known for its high accuracy in text classification, does not make any assumption about the data distribution and can work with nonlinear dependencies, albeit on one level of learning. We only report SVM results obtained with Weka's implementation.Footnote 2 We compare text representations built according to the rules presented in Figure 1. Table 7 reports learning results obtained on the three representations (1), (2), and (3) introduced in Section 7.
SVM's classification accuracy of positive and negative opinions as percentage. Accuracy (Acc) shows how effective is the approach in prediction of previously unseen examples, Sensitivity (Sens) – prediction of positive examples, Specificity (Spec) – prediction of negative examples

All the reported values are obtained with near-linear kernels (exp = 0.75, . . ., 0.92) and a small error penalty for misclassification of training examples (C = 1.05, . . ., 1.21). As a baseline, we apply SVM on texts represented by the feature set (1). All the selected words appear frequently in the data and provide substantial information about texts. These features include adverbs of degree and adverbs of frequency that were used by Benamara et al. (Reference Benamara, Cesarano, Picariello, Reforgiato and Subrahmanian2007) in sentiment classification. Use of set (2) features makes difference in accuracy to be statistically significant (paired t-test, p = 0.010). When we use all the extracted words, the difference becomes more pronounced (paired t-test, p = 0.003).Footnote 3
For each representation, the classification results are close across the data sets. However, there is a remarkable difference between the Electronics data and the three other sets. Let's consider true classification of the positive and negative reviews. For books, DVD, and kitchen sets, the positive reviews are always classified more correctly than the negative ones (the only exception is a tie for books on the representation 2). The electronics set provides the opposite results: the negative reviews are always better classified than the positive ones.
We obtained the results in 2008 or early 2009. While the paper was in progress, some studies reported results on the same data. In a fully supervised learning, with ten-fold cross-validation model selection, Dasgupta and Ng (Reference Dasgupta and Ng2009) reported the best Accuracy as follows: books – 77.6%, DVD – 80.6%, electronics – 79.3%, and kitchen & houseware – 81.7% (Specificity and Sensitivity were not reported). On the books, electronics, and kitchen sets, our best accuracy is higher than the best accuracy reported by Dasgupta and Ng (Reference Dasgupta and Ng2009). The difference is statistically significant (paired t-test, p = 0.0071). On the DVD set, our best accuracy is slightly lower than reported by Dasgupta and Ng (Reference Dasgupta and Ng2009): 80.50% versus 80.60%.
Overall, our results show that the extracted features provide a well-balanced classification of the data sets and the classes. On all the four data sets, our best accuracy is more than 80%: kitchen – 85.20%, electronics – 82.40%, DVD – 80.50%, and books – 80.20%. With exception of electronics' 3rd representation, on all the four data sets difference between Sensitivity and Specificity is < 10%. This can only be achieved if the algorithm is successful in learning both positive and negative classes.
8.2 Regression and classification
We ran another set of experiments on the consumer-written reviews introduced by Hu and Liu (Reference Hu and Liu2004). The task was to assign positive or negative opinion labels to text segments. The authors reported a number of results, ranging from Recall 68%, Precision 56% to Recall 80%, Precision 72%.
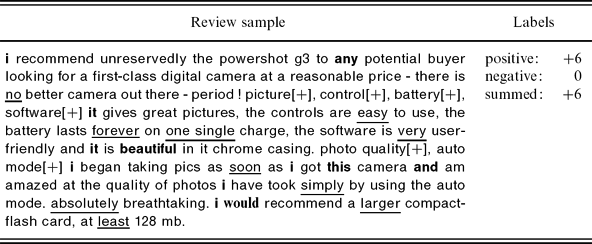
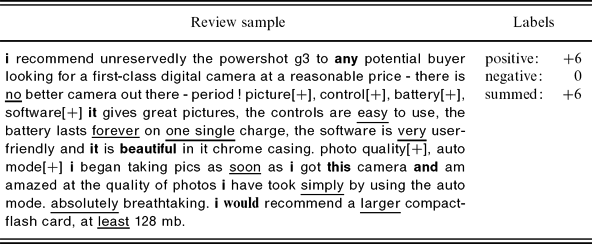
The same data were used for regression studies by Sokolova and Lapalme (Reference Sokolova and Lapalme2008). There are 314 free-form text commentaries; the average size of a review is 241 words. The text segments may have semantic tags on positive and negative opinions (see Table 8 for a text sample). Texts marked with a mixture of positive and negative opinion tags are more realistic, albeit difficult, environment for machine learning than text labeled exclusively with either a positive or a negative opinion tag.
A sample from a consumer review. The sample's six segments have positive tags and zero segments have negative tags. Note that some sentences remain untagged. Terminals of rules in Figure 1 are underlined; the extracted words are in bold
Although three numerical tags for each text make available multi-labeled learning, we avoid this option because of the small size of the data set. As the access to labeled data is restricted to 314 texts, we solve one uni-labeled problem at a time, for positive opinions, negative opinions, and the summed opinions. We first use numerical tags to define regression problems, then discretize the tags to build three learning problems for classification. Learning one label at a time allows the estimation of the fitness of learning algorithms to model positive, negative, and the summed opinions, respectively.
For regression problems, for each text, we computed three numerical labels. The labels reveal the strength of the expressed opinions as follows:
• The number of positive tags; its range in the data: 0–24.
• The number of negative tags; its range in the data: −18–0.
• A signed sum of the two numbers; its data range is −13–24.
On state classification problems, we apply unsupervised equal-frequency discretization to the numerical labels (Reinratz Reference Reinratz1999). We separately discretize the three label sets with the following algorithm:
• Compute mid-points between any two adjacent distinct label values.
• For each mid-point
— compute the cumulative sum, i.e., number of points to its left.
• For i = 1, . . ., n (n = 2 in a binary case)
— for each cumulative sum
– compare the cumulative sum with
;
— return the mid-point closest to
.
• Use the returned points to divide labels into n categories.
 ;
This discretization makes fine distinctions between the data that are close together (with 4–6 positive opinion labels) and ignores big differences among the data that are far apart (with 18–24 positive opinion labels). The resulting classification problem could be dubbed as stronger versus weaker classes. The classes built by the discretization procedure are as follows:
• For positive opinion, weaker: 0–2, stronger: 3–24.
• For negative opinion, weaker −1–0, stronger: −18–2.
• For the summed opinion, weaker: −13–1, stronger: 2–24.
In order to evaluate classification, we use Accuracy and Sensitivity. Given the numerous performance comparisons, these two measures should provide sufficient support for performance evaluation.
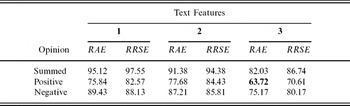
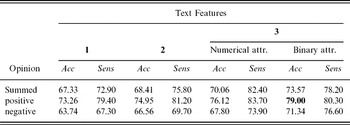
For all the learning problems, SVM was considerably more accurate than the other algorithms. The only exception was classification of summed opinions from numerical attributes. In this problem, REP,'s accuracy was close to that of SVM. KNN's performance was the weakest, although its results were more consistent for different problems than those of other algorithms (RAE: 94.67–96.80, Accuracy: 61.15%–63.30%). Tables 9 and 10 report SVM,'s best results in the measures listed in Section 7.
SVM's results in regression learning of opinions; the feature sets are defined in Section 7. The best, smallest error is in bold. The mean overall value baseline: RAE – 100.24, RRSE – 101.09

SVM's Accuracy and Sensitivity (in per cent); the feature sets are defined in Section 7. The best, biggest accuracy is in bold. The majority class baseline: ACC – 52.55

In regression problems, learning results of a positive opinion turned out to be more accurate. Hence, relations between features representing descriptive details and positive opinions are easier to detect than those for other problems. It gives a statistically significant difference over the baseline (paired t-test, p = 0.032). In addition, we compared the results with those of Sokolova and Lapalme (Reference Sokolova and Lapalme2008). Our current results considerably improve RAE and RRSE. For both measures, the best results reported in this work are statistically significant difference from the previous best results (RAE: paired t-test, p = 0.0408; RRSE: paired t-test, p = 0.0418).
Classification better differentiates between stronger and weaker positive opinions than between stronger and weaker negative opinions. Learning the summed opinion lies somewhere in-between these two cases, as would have expected. In order to provide a more thorough comparison with Sokolova and Lapalme (Reference Sokolova and Lapalme2008), we solve the three classification problems on numerical and binary attributes of the feature set 3 (defined in Section 7).
For the most informative feature set 3, the use of binary instead of numerical attributes improved accuracy of classification. The two-tailed p-value equals 0.0040, a statistically significant difference. This means that a mere appearance of a word signals more about a class than the number of its occurrences. While the classification of the stronger classes is more accurate for numerical attributes (tp is higher), for binary attributes tp becomes lower; hence, the difference between the classification of stronger and weaker classes diminishes.
If compared with the previous results (Sokolova and Lapalme Reference Sokolova and Lapalme2008), binary attributes improve classification Accuracy of opinions (paired t-test, p = 0.6292), whereas numerical attributes do the opposite (paired t-test, p = 0.1729). Both differences are not statistically significant. For tp values, the situation is reverse: numerical attributes provide statistically significant improvement with previous results (paired t-test, p = 0.0071), whereas for binary attributes the difference is not statistically significant (paired t-test, p = 0.5842). Note that better learning of stronger and weaker positive opinions is consistent with previous results.
8.3 Discussion
A legitimate question arises about the contributions of various descriptors to the opinion learning results. Such question may have multiple answers, where each answer is associated with a different learning problem. To support this claim, we applied Consistency Subset Evaluation to the set introduced in Section 8.2. The method finds the smallest subset s of features with Consistencys with class labels equal to that of the full feature set (Hall and Holmes Reference Hall and Holmes2003)
(8)
where j is the number of distinct combinations of attribute values for s, |Di| is the number of occurrences of the ith attribute value combination, |Mi| is the size of the majority class for the ith attribute value combination, and N is the size of the data set. We used Weka's implementation of the algorithm (Witten and Frank Reference Witten and Frank2005).
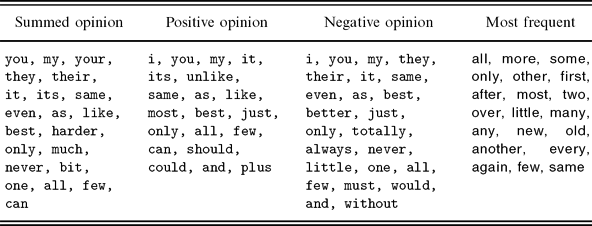
The identified subsets, shown in the left three columns of Table 11, contain both the terminals and words extracted by the procedure from Figure 2. All the words are ordered within the subsets. The terminals belong to Relational subrules of Figure 1. The subsets for summed and positive opinion add terminals from Extensional subrules. The subset for negative opinion contains fewer terminals from those subrules but adds terminals from degree subrules. Remarkably, only two attitudinal words best, better appear in all the subsets. The two words have appeared in text representation after being found by Descriptor Patterns Extraction (Figure 2). The rightmost column of Table 11 lists twenty descriptors that are most frequent in the used data sets; the descriptors are ordered according to their frequency.
Smallest subsets of features with the same consistency level with the class values as the full set of all features and twenty most frequent descriptors
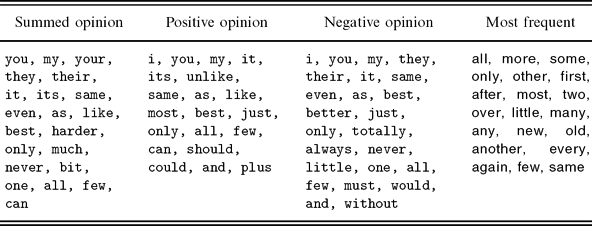
In total, the following features appear in all the three opinion sets: you, my, it, same, as, best, only, all, few. Some features appear in two sets: its, like, can – in the summed and positive sets, they, their, even, never, one – in the summed and negative sets, i, just, and – in the positive and negative sets. From these features, summed and negative features overlap the most (five features), whereas positive and summed opinion sets and positive and negative opinion sets overlap on three features each. Remaining features appear exclusively in one set: your, harder, much, bit – in the summed opinion, unlike, most, should, could, plus – in the positive opinion, and better, totally, always, little, must, would, without – in the negative opinion.
Note that all the consistency subsets contain personal pronouns. Previously, relations between positive and negative affected and the use of personal pronouns was limited to the scope of electronic negotiations. Positive texts represented successful negotiations and negative texts constituted unsuccessful negotiations. Hine et al. (Reference Hine, Murphy, Weber and Kersten2009) looked at the distribution of singular and plural pronouns in positive and negative negotiations. The use of pronouns in positive and negative negotiations was studied by Sokolova and Szpakowicz (Reference Sokolova and Szpakowicz2007). The authors constructed language patterns, including those of personal pronouns, and used them in classification of negotiation texts. In general, sentiment analysis studies did not focus on the use of personal pronouns. Our results show that personal pronouns may be important factors in expressions of opinions. We invite further studies of this topic.
The way the consistency feature set has been constructed may suggest that the features can provide a reasonably high accuracy of learning. However, practice does not support this assumption. The best accuracy provided by the consistency features was only 68% compared to 79% obtained on the full feature set. It is worth noticing that the most frequent descriptors appear in the subsets, albeit not in the order of their frequencies. The results of Sections 8.1 and 8.2 can be compared with human understanding of opinions. Human agreement on whether a message provides a positive or a negative opinion about the discussed topic could be 78% for positive opinions (Sensitivity) and 74% for negative opinions (Specificity) (Nigam and Hurst Reference Nigam and Hurst2004). Agreement on the intensity of opinions, which we consider indicative for regression results, can be 0.77 (Wilson et al. Reference Wilson, Wiebe and Hwa2006). To sum up our work, we present the following procedure for analyzing opinions:
Step 1. Decide the type of opinions to study: opinions about products, people, services, etc.
Step 2. Find word categories typical of the topic of opinion.
Step 3. Find word categories that can express a detailed description of the topic.
Step 4. Use the grammatical rules to extract words modified by those found in Step 3.
Step 5. Use all extracted words as features to represent the text.
9 Related work
The user-generated Web content is created by contributors who are active outside professional routines and platforms (van Dijck Reference van Dijck2009). Texts written by the Web end users exhibit different style, grammar, and vocabulary than those written by professionals (refer to t-1 and t-2 in Section 2). Subjectivity of user opinions promoted the development of opinion analysis. The discipline focuses on whether a text is subjective, bears positive or negative opinion, or expresses the strength of an opinion. It has received a vast amount of attention in the recent years and the number of publications has grown exponentially (Liu Reference Liu2007).
Further in the section, we are concerned with opinion analysis of complete texts, which correspond to u-3 in Section 2. For a good discussion of research on sentiment/opinion analysis of terms (u-1 of the taxonomy), phrases, sentences, and other text segments (u-2 of the taxonomy), the reader can refer to Breck, Choi and Cardie (Reference Breck, Choi and Cardie2007). For a list of papers on sentiment analysis, the reader can refer to Kessler and Nicolov (Reference Kessler and Nicolov2009). We also emphasize that here the cited work deals with opinion categories, i.e., opinion classification. So far, regression learning of opinions had not attracted considerable research attention.
Statistical feature selection methods are often used to represent texts in opinion and sentiment studies (Pang and Lee Reference Pang and Lee2005; Ng, Dasgupta and Arifin Reference Ng, Dasgupta and Arifin2006). Although the statistical selection can be applied to different domains, they sometimes involve complex optimization problems, such as the NP-hard approximation problem (Ben-David et al. Reference Ben-David, Blitzer, Crammer and Pereira2006). Complete texts can be represented through N-grams or patterns and then classified as opinion/non-opinion, positive/negative, etc. (Riloff, Patwardhan and Wiebe Reference Riloff, Patwardhan and Wiebe2006). Jindal and Liu (Reference Jindal and Liu2008) used descriptive text statistics to represent texts in opinion spam studies. We instead relied on semantics of word categories and syntactic patterns of their use.
Some opinion analysis research relied on a list of characteristics of reviewed products. Hu and Liu (Reference Hu and Liu2004) extracted features based on association rule mining algorithms in conjunction with frequency to extract main product characteristics. These characteristics are then used to extract adjacent adjectives that are assumed to be opinion adjectives. Later these opinion adjectives are used to find product characteristics that are mentioned only once or few times. Popescu and Etzioni (Reference Popescu and Etzioni2005) extracted product characteristics from noun phases in the data and matched them with known product features. In contrast, we opted for a method that does not involve the use of the domain's content words; hence, can be applicable in various domains.
Blitzer et al. (Reference Blitzer, Dredze and Pereira2007) combine supervised and semi-supervised structural correspondence learning to classify reviews from books, kitchen, electronics, and DVD sets. The authors use a fully automated feature selection based on frequency and the mutual information of words. Note that those sets contain labeled and a large number of unlabeled examples. The labeled parts of the data sets were reported recently. Dasgupta and Ng (Reference Dasgupta and Ng2009) report an active learning method that automatically identifies unambiguous positive and negative reviews first and then uses a discriminative learner and a number of manually labeled reviews to classify ambiguous reviews. The authors also report fully supervised learning results by Support Vector Machine that help to assess our method in Section 8.1. We have shown that nonemotionally charged words can provide statistically significant improvement in opinion classification.
Li et al. (Reference Li, Huang, Zhou and Lee2010a) mine the four sets for sentences containing personal pronouns (personal sentences) and those with impersonal pronouns (impersonal sentences); the remaining sentences are classified automatically as personal or nonpersonal. All the personal sentences are then combined in the personal view set, whereas all the nonpersonal sentences are combined in the impersonal view set; all the sentences constitute the single-view set. A maximum entropy classifier trained on all the sentences (the single-view classifier) achieves a slightly lower accuracy than the one reported by Dasgupta and Ng (Reference Dasgupta and Ng2009), and the one reported in Section 8.1 of the current work: books – 76.54%, DVD – 78.84%, electronics – 80.74%, and kitchen & houseware – 82.90% (Specificity and Sensitivity were not reported). However, ensembles of the three classifiers (i.e., personal, impersonal, and single-view) improve the performance from 79.49%–85.65%. Li et al. (Reference Li, Lee, Chen, Huang and Zhou2010b) equally split data into training and test sets; as in the previous publication, the authors did not separate results on positive and negative classes. When the sets were represented by all uni- and bigrams, the Accuracy was reported as follows: books – 75.5%, DVD – 75.0%, electronics – 77.9%, and kitchen & houseware – 81.8%. The empirical evidence shows that albeit these nonsemantic features using all the words that appear in the data, they do not provide a better accuracy, namely, our method and Li et al. (Reference Li, Lee, Chen, Huang and Zhou2010a) obtain a higher accuracy.
Syntactic and semantic features that express the intensity of terms are used to classify the opinion intensity in text (Wilson et al. Reference Wilson, Wiebe and Hwa2006). Benamara et al. (Reference Benamara, Cesarano, Picariello, Reforgiato and Subrahmanian2007) studied the impact of combining adverbs of degree with adjectives for the purpose of opinion evaluation. Our approach deals instead with opinion analysis, which is broader than the analysis of sentiments. We focus on the formalization and use of nonemotional lexical features.
Outside of sentiment analysis, machine learning is used to study opinions from the point of view of predictive power (Kim and Hovy Reference Kim and Hovy2007), strength (Wilson et al. Reference Wilson, Wiebe and Hwa2006), and in summarization and feature extraction studies (Feiguina and Lapalme Reference Feiguina and Lapalme2007). Although Kim and Hovy (Reference Kim and Hovy2007) generalized bi- and trigrams found in texts (NDP will win and Liberals will win became Party will win), they did it bottom-up, without providing theoretical background. We instead used a top-down hierarchical approach based on pragmatic and lexical rules.
Although Wilson et al. (Reference Wilson, Wiebe and Hwa2006) studied sentences and sentence clauses, we consider their work relevant to the current research. The authors distinguished subjective versus objective opinions. They also distinguished weak, medium, and strong intensity of subjective expressions. Their initial manual clues included verbs of judgment (reprove, vilify); in the final text representation they use syntax clues. In contrast, to build text representation, we look for patterns of use of descriptive adverbs and adjectives, pronouns of degree, ordinal and cardinal numbers, and stance verbs.
Experience and factuality analysis is another subject that can be related to our research. Stenvall (Reference Stenvall2008) studied journalistic reporting and reports linguistic research on the relations between factuality, objectivity, and emotion. The author suggests that transitivity, nominalization, and grammatical metaphor, the three main ideas of Halliday's Functional Grammar (Halliday Reference Halliday1994), are useful tools to analyze emotion impact on factual and objective reporting of events. Inui et al. (Reference Inui, Abe, Hara, Morita, Sao, Eguchi, Sumida, Murakami and Matsuyoshi2008) worked on evidence mining in the consumer-written reviews in Japanese. From their work, we draw some conclusions that can be helpful for the related research in languages other than Japanese:
• Feature engineering should be applied to represent complex language combinations.
• A thorough investigation is necessary in what categories of evidence are useful for text classification.
Evaluative adjectives (e.g., awful, reassuring, dangerous) and patterns of their use were analyzed in corpus-based studies by Hunston and Francis (Reference Hunston and Francis2000), who categorized adjectives along the scales good/bad, easy/difficult, probable/impossible, etc. but do not consider a hierarchy of opinion disclosure. De Marneffe, Manning and Potts (Reference de Marneffe, Manning and Potts2010) studied affective and non-affective scalar adjectives in answers to polar questions. The authors applied logistic regression to interpret numerical ranges of non-affective adjectives (little, long, tall).
A pragmatic–lexical hierarchy of semantic verb categories was proposed in our previous work (Sokolova and Lapalme Reference Sokolova and Lapalme2008). We showed that the hierarchy worked well in environment where negative opinions were expressed indirectly, i.e., without the use of negative adjectives or adverbs. We applied the hierarchy to study debates of the US Federal Senate. In the current work, we continue to analyze non-affective words, but concentrate on the use of adverbs, adjectives, and pronouns.
10 Conclusion and future work
In this work, we have analyzed consumer-written reviews, a part of user-generated Web content. These user-generated texts belong to the ever growing portion of the Web data. We presented an opinion learning method inspired by general descriptive words used by product consumers. Our goal was to build rules of general description that can be elicited by questions where, when, how, what shape, and does not directly convey emotions or affects. To satisfy these two conditions, the rules do not rely on domain content words or emotional words.
We proposed a hierarchical text representation (the highest level representing the description type), semantic rules (the middle level), as well as the rules' terminal categories (the lowest level dealing with words). The rule terminals were used to extract the information from the consumer-written product reviews. The extracted words and rule terminals were used to represent texts in learning experiments. Our study is language-dependent, but the main idea – the analysis of nonemotional descriptions – can be applied to study opinions in languages other than English.
For classification of positive and negative opinions, we used four data sets. Each set represented reviews of a different product. In the regression and classification experiments, we used a data set that had positive, negative, and summed opinion tags. The results show a significant improvement over baselines and related studies and support the competitiveness of our approach. They also show that lexical features are effective in learning opinions. In fact, the results are comparable with human agreement on opinions.
Apart from studies of user-generated content, our approach can be applied to analyze language in texts that traditionally lack emotive and affective words, such as in the medical and legal domains. These areas are getting more attention from the Text Data Mining community as evidenced by many publications in the Journal of the American Medical Informatics Association Footnote 4 and the International Journal of Law and Information Technology.Footnote 5 Our method has been used to discover opinion about products. Other types of opinions may require the use of other word categories or different grammatical foundations, for instance, opinions about service or personnel (Scriven Reference Scriven1981).
So far, we applied supervised learning algorithms that require labeled data. Labeled data are usually expensive to obtain; thus, its availability is limited. We intend to test semi-supervised approaches that use both labeled and unlabeled data. As we have discussed in the related work, ensembles of classifiers can improve accuracy of learning. For review classification, ensembles were applied on statistically selected features. Hence, it may be beneficial to apply ensembles on the data represented by semantic features. We also want to take into account language knowledge obtained from general language sources. For example, language patterns can be built using word frequencies computed from the British National Corpus (Leech, Rayson and Wilson Reference Leech, Rayson and Wilson2001).
Acknowledgments
The authors thank anonymous reviewers for valuable and helpful comments.