Introduction
More than thirty developing countries are currently experiencing below replacement fertility levels (United Nations Population Division, 2013). Although the factors associated with low fertility in developed countries are broadly explored in the literature (for recent reviews, see Balbo et al. (Reference Balbo, Billari and Mills2013) or Caldwell and Schindlmayr (Reference Caldwell and Schindlmayr2003)), it remains an open question whether the spread of low fertility rates, and the variation of fertility within countries, in developing countries are driven by similar factors. For example, it is conceivable that economic factors play a larger role in explaining low fertility in developing countries as compared to the more affluent developed countries. Or, does the often relatively swift transition from high fertility to low fertility, which is characteristic of many developing countries, imply that the drivers of national fertility trends and within-country variation are distinct from those of more developed contexts, where low fertility has been commonplace for many decades?
In the last decades, a great deal of research has focused on understanding fertility differences across developed countries, especially between low- and lowest-low fertility regimes (Kohler et al., Reference Kohler, Billari and Ortega2002; Myrskylä et al., Reference Myrskylä, Kohler and Billari2009). Fertility at later ages has an important role in this heterogeneity (Myrskylä et al., Reference Myrskylä, Kohler and Billari2011; Myrskylä et al., Reference Myrskylä, Goldstein and Cheng2013), and a recent study has documented a recovery in the TFR of lowest-low fertility countries (Goldstein et al., Reference Goldstein, Sobotka and Jasilioniene2009), which is driven by a slowing down of fertility postponement and an increase in fertility rates at relatively older ages. Nevertheless, despite the recoveries from earlier fertility troughs, Europe continues to be characterized by very low fertility and a striking fertility divide between Northern and Western Europe, with the exception of Germany, Austria and Switzerland, on the one hand, and Southern and Eastern Europe on the other. Supportive work–family environments and gender equity values are thought to be among the main explanations for higher fertility levels in Northern and Western Europe (McDonald, Reference McDonald2000).
To shed light on the social determinants of low fertility in developing countries, this study used Brazil since it is a heterogeneous country that reached below replacement fertility levels in the 2000s. Institutional heterogeneity in Brazil prevails because labour policies do not harmonize work and childrearing effectively in the country (Sorj et al., Reference Sorj, Fontes and Machado2007), and access to child care, especially low-cost and high-quality child care, is likely to be one important dimension in which substantial regional heterogeneity exists. Gender equality is also at low levels, with Brazil being in the lower range of the Global Gender Gap Index (85th position among 134 countries; Hausmann et al., Reference Hausmann, Tyson and Zahidi2010). However, in a heterogeneous country, regional variation is likely to be substantial and is more likely to depend on local institutional and socioeconomic contexts. In this regard, this study explored Brazil’s regional heterogeneity using multilevel logistic regressions that estimated the likelihood of married or cohabiting women having a birth using the 1991, 2000 and 2010 Censuses with gender equality, human development, the ability of mothers with young children to work and female labour force participation as predictor variables at the municipality level, and socioeconomic characteristics at the individual level. Although gender equity is the most recommended theoretical concept to study gender and fertility (McDonald, Reference McDonald2013), the data used cannot capture perceptions of fairness in gender roles and opportunities, and the focus was instead on the equality of measurable gender outcomes at the municipality level.
Background
The fertility decline in Brazil
Socially, economically and culturally Brazil is a very heterogeneous country. It has the fifth largest territory in the world, encompassing diverse populations and biomes. Alongside this socioeconomic heterogeneity, different demographic regimes co-exist with distinctly different fertility patterns (Carvalho & Wood, Reference Carvalho and Wood1994). For example, fertility started to decline in the south and south-east regions in the 1960s, roughly at the same time as in Chile and Costa Rica, but only 15 years later it started to decline in the north and north-east regions of the country (Potter et al., Reference Potter, Schmertmann, Assunção and Cavenaghi2010). The fertility heterogeneity across Brazil’s territory remains, with the states of the north and north-east having the highest fertility levels, along with the lowest indicators of social and economic development. The fertility transition from high to replacement levels is mostly attributed to socioeconomic development, urbanization and mortality. Potter et al. (Reference Potter, Schmertmann and Cavenaghi2002), for instance, found that a decrease in child mortality, and an increase in electrification, schooling and female labour force participation, were strongly associated with the onset and pace of the fertility decline in Brazil, while a decrease in the percentage of Catholic individuals was only weakly associated with the decline.
Because of the strong relationship between fertility and development in Brazil, many scholars have also emphasized the role of Federal Government policies in the decline in fertility, despite the absence of a targeted public policy to reduce fertility (Carvalho et al., Reference Carvalho, Sawyer and Paiva1981; Martine, Reference Martine1996; Perpétuo & Wong, Reference Perpétuo and Wong2006). In particular, these studies emphasized the government’s role, since the 1950s, in industrialization and technology development, sanitation reform and electrification, improvements in public education and health services, and the solidification of the social security system. Additionally, some authors have emphasized the role of mass communication (Faria & Potter, Reference Faria and Potter1999; Ferrara et al., Reference Ferrara, Chong and Duryea2012), hypothesized to affect fertility through changes in the perception of social roles, favouring non-traditional social norms (Faria & Potter, Reference Faria and Potter1999). A recent paper using the 1991 Brazilian Demographic Census showed that the expansion of Globo’s coverage (the main soap opera producer in Brazil), was associated with lower birth probability between 1979 and 1991 (Ferrara et al., Reference Ferrara, Chong and Duryea2012). The association was more prominent in women of low socioeconomic status and in the middle or later ages of their reproductive life.
Contemporary below replacement fertility levels in Brazil occur together with a postponement of fertility (Rosero-Bixby et al., Reference Rosero-Bixby, Castro-Martín and Martín-García2009; Rios-Neto & Miranda-Ribeiro, Reference Rios-Neto and Miranda-Ribeiro2015) and an increase in cohabitation (Esteve et al., Reference Esteve, Lesthaeghe and López‐Gay2012), suggesting that Brazil is acquiring characteristics of the Second Demographic Transition, as defined by Lesthaeghe (Reference Lesthaeghe2010). Three previous studies have explored low fertility in Brazil: Yazaki (Reference Yazaki2003), Wong and Bonifácio (Reference Wong and Bonifacio2008) and Alves and Cavenaghi (Reference Alves and Cavenaghi2009). These studies analysed changes in the proximate determinants of fertility, more specifically type of contraception and age at marriage. The present paper contributes to the literature by considering the social factors associated with fertility across Brazilian’s municipalities, focusing on the regional variation in gender equality and the employment of mothers.
Brazilian fertility in context
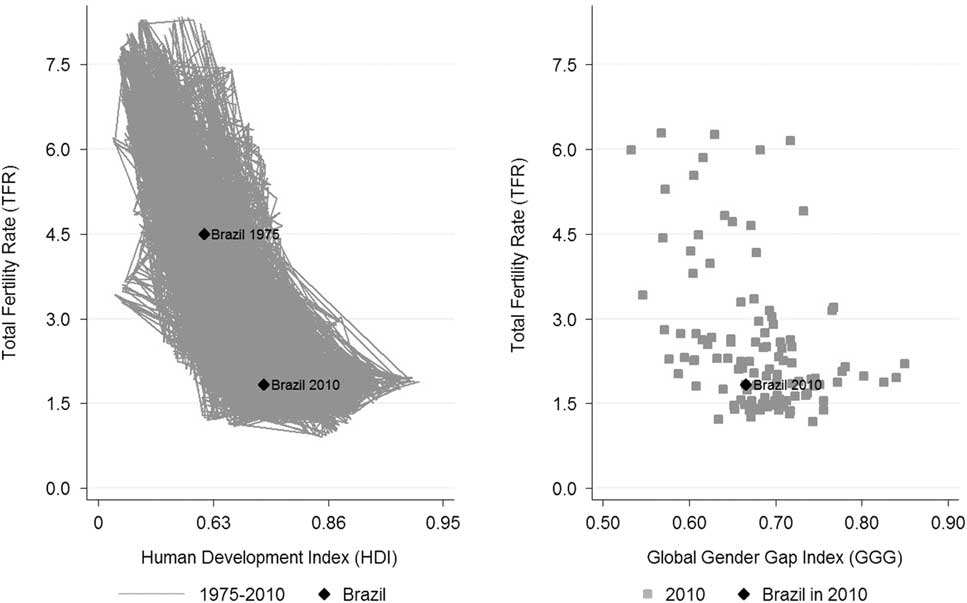
This section briefly situates Brazilian fertility in the global context and presents its regional heterogeneity. The left panel of Fig. 1 shows the inverted J-shaped relation between the Total Fertility Rate (TFR) and the Human Development Index (HDI) as proposed by Myrskylä et al. (Reference Myrskylä, Kohler and Billari2009). It can be observed that between 1975 and 2010, Brazil had a substantial improvement in its HDI and the TFR decreased considerably. However, despite its progress, Brazil’s HDI remained relatively low in 2010 (0.76) when compared with OECD countries. The right panel of Fig. 1 shows the TFR and the Global Gender Gap Index (GGG) in 2010 (Hausmann et al., Reference Hausmann, Tyson and Zahidi2010). The GGG is a combination of education attainment, economic participation and opportunity, health and survival, and political empowerment of women relative to men for 134 countries. No clear association is apparent between TFR and GGG. Brazil is located in the centre of the cloud with a GGG of 0.67, ranking 85th across the set of countries for which the GGG was available.
The association between the Total Fertility Rate (TFR) and the Human Development Index (HDI) for 135 countries from 1975 to 2010 and between the TFR and the Global Gender Gap Index (GGG) in 2010. Data source: Myrskylä et al. (Reference Myrskylä, Kohler and Billari2011) and Hausmann et al. (Reference Hausmann, Tyson and Zahidi2010). HDI values are in log scale (−log(1−HDI)).

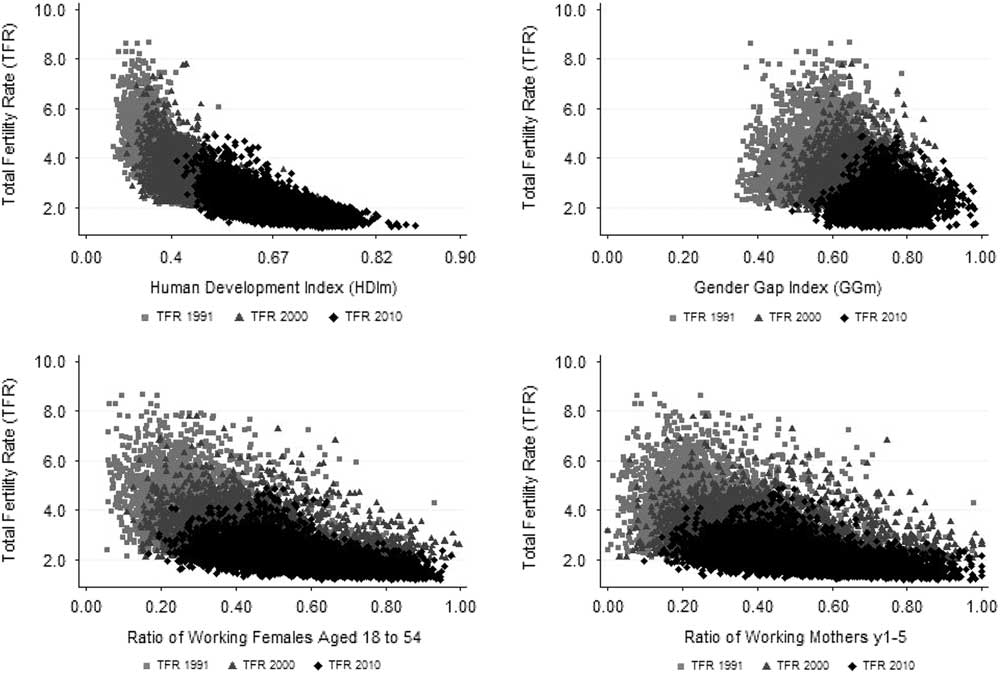
Figure 2 shows the TFR and the municipality-level variables used in the statistical models. The panel at the top left of the figure shows the Human Development Index in Brazilian municipalities (HDIm) in 1991, 2000 and 2010 and the municipality-level TFRs. The TFR and HDIm are calculated by the United Nations Development Programme for Brazil (http://www.pnud.org.br/IDH/). The HDIm has three dimensions: life expectancy, per capita income and education. A strong negative correlation between TFR and HDIm can be observed in the 20-year span, with fertility decreasing as HDIm increases. A significant variation in HDIm levels across Brazilian’s municipalities can also be observed, with the 2010 HDIm ranging from 0.42 in the state of Pará (in the north of Brazil) to 0.82 in the state of São Paulo (in the south-west of Brazil). This heterogeneity explains the importance of including HDIm in the estimations. In general, a negative association between fertility and development is expected in Brazil because the country has not attained advanced levels of development (HDI>0.9), where previous studies have documented the emergence of a positive HDI–TFR association (Myrskylä et al., Reference Myrskylä, Kohler and Billari2009).

The top right panel of Fig. 2 shows the Gender Gap Index (GGm) and the municipality-level TFR. This index is a municipality-level version of the Global Gender Gap Index (GGG), described in more detail the Methods section, and is the measure used to estimate gender equality across municipalities. Greater levels of GGm indicate more gender-equal societies. It can be observed that the index increased over time and the correlation between GGm and TFR is small, being −0.007 in 1991, −0.73 in 2000 and +0.04 in 2010. So, this positive association in 2010 constitutes a probable reversal of patterns earlier in the fertility transition when gender equality was in all likelihood not associated, or negatively associated, with fertility. The panels in the bottom of Fig. 2 show the ratio of working females aged 18–54 (bottom left) and the ratio of working mothers with the youngest child aged 1–5 years (bottom right). Both variables show a negative correlation with fertility in 1991, 2000 and 2010, and present considerable variation across municipalities.
Fertility, gender and the employment of mothers
The fertility decline in Brazil was very swift, as the country transitioned from high fertility levels in the 1960s to below replacement levels in the 2000s. Official estimates show a TFR of 6.28 children per woman in 1960, 5.76 in 1970, 4.35 in 1980, 2.89 in 1991, 2.38 in 2000 and 1.90 in 2010 (IBGE, 2010, p. 73). The official estimates calculated the TFR using the P/F Brass method (IBGE, 2000), which is likely to have overestimated the TFR in 2010 because of a substantial fertility decline in the 15–24 age groups in the 2000s (Castanheira & Kohler, Reference Castanheira and Kohler2015; Carvalho et al., Reference Carvalho, Gonçalves and Silva2016). Other studies have shown a TFR ranging from 1.76 to 1.78 for the 2010 Census period (Lima, Reference Lima2013; Castanheira & Kohler; Reference Castanheira and Kohler2015; Carvalho et al., Reference Carvalho, Gonçalves and Silva2016). This paper focused on the last 30 years of the decline, showing the variables that were associated with the probability of having a child during the 12 months preceding to the census survey.
The main factors associated with the fertility decline in Brazil are presented above. A missing piece in this discussion was the role of gender and the employment of mothers with young children, which are presented in this section. Essential to this analysis is the concept of a ‘gender system’, which Mason (Reference Mason2001, p. 161) defined as ‘a set of beliefs and norms, common practices, and associated sanctions through which the meaning of being male and female and the rights and obligations of males and females of different ages and social statuses are defined’. Gender systems usually comprehend both the stratification of gender and the division of labour in societies. The equity in the gender system defines the level of gender equity in a society. The use of the ‘gender system’ concept, however, was challenged by McDonald (Reference McDonald2000), because a society can have different levels of equity in different institutions. In fact, the author affirmed that the reason for sustained low levels of fertility in some developed countries is the difference in gender equity in individual-oriented institutions (high gender equity) and family-oriented institutions (low gender equity). So, the division of labour in family-oriented institutions is considered an essential factor to explain sustained low fertility levels in countries.
Gender equity in McDonald (Reference McDonald2000)’s theory is also directly related to the decision of having a child. In his theory, the decision on having, or not having, a child is based on females’ expectations about the future according to values and norms of the role of women in society and their own aspirations. The author situates gender values and norms in the core of the decision process when having a child. With an increase in gender equity in family-oriented institutions, when fertility declines there is also a significant change in women’s lives due to a reduction in time spent childbearing and childrearing. This change generates an increase in the demand for gender equity in individual-oriented institutions. So, in summary, the theory explains that there is a change in woman’s expectations about their future and, as fertility declines, there is an increase in the demand for change in society, then actual changes may occur in individual-oriented institutions.
In developing countries, the fertility decline started in the context of more advanced contraceptive technology, and McDonald (Reference McDonald2000) suggested that it might have empowered women more quickly to demand and acquire equity rights in individual-oriented institutions than in developed countries. Therefore, the increase in gender equity in individual-oriented institutions may have started at lower levels of equity in family-oriented institutions than was the case in developed countries. In Brazil, the gains in women’s rights were very swift, with, for instance, a married woman in 1960 being subject to a very patriarchal civil code from 1916, having an improvement in their working and property rights in 1962 (Law No. 4121), and acquiring gender equality as a fundamental right with the Federal Constitution of 1988. So, in only 30 years, married women in Brazil went from needing their husband’s consent for almost everything to having equality of rights and obligations in 1988 (Alves & Corrêa, 2009). Moreover, in 1977 the Divorce Law (Law No. 6515) was passed in Brazil and divorce could be requested by either males or females. In 1985 the National Council for Woman’s Rights was established within the Ministry of Justice, which was key to guaranteeing equality of rights in the 1988 Federal Constitution. By establishing this council, Alves and Corrêa (2009) highlighted that Brazil was the first South American country, and one of the first developing countries, to establish a federal mechanism for promoting gender equality in civil rights.
Although Brazil established equality of rights and obligations between males and females in the 1988 Federal Constitution, at the local level communities can present varying degrees of equity in its gender systems, with large variation in patriarchal norms and values at the local level, especially regarding gender roles. Marri and Wajnman (Reference Marri and Wajnman2007), for instance, showed that women are disproportionately more responsible for hours of housework in Brazil, even when having greater salaries than their husbands.
This study used a gender equality index with the objective of capturing the variation in gender systems across municipalities, focusing on the equality of outcomes of females compared with males. The goal was to observe whether the varying levels of gender equality at the local level were associated with the probability of having a child during the 12 months preceding the census surveys in 1991, 2000 and 2010, controlling for individual and municipality characteristics. Although it is known that greater gender equity does not necessarily mean greater gender equality (Mason, Reference Mason1997; McDonald, Reference McDonald2013), it was assumed that, when comparing municipalities, those with greater levels of gender equality as measured by the index would be more likely to have greater levels of gender equity compared with the other municipalities.
Methods
Data
The Brazilian Demographic Censuses of 1991, 2000 and 2010 were used in the analysis. These have impressive samples in terms of size and regional coverage. The long form questionnaire of the census, which contains the fertility question, was applied to approximately 11% of Brazilians’ households with around 17 million individuals in 1991 and 20 million in 2000 and 2010. These samples statistically represent 4491 Brazilian municipalities in 1991, 5507 in 2000 and 5565 in 2010. The analytical sample used in this paper was restricted to women of reproductive age (16–49 years) at the survey’s reference date, and who were not living in collective dwellings (i.e. asylums, orphanages, hotels, pensions or penitentiaries).
In an attempt to capture only intended fertility, the sample was restricted to married or cohabiting women, since the last PNDS (National Survey of Demography and Health of Women and Children, Brazil’s most recent DHS equivalent) showed that 93% of intended pregnancies in Brazil happened among married or cohabiting women (PNDS, 2006). The final analytical sample included 2,535,219 married or cohabiting women aged 16–49 years in 1991, 3,107,852 in 2000 and 3,207,816 in 2010. The intention to capture intended fertility was driven by the objective of analysing the social determinants of fertility, and so it was assumed that most of the couples were consciously choosing to have a birth. In this regard, it is important to note that in the period of analysis, the unmet need for family planning was relatively low in Brazil, being 10.8% in 1996 and 6% in 2006 for women of reproductive age married or in a consensual union (United Nations, 2016). A 6% unmet need for contraception is close to levels in the United States for instance, which has had an unmet need for contraception of around 6% since 1990 (United Nations, 2016). Consequently, it was considered that couples have reasonable control over fertility and so it was possible to discuss the social determinants of fertility in the Brazilian context.
Methodological approach
Multilevel logistic regressions were used, with individuals (Level 1) nested in municipalities (Level 2). Municipalities were used as a unit of analysis for capturing the social context at the local level, since it is the smallest level of socio-political aggregation available in the Demographic Censuses of 1991, 2000 and 2010. The variables at the individual level were education attainment, household income per capita (natural log), race, age, age squared (to allow for non-linearities between fertility and age) and indicator variables for individuals living in rural areas and in the north and north-east regions of Brazil to control for regional inequalities that may affect fertility and that were not specified in the regressions. In order to make the logarithmic transformation, women in households with zero income per capita were assigned an income per capita value of 0.01. There were a total of 1.1% women with zero household income per capita in 1991, 4.97% in 2000 and 3.5% in 2010.
Level 2 variables were the Gender Gap Index (GGm), the Human Development Index (HDIm), the employment ratio of mothers with the youngest child aged 1–5 years and the ratio of employed females aged 18–54 years (all measured at the municipality level). This model was preferred over a one-level model with average variables at the municipality level because it accounted for differences in the composition of the population in municipalities. Moreover, individuals are the ultimate decision-makers in the fertility process and, consequently, their socioeconomic characteristics are important in this process (see Smith, Reference Smith1989, and Philipov et al., Reference Philipov, Thévenon, Klobas, Bernardi and Liefbroer2009, for further discussion).
The dependent variable was ‘1’ if the person had a live birth during the 12 months preceding the survey, and ‘0’ otherwise. In the models that controlled for birth order, only women at risk of having a birth in the correspondent birth order were considered. Thus, for example, for first order births in the 2010 Census, the dependent variable was ‘1’ for women who had their first birth between August 1st 2009 and July 31st 2010, and ‘0’ for childless women in the same period. In the models that considered higher order births, the dependent variable was ‘1’ for women who had their second or higher order birth between August 1st 2009 and July 31st 2010, and ‘0’ for women with at least one live birth and who did not have a birth in the reference period. Fertility in the 12 months preceding the census was used instead of the total number of live births ever had because the focus was on the social determinants of current fertility behaviours rather than past fertility behaviours. Life-time fertility is the result of social conditions that might differ significantly from the observed conditions in the census period, and these differences are even more prominent in Brazil because of its swift social and economic changes over the last 40 years.
The models were executed in Stata with the ‘xtlogit’ command allowing for random intercept. Thus, the fertility response of the i th women in the k th municipality was:
 $${\rm ln}\left( {\rm Y} \right)_{{ik}} {\,\equals\,}\beta _{0} {\plus}\beta _{1} X_{{i,k}} {\plus}\beta _{2} Z_{{k}} {\plus}\alpha _{k} {\plus}{\varepsilon}_{{ik}} $$
with Level 1 variables represented by X i,k and Level 2 variables by Z k . The random intercept at the municipality level (α k ) reflects municipality characteristics not considered in the model, thus accounting for intra-municipality correlation. The random error (ε ik ) reflects individual characteristics not specified in the model. The likelihood-ratio test of rho [ρ=(var(α k ))/(var(ε ik )+var(α k ))] indicates whether a two-level model with random intercept is applicable. In all models, the test was statistically significant and the two-level model was justified over a one-level model.
The Gender Equality Index
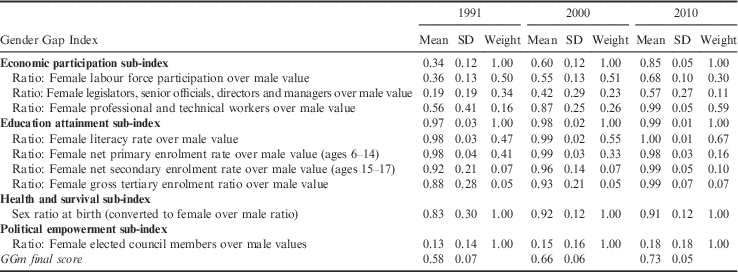
The Gender Equality Index has the objective of measuring the variation in gender equality across municipalities. Mills (Reference Mills2010) analysed six internationally recognized gender equality indexes and the Global Gender Gap Index (Hausmann et al., Reference Hausmann, Tyson and Zahidi2010) fitted the purpose of this study best. This index estimates the social outcomes of females in a society relative to males in a way that is relatively independent of human development levels. In addition, it is the most multi-dimensional of the indexes, having four dimensions: economic participation, education attainment, health and survival and political empowerment. While the original GGG is calculated at the country level, here a municipality-level gender equality index was estimated (denoted the Gender Gap Index for Brazilian municipalities, GGm), which is a version of the GGG adapted to Brazilian municipalities. Table 1 shows the variables used to estimate the GGm in each dimension. The GGm score went from an average of 0.58 in 1991 to 0.73 in 2010, ranging from a minimum of 0.34 in 1991 to a maximum of 0.98 in 2010. The original GGG index ranged from 0.46 in Yemen to 0.85 in Iceland, and Brazil’s final score was 0.67 in 2010 (Hausmann et al., Reference Hausmann, Tyson and Zahidi2010).
Variables and sub-indexes of the Gender Gap Index (GGm) for Brazilian municipalities in 1991, 2000 and 2010

The original Global Gender Gap Index (Hausmann et al., Reference Hausmann, Tyson and Zahidi2010) was calculated at the country level based on national data. This study’s analyses required estimation based on regional levels and, therefore, it was not possible to consider all the indicators of the original index. The original GGG economic participation sub-index had two additional variables: wage equality between women and men for similar work and ratio of female estimated earned income over male value. The original GGG education attainment sub-index had the same variables as the GGm. The original GGG health and survival sub-index included the ratio of female healthy life expectancy over the male value. Finally, the original political empowerment sub-index included the additional variables: ratio of females with seats in parliament over the male value, ratio of females at ministerial level over the male value and the ratio of the years a female was a head of state, in the last 50 years, over the male value. The variable measuring the number of elected council members in the municipalities depends on the election cycle and, therefore, does not always coincide with the demographic census’s years. For the 2010 GGm political empowerment sub-index the 2012 council members’ election was used. In 2000, the census coincided with the election year. In 1991, the elections of 1996 were used because of data availability. Likewise, because of data availability, in the 1991 GGm Health and Survival sub-index the sex ratio from births from 1995 were used. The remaining variables correspond to the census years.
Data sources: Brazilian Demographic Census 2010 (IBGE, 2010), National Civil Registry, Superior Electoral Court and PNUD (2013).
The GGm index was estimated as in Hausmann et al. (Reference Hausmann, Tyson and Zahidi2010), with the ratios truncated at one, with the exception of the sex ratio, which was truncated at 0.94, and the weight of each variable was calculated based on its variability across municipalities. To calculate the weight of each variable in each sub-index, 0.01 was divided by the standard deviation obtaining the magnitude of a 1% change in the deviation. The weight of each variable was this factor divided by the sum of all factors in each sub-index. Table 1 presents the standard deviations and weights of each variable used in the sub-indexes. It can be observed that the variables with the lowest standard deviation have the largest weights, because the objective of the weighting was to penalize municipalities that have a large gender gap in areas where most municipalities have achieved universality. For example, in Table 1 it can be observed that in the education attainment sub-index the variable with the greatest weight is the ratio between female literacy over male literacy, so municipalities where females have lower literacy levels than males will have a lower value of the education attainment sub-index, with a weight of 0.47, than is the case with the female gross enrolment ratio, which has a weight of 0.05 in the final value of the sub-index.
In the economic participation dimension, the index has the following variables: female labour force participation rate (ages 18–54) over male value; female legislators, senior officials, directors and managers over male value (ages 18–54); and female professional and technical workers over male value (ages 18–54). The education attainment dimension has the following variables: female literacy rate over male value; female net primary enrolment rate over male value (ages 6–14); female net secondary enrolment rate over male value (ages 15–17); and female gross tertiary enrolment rate over male value. In the health and survival dimension the sex ratio at birth converted to female over male was the only variable used because other health measures by sex were difficult to obtain at the municipality level. The life expectancy at birth by sex, for instance, was not calculated by the Brazilian National Statistics Office, and it was a very complex task to achieve in this study given the variation in the coverage of death registries across municipalities. Finally, the political empowerment sub-index has the number of females that were elected council members in the municipality over male value. The variables in the GGm economic and education sub-indexes were calculated from the Demographic Census Survey, the health and survival sub-index was calculated from the National Civil Registry database (downloaded from the IBGE website: http://www.sidra.ibge.gov.br/ table 2609) and the political empowerment sub-index was obtained from the Brazilian Electoral Court database. The data on elected council members (deputados estaduais) were downloaded from the data repository of the Brazilian Electoral Court website (http://www.tse.jus.br/eleicoes/estatisticas/repositorio-de-dados-eleitorais).
The Human Development Index for Brazilian municipalities (HDIm)
The association between socioeconomic development and fertility has long been recognized in the literature. Although there is a theoretical debate about its relative importance in relation to the diffusion of new ideas, its relevance is well established (Bryant, Reference Bryant2007; Myrskylä et al., Reference Myrskylä, Kohler and Billari2009). The literature shows that socioeconomic development, measured here by the Human Development Index of Brazilian’s municipalities (HDIm), is negatively associated with fertility (Potter et al., Reference Potter, Schmertmann and Cavenaghi2002; Bryant, Reference Bryant2007), especially in countries with an HDI below 0.9 (Myrskylä et al., Reference Myrskylä, Kohler and Billari2009). In Brazil, in particular, socioeconomic development was crucial for the onset and spread of the fertility decline (Potter et al., Reference Potter, Schmertmann and Cavenaghi2002). Thus, a negative association of the Human Development Index with the likelihood of having a birth in the 12 months preceding the census was expected. The HDIm was used as a proxy for human development across municipalities. This index is publicly available on the website of the United Nations Development Programme for Brazil (http://www.pnud.org.br/IDH/).
The HDIm is an index with three dimensions – longevity, income and education – and is not differentiated by sex. Longevity was measured using the life expectancy at birth, and income with the municipalities’ per capita income. The education sub-index was constituted by the education attainment of the adult population and the school flow of the youth population. The first was measured using the percentage of individuals aged 18 and over with primary education. The school flow was measured using the percentage of children aged 5 and 6 years going to school, percentage of individuals aged 11–13 years in the final years of elementary school, percentage of individuals aged 15–17 years that completed elementary school and percentage of individuals aged 18–20 years that completed high school. The greater the HDIm, the greater the human development in a given municipality.
The employment of mothers with young children
The employment of mothers with young children in the municipality indicates the average practice or behaviour of these mothers. It is assumed that municipalities that have a greater percentage of mothers with young children working, in relation to the total, have on average better work–childrearing support at the family level, at work or in the public or private sectors than in other municipalities. However, the type of work–childrearing support and its quality were not measured, the objective being to estimate the differences across municipalities in the overall level of work reconciliation across municipalities. The numerator of the ratio was the number of working mothers with the youngest child aged 1–5 years in the municipality and the denominator was the total number of mothers with the youngest child aged 1–5 years in the municipality. Based on previous results (Brodmann et al., Reference Brodmann, Esping-Andersen and Güell2007; Harknett et al., Reference Harknett, Billari and Medalia2014; Bauernschuster et al., Reference Bauernschuster, Hener and Rainer2014), it was expected that the greater the work–childrearing support, the greater the probability of having higher order births.
Because of the wide variation in female employment across Brazilian’s municipalities, the share of employed mothers with the youngest child aged 1–5 years could reflect the overall labour market conditions in the municipality, and not necessarily better work–childrearing support environments. For instance, a municipality with low levels of working mothers with the youngest child aged 1–5 years could reflect the low overall demand for female labour in the municipality, rather than the unmet need for work–childrearing support. Consequently, the overall ratio of employed females in the municipality was included in the analysis, with the numerator being the number of working females aged 18–54 years and the denominator the total females aged 18–54 years. Because these two variables are highly correlated, two models were estimated. In Model 1 the GGm and HDIm were the only second-level variables, and in Model 2 the two work-related variables were included. In both variables, employment was defined as working in the week of reference of the census.
Results
Descriptive statistics
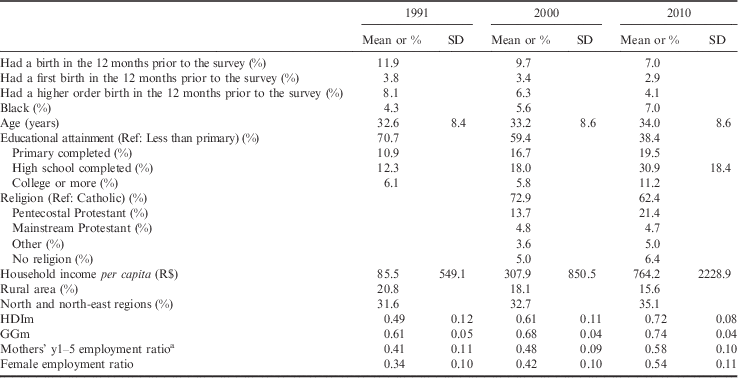
Table 2 shows the weighted descriptive statistics of the study sample for the 1991, 2000 and 2010 censuses. In 1991, 11.9% of married or cohabiting women aged 16–49 years experienced a birth in the 12 months preceding the survey’s reference date, and this percentage decreased to 9.7% in 2000 and 7.0% in 2010. The decrease was observed in first births and higher order births, but was more significant for higher order births, for which it more than halved in two decades, going from 8.1% in 1991 to 4.1% in 2010, while first births decreased from 3.8% in 1991 to 2.9% in 2010. The average age of the population of married and cohabiting women increased by 1.4 years, going from 32.6 in 1991 to 34 years in 2010. There was a significant change in education attainment in these three decades, with the percentage of women with high school and college degree more than doubling. There were also significant improvements in the municipality-level variables used in this analysis, with the average level of female employment in municipalities, for instance, increasing from 0.34 to 0.54.
Descriptive statistics of married or cohabiting women aged 16–49 years in the 1991, 2000 and 2010 Brazilian demographic censuses

There was a total of 2,535,219 married or cohabiting women aged 16–49 years in the sample of the 1991 Brazilian Demographic Census, 3,107,852 in the 2000 census and 3,207,816 in the 2010 census.
The means and standard deviations of income per capita for the 1991 census were converted from Cruzeiros (Cr$) to Reais (R$). Despite being in Reais (R$), the incomes have not been deflated and should not be directly compared.
a Mothers with children aged 1–5 years.
Table 2 shows also that the mean monthly income per capita for married and cohabiting women aged 16–49 years was R$ 636.00 in 2010 (approximately US$356.00), compared with R$764.20 for all women in this age group. When considering all individuals in the population, official estimates of the 2010 census show a monthly per capita income of R$767.02 (IBGE: http://www.sidra.ibge.gov.br/, table 3578), which is approximately US$430.00 a month and US$5160 a year, differing significantly from Brazil’s US$11,978.3 GDP per capita in 2010 (http://data.worldbank.org/indicator/NY.GDP.PCAP.CD).
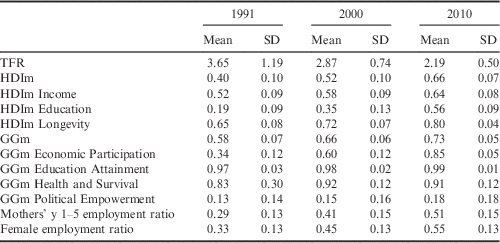
Table 3 shows the mean and standard deviation of the municipality-level variables, the sub-indexes of the Human Development Index (HDIm) and Gender Gap Index (GGm), and the TFR of municipalities provided in the UNDP’s database (http://www.pnud.org.br/IDH/). Overall, a considerable change in the variables over time was observed. In 1991, Brazilians’ municipalities had an average of 3.65 children per woman, following by 2.87 in 2000 and 2.19 in 2010. The TFR’s cross-country variation decreased considerable in 20 years, going from a standard deviation of 1.2 children per woman in 1991 to 0.5 children per woman in 2010. The coefficient of variation of the TFR also decreased, presenting a dispersion of 0.33 in 1991, 0.26 in 2000 and 0.23 in 2010.
Means and standard deviation of the municipality-level variables and their sub-indexes for Brazilian municipalities in 1991, 2000 and 2010

The Human Development Index of Brazilian municipalities (HDIm) had a 65% increase in its average in the 20-year period, with a significant contribution of the three sub-indexes (income, education and longevity). The education sub-index (‘HDIm Education’ in Table 3) had the largest increase, going from 0.19 in 1991 to 0.56 in 2010, indicating not only greater schooling levels of the adult population, but also greater education attainment of the youth population. The Gender Gap Index of Brazilian municipalities (GGm) also increased, with its average improving 26 percentage points in 20 years. The dimension with the greater improvement was Economic Participation (‘GGm Economic Participation’ in Table 3), more than doubling its average in 20 years, indicating an increase in the ratio of females in the labour force and in the number of female managers, officials, professionals and technical workers. The female employment ratio and the ratio of employed mothers with the youngest child aged 1–5 years increased approximately 10 percentage points per decade.
Multilevel logistic regression analysis
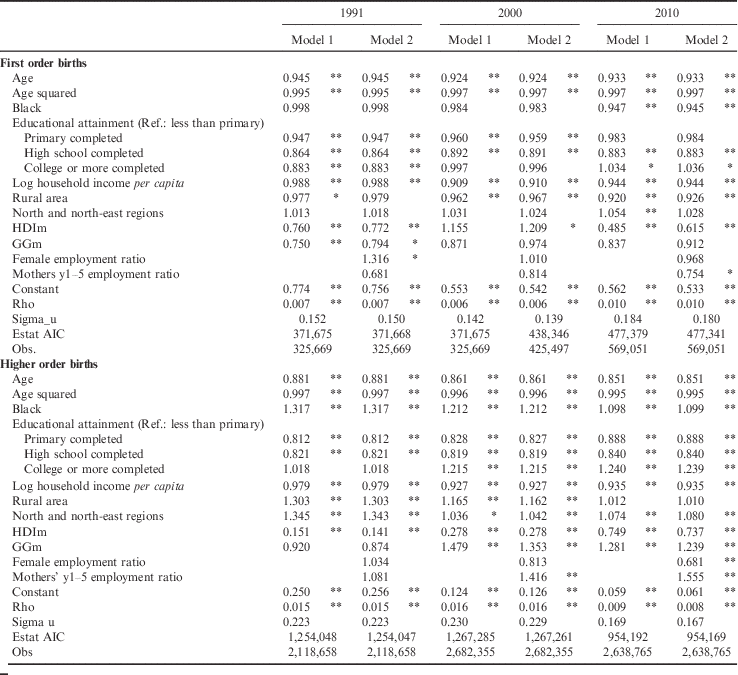
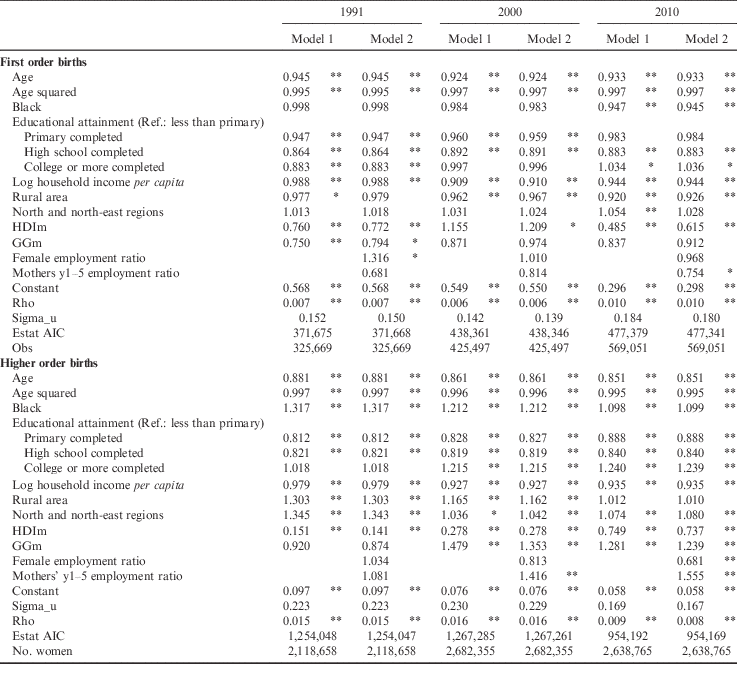
Table 4 shows odds ratios of the multilevel logistic regressions for first births and higher order births of married or cohabiting women in Brazil in 1991, 2000 and 2010. The models estimate the likelihood of having a birth in Brazil during the 12 months preceding the census survey. Absolute values were used for the municipality-level variables. A sensitivity analysis was performed testing whether using deviations from the mean would provide the same results. Table 5 shows the results using the municipality-level variables as deviation from the mean. It can be observed that the levels and statistical significance of the variables did not change. The only change, as expected, was in the coefficients of the constant of the regressions. In this regard, the results analysed below were based on the estimates in Table 4.
Multilevel logistic models (odds ratios) with random intercept at the municipality level estimating the probability of married or cohabiting women aged 16–49 years having a first order birth and a higher order birth in Brazil in 1991, 2000 and 2010

Sensitivity analysis: re-estimation of the models in Table 4 using the deviation from the mean instead of absolute numbers for municipality-level variables (odds ratios)

Model 1 includes the individual-level variables, the Human Development Index (HDIm) and the Gender Gap Index (GGm). Model 2 adds the female employment ratio, and the employment ratio of mothers with the youngest child aged 1–5 years. The results were consistent between Models 1 and 2, with the variables usually presenting the same levels of statistical significance. The likelihood-ratio test of rho, which indicates whether a two-level model with random intercept is applicable, was statistically significant in all models and a two-level model was justified over a one-level model. The statistics of fit, measured by the Akaike Information Criterion (AIC), in which the lower the value, the better the model, varied by year and birth order. For first-order births, Model 2, with the work ratio variables, was preferred in 1991 and 2010, and Model 1 was preferred in 2000. For higher order births, Model 2 was preferred in all years.
In relation to individual-level variables, age and age squared were both statistically significant in all years, as expected. For first order births age decreased from 1991 to 2000 and then increased again in 2010, and for higher order births age decreased, consistent with the changes in the age-specific fertility rates in Brazil in these three periods. The variable indicating whether the person declared being black or not showed that for first order births there was no difference regarding racial identity; in 2010 the association was negative showing a lower likelihood of first births for people that considered themselves black, controlling for other characteristics. For higher order births the association was positive, but the odds ratios reduced with time.
The likelihood of having a birth by education attainment also varied across years and birth orders, as shown in Table 4; the most striking result was the change in the coefficients for higher order births of females with college degrees. In 1991, there was no difference in the likelihood of having a birth given that you already had a child between women with less than primary education and women with college degree, controlling for the other variables; and in 2000 and 2010, this likelihood became positive and statistically significant. These changes are striking and might be related to a reduction of the negative impact of education on higher order births net of the late motherhood effect demonstrated by Kravdal and Rindfuss (Reference Kravdal and Rindfuss2008) for completed fertility in Norway. It is important to emphasize that this evidence is comparing women with at least one child, who were married or cohabiting, and for births in the 12 months preceding the census’s reference date. At the population level, the negative TFR–education relationship prevails (see for instance Berquó & Cavenaghi, Reference Berquó and Cavenaghi2014). Another striking result about the likelihood of having a higher order birth in rural areas compared with urban areas was that the coefficient decreased from 1991 to 2000 and was not statistically significant in 2010 at p<0.05.
Regarding the municipality-level variables, HDIm was the only municipality-level variable that was statistically significant at the p<0.01 level for first order births in this analysis. It was negative and statistically significant in 1991 and 2010, but it was not statistically significant in 2000 in the AIC-preferred Model 1. So, married or cohabiting women in municipalities with advanced human development had lower first-birth probabilities in 1991 and 2010 than similar women in worse-off municipalities. The size of the coefficient was very similar in 1991 and 2010. The reasons for a different result in 2000 remain open. It can be hypothesized that a monetary crisis in 1999, with a large devaluation of the Brazilian currency, may have produced a postponement effect of first births in all individuals, independent of the Human Development Index of their municipalities. Previous research has shown that an increase in uncertainty during economic crisis can reduce fertility 9 months later (Sobotka et al., Reference Sobotka, Skirbekk and Philipov2011).
By estimating the predicted probabilities at certain HDIm levels it can be observed that an increase in one standard deviation in HDIm presented a 2.4% lower first-birth probability in 2010 (Model 2). In relation to higher order births, the HDIm odds ratios were statistically significant at the p<0.01 level, and became closer to one in more recent years, going from 0.14 in 1991 to 0.74 in 2010. These results are expected, as previous research has shown that the negative relationship between fertility and HDI declines and potentially even reverses as societies increase their development levels (Myrskylä et al., Reference Myrskylä, Kohler and Billari2009). The above analyses for 1990–2010 document this changing relationship for the first time for within-country fertility variation in a middle-income developing country.
In relation to gender equality, Table 4 shows that GGm had a negative and statistically significant coefficient in 1991 for first order births, but for the other decades it was not statistically significant in this birth order. In the opposite direction, a statistically significant positive association was estimated between gender equality and fertility in Brazil in 2000 and 2010 for higher order births. The predicted probabilities of Model 2 in 2010 showed that an increase in one standard deviation in the GGm increased the probability of higher order births by 1.2%. Similarly to the GGm index, the employment ratio of mothers with the youngest child aged 1–5 years – the proxy measuring work–childrearing support environment – also has a significant positive association with higher order births in 2000 and 2010, but no association in 1991. The ratio of employed women aged 18–54 years was not statistically significant in 1991 and 2000, and it was negative and statistically significant in 2010. Therefore the results agree with previous research, which has found a positive association of gender with the probability of higher order births, but no association with first order births. So, the greater the levels of gender equality and the levels of employed mothers with young children in the municipality, the greater the probability of having higher order births.
The differences found in each of the three periods (1991, 2000, 2010) were expected, but this expectation was derived almost exclusively from previous research in high-income countries that had experienced low fertility for a substantial period of time. The estimates document the changes in the relationship between fertility, gender equality and development for the first time in a developing country as it transitions into below replacement fertility. To shed light on the mechanisms that might underlie this change in the relationships between fertility, gender equality and development during 1990–2010 in Brazil, it is useful to emphasize some aspects of the descriptive statistics shown in Table 3. It can be observed that the two most important changes in 1991, 2000 and 2010 were in the HDIm Education sub-index and the GGm Economic Participation sub-index. These indexes more than doubled in two decades, representing a considerable increase in the general education attainment of the population and in the average share of professionals, legislators, senior officials, directors and managers among women in municipalities. Based on this evidence, it is hypothesized that, across the decades, the increase in education and in women’s rank in the labour market compared with men has increased the importance of the work–childrearing support environment and gender equality in the decision to have an extra child. Consequently, these are possibly some of the reasons for the different coefficients of gender equality and work–childrearing support environment in Brazil in 1991 and 2000–2010.
Discussion
An increasing number of developing countries are experiencing below replacement fertility levels. This study explored Brazil’s regional variation in the likelihood of having a birth, estimated using a multilevel logit model with gender equality, human development, the ability of mothers with young children to work and female labour force participation at the municipality level, and socioeconomic characteristics at the individual level, as predictor variables. The Demographic Census surveys of 1991, 2000 and 2010 were used, which provided an exceptional opportunity to investigate these variables due to their large sample sizes and comprehensive geographic coverage. Within-country variation in fertility was the focus as Brazil is a country with considerable variation at the municipality level in both fertility and institutional and socioeconomic contexts.
The key findings reinforce the importance of gender equality and supportive work–childrearing environments for fertility. In consonance with previous results for below replacement fertility countries (Brodmann et al., Reference Brodmann, Esping-Andersen and Güell2007; Harknett et al., Reference Harknett, Billari and Medalia2014; Bauernschuster et al., Reference Bauernschuster, Hener and Rainer2014, among others), these variables were shown to be mostly associated with the probably of having higher order births, and not first births. However, by comparing 2000 and 2010 with 1991, it was observed that in 1991 gender equality was negatively associated with the probability of having the first child. So, the positive association in 2000 and 2010 is likely to constitute a reversal of a relationship that in all likelihood prevailed earlier in the demographic transition when gender equality was not correlated, or was negatively correlated, with fertility. Since a substantial increase in the share of professional and managerial women was observed in the most recent period, it is hypothesized that gender equality and the ability of mothers with young children to work become more important to, and positively associated with, higher order births as women’s occupations in the labour market are improved.
In addition, by comparing 2010 with the previous years, it was observed that the relative importance of the Human Development Index (HDIm) for higher order births decreased with time. Specifically, the HDIm’s negative association with higher order fertility was modest in 2010, in sharp contrast to a strong negative association in 1991 and 2000. For first order births, the HDIm’s association with fertility was similar in 1991 and 2010, but presented no association in 2000. The reason why the HDIm was not statistically significant for first births in 2000 remains an open question.
In summary, this paper contributes to the literature on low fertility in developing countries. Because of the swift fertility decline in Brazil, the continuation of its fertility transition to post-transitional fertility levels could be observed by analysing the three most recent censuses. A decrease over time of the negative association of the Human Development Index with the probability of having a higher order birth was observed, while other variables increased in importance. It is the case for gender equality and the ability of mothers to work that started being significant in the 2000s, constituting a reversal of the relationship that most likely prevailed earlier in the demographic transition (Mason, Reference Mason2001). It has been shown that the positive associations are a recent phenomenon that has emerged as Brazil’s fertility transition continued and Brazil reached below replacement fertility.
By distinguishing first from higher order births, the study also highlighted the importance of considering birth order in the fertility analysis. The authors conclude that, when considering fertility in a middle-income developing country, it is important to contemplate the heterogeneity across its territory and to recognize that no single factor is responsible for its fertility levels, but a plethora of factors that might include first and second demographic transition elements in the same country.
In terms of lessons learned that might apply to other developing countries, it seems that advancement in human development, measured in this study by the Human Development Index, is very important for the continuation of the decline in fertility. The Gender Equality Index was also significant in the three periods analysed: if the index is a good approximate measure of differences of gender equity in gender systems across municipalities, it supports theories that shows that gender equity is associated with fertility in every stage of the transition, as suggested by Mason (Reference Mason2001) and McDonald (Reference McDonald2000). Further research is needed for a greater understanding of the mechanisms that relate fertility to gender equity and work–childrearing support environments to advance the understanding of fertility levels, its expected directions and variations within and across countries.
Acknowledgments
The authors confirm that they have no financial interests or connections, direct or indirect, or other situations that might raise the question of bias in the work reported or the conclusions, implications or opinions stated, including pertinent commercial or other sources of funding for the individual author(s) or for the associated department(s) or organization(s), personal relationships or direct academic competition. The views expressed in this paper are those of the authors and are not necessarily those of the United Nations.