Introduction
Singapore’s land-use history following the British colonisation in the early 1800s was dominated primarily by intensive agricultural development and extensive removal of original vegetation (Wee & Corlett Reference Wee and Corlett1987). Thereafter, major crops included gambier, coconut, pineapple, pepper and rubber (Davison Reference Davison2005). Following Singapore’s independence in 1965, rapid economic development and urbanisation led to a decline in agriculture, which in turn resulted in an increase of secondary forests on abandoned agricultural lands. The resulting vegetation cover consists of mainly fast-growing pioneer species, including a range of non-native trees (NParks 2014). Corlett (Reference Corlett, Chia, Rahman and Tay1991), who investigated secondary forest degradation, proposed four natural post-disturbance successional stages. These ranged from colonisation of abandoned agricultural lands with herbaceous and woody pioneer vegetation to older pioneer stands with close canopy structures and to taller and more diverse secondary forests with increasing proportions of late successional (primary forest) species.
According to Whitmore (Reference Whitmore1984), the original forests of western Malaysia (including Singapore) are mainly tropical lowland evergreen forest formations dominated by dipterocarp species of the genera Shorea, Dipterocarpus, Dryobalanops, Parashorea and Anisoptera. They are coupled with large numbers of non-dipterocarp species. Such forests are regarded as one of the most species-rich forest ecosystems in the tropics (Schulte & Schöne Reference Schulte, Schöne, Schulte and Schöne1996). Remnant secondary forests throughout the tropics are important for contributing to global tropical forest carbon (C) budgets (Ngo et al. Reference Ngo, Turner, Muller-Landau, Davies, Larjavaara, Nik Hassan and Lum2013). According to vegetation surveys based on satellite imagery and ground verification by Yee et al. (Reference Yee, Corlett, Liew and Tan2011) in 2006/2007, around 1.6 % of the total area of Singapore is covered with original forest types, including lowland dipterocarp forests, mangrove forests, freshwater marshes and freshwater swamp forests.
Changes in soil organic carbon (SOC) stocks are long-term processes and vary with type of land management and with different levels of disturbances to the soils and above-ground biomass (AGB). Loss of SOC has been observed in various land-use changes from natural forests to agriculture, whereby the conversion of natural forest ecosystems to agriculture may reduce SOC by 50 to 75 % (Lal Reference Lal2005). However, both rates and direction of change are highly variable due to complex dynamics of plant input, soil organic matter and soil minerals, which is intensified under tropical conditions (Sayer et al. Reference Sayer, Lopez-Sangil, Crawford, Bréchet, Birkett, Baxendale, Castro, Rodtassana, Garnett, Weiss and Schmidt2019). Guillaume et al. (Reference Guillaume, Damris and Kuzyakov2015) analysed SOC losses after lowland rainforest conversion to oil palm and rubber plantations in Indonesia as a result of erosion and decomposition. On average they found that converting forest to plantations led to a loss of 10 Mg C ha−1 after 15 years of conversion, whereas SOC content in the subsoil was similar under the forest and the plantations, underpinning the effect of topsoil erosion, which was highest in the plantations. In secondary tropical forests, SOC changes were observed to be related to soil types: in granite soils of young secondary forests SOC stocks rapidly increased and reached SOC levels comparable to mature forests, whereas SOC stocks of clay-rich soils remained stable at a high level (Paz et al. Reference Paz, Goosem, Bird, Preece, Goosem, Fensham and Laurance2016). A global meta-analysis consisting of 385 studies focused on land-use change in the tropics by Don et al. (Reference Don, Schumacher and Freibauer2011) indicated that primary forests are important for C storage. In this meta-analysis, the highest SOC losses were caused by the conversion of primary forests to perennial crops (−25 %), and secondary forests were found to have lower SOC stocks (−9 %) than primary forests. It is very likely that within the forested areas in Singapore, SOC stocks vary according to the intensity of land-use change and to forest management, although this was not investigated yet. Soil organic C is one focus in the ongoing climate change debate as sequestration of SOC is important in reducing atmospheric C levels and in restoring soil fertility with potential implications to food security. In this context, it is estimated that soils represent a potential sink of up to 40 Mg C ha−1 of SOC (Lal Reference Lal2004). Tropical forests play a key role in global C cycling because forest soils act as major C sinks with 36–60 % of ecosystem C stored in soils under forests Don et al. (Reference Don, Schumacher and Freibauer2011). Consequently, information on SOC stocks in relation to land-use changes and different types of forest management will be useful for an Intergovernmental Panel on Climate Change (IPCC) compatible C reporting framework for Singapore to help forming current and future climate-related policies and build resilient landscapes. Therefore, the objective of this study was to investigate whether existing SOC stocks in the forests of Singapore are related to successional stages of forest vegetation following disturbances. The hypothesis tested was that a close relationship between forest successional stages and SOC stocks exists. We described forest successional classes based on land-use history and past forest management in Singapore, building upon the results from earlier studies on forest succession. Hereinafter, these classes were analysed for differences in SOC stocks.
Methods
Study area, inventory plots and inventory data
Singapore is a city-state located at the southern tip of Peninsular Malaysia. It has a tropical climate characterised by two monsoon seasons, with relatively uniform temperature, abundant rainfall and high humidity. Singapore’s 1981–2010 long-term average daily temperature is 27.5°C and the long-term average annual rainfall is 2166 mm (Department of Statistics 2019). The geology of Singapore can broadly be separated into igneous rocks, sedimentary rocks and unlithified sediments. Central Singapore is dominated by a large plutonic intrusion called Bukit Timah Granite (Defence Science and Technology Agency 2009). To the south-west of the Bukit Timah Granite, the remainder of mainland Singapore and the Southern Islands are made up of by generally low-grade metamorphosed sediments of the Triassic age Jurong Formation (Lat et al. Reference Lat, Goay, Lau, Chiam and Chew2016). Older metamorphosed sedimentary rocks, the Palaeozoic Sajahat Formation, are also present in a few isolated locations, principally Pulau Sajahat and Pulau Tekong to the north-east of mainland Singapore. One-third of Singapore‘s land surface located mainly in the east consists of a significant thickness of Neogene to Quaternary period sediments – the Old Alluvium and Kallang Formation (Defence Science and Technology Agency 2009). Soils developed on igneous and sedimentary rocks are classified, respectively, as Ultisols and Oxisols according to Soil Taxonomy (Rahman Reference Rahman, Chia, Rahman and Tay1991, Ngo et al. Reference Ngo, Turner, Muller-Landau, Davies, Larjavaara, Nik Hassan and Lum2013). Soils derived from igneous rocks are characterised by deep weathering and by advanced soil formation (Rahman Reference Rahman, Chia, Rahman and Tay1991).
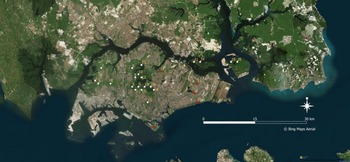
Inventory plots set up in forested areas for an IPCC-compatible greenhouse gas reporting system for the Land Use, Land-Use Change and Forestry (LULUCF) sector in Singapore were used in this study. From 26 plots selected, only 21 plots could be used for further analysis. Five plots (17, 19, 20, 22, and 23; Figure 1) were located at the fringes of the forests and thus very close to urban infrastructure and housing estates. These plots were excluded as they do not represent typical forest conditions in terms of stand structure and soil.
Location of the inventory plots; red coloured plots close to urban land-use were excluded. Source: Bing Maps Aerial, Open Layers plugin, accessed July 12, 2021.

Each plot (1600 m2) represents a particular forest stand with specific soil conditions within the range of successional stages depending on past disturbance regimes of AGB and soil. Information on AGB, species composition and tree size were derived from tree data collected on each inventory plot. The nested plot design consisted of a plot with a size of 40 m × 40 m (total area: 1600 m²) for recording and measuring all trees with a diameter at breast height (DBH) of 30.0 cm and above. The DBH was measured in centimeter using a diameter tape, and the girth measured was immediately converted into a diameter with an accuracy of one decimal place. Within each plot, four smaller sub-plots with a size of 10 m × 10 m (total area of 4 plots: 400 m²) were established for recording trees with a DBH from 5.0 to 29.9 cm. Tree species were recorded in addition to the DBH.
AGB is defined as oven-dry AGB of trees and was calculated using the pan-tropical biomass model developed by Chave et al. (Reference Chave, Réjou-Méchain, Búrquez, Chidumayo, Colgan, Delitti, Duque, Eid, Fearnside, Goodman, Henry, Martínez-Yrízar, Mugasha, Muller-Landau, Mencuccini, Nelson, Ngomanda, Nogueira, Ortiz-Malavassi, Pélissier, Ploton, Ryan, Saldarriaga and Vieilledent2014). This model uses DBH, wood density of individual tree species (i.e. wood specific gravity based on Zanne et al. (Reference Zanne, Lopez-Gonzalez, Coomes, Ilic, Jansen, Lewis, Miller, Swenson, Wiemann and Chave2009) and a regional factor E for seasonal stress (humidity and temperature), representing the different ecological conditions within tropical forests.
 $$\begin{align}{\rm AGB} = \exp (-1.803-0.976\,{\rm E}+0.976\ln({\rm WSG}) \nonumber \\ +2.673\ln({\rm DBH})-0.0299(\ln({\rm DBH}))2)\end{align}$$
AGB: above ground biomass [kg]; E: regional factor E for seasonal stress; WSG: wood specific gravity [g cm−3]; DBH: diameter at breast height [cm]
Forest classification
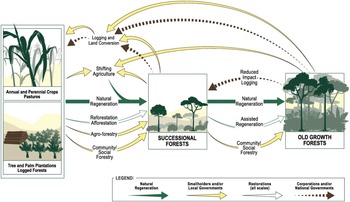
The inventory plots were stratified into four classes based on land-use history and on successional changes of the forest. Ecological knowledge on tree species and stands combined with information on past forest management allow to describe successional stages, which are the result of distinct different stand development pathways. The complex mix of natural and anthropogenic influences due to the past treatment of vegetation and soils as well as to natural recovery has been illustrated by Pain et al. (Reference Pain, Marquardt, Lindh and Hasselquist2021) in a general conceptual model for tropical landscapes (Figure 2). In accordance with this model, the forest classification system presented in this study uses current forest stand conditions observed in the inventory plots and land use history as indicators of forest succession.
Conceptual model illustrating the complex mix of anthropogenic disturbances and natural succession in tropical landscapes after Pain et al. (Reference Pain, Marquardt, Lindh and Hasselquist2021).

For describing the land-use history several vegetation and land-use reports and maps of Singapore since 1945 (The National Archives 1945, Wee & Corlett Reference Wee and Corlett1987) were analysed to collect information on the level of past disturbances which occurred at particular inventory plot locations, mainly caused by agricultural management practices such as clearing of forests, planting of non-native tree species and/or agriculture cultivation with extensive soil tillage operations.
The successional stage of each plot was identified by analysing stand structure, biomass density (AGB) and species composition allowing to assign the plot to one of four forest classes. This assignment was guided by extensive knowledge on forest succession in the tropics (Chazdon Reference Chazdon, Carson and Schnitzer2008), evolutionary changes in the floristic composition and stand structure in Asian dipterocarp forests (Maury-Lechon & Curtet Reference Maury-Lechon, Curtet, Appanah and Turnbull1998) and on ecological characteristics of individual tree species based on botanical, taxonomic and plant sociological and wood anatomical research documented over more than 100 years (Ewel Reference Ewel1980, Lemmens et al. Reference Lemmens, Soerianegara and Wong1995, Soerianegara and Lemmens Reference Soerianegara and Lemmens1994, Sosef et al. Reference Sosef, Hong and Prawirohatmodjo1998).
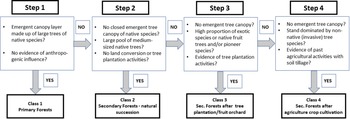
In addition, specific information, for example, on tree growth or seed dispersal (Parotta Reference Parotta1990), have been used to describe likely pathways of the past stand development. The evaluation process leading to four distinct different successional stages (i.e. primary forests; secondary forests representing natural succession; secondary forests after tree plantation/fruit orchard and secondary forests after agriculture crop cultivation) is illustrated in Figure 3.
Evaluation process of stand conditions found on individual inventory plots leading to four distinct different successional stages.

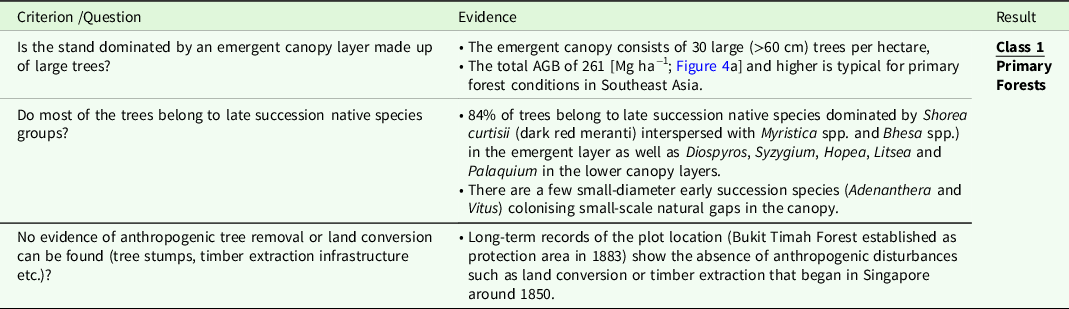
The plot evaluation was implemented in four steps taking, for example, AGB (Figure 4a) into account. Each evaluation started at step 1 and ran through all the steps addressing the specific issues listed in each step. If all questions within a particular step were answered with “YES” the evaluation stopped and the plot was allocated to the class of this step. An example illustrating the evaluation process is depicted in Table 1. Further examples can be found in the Supplementary Material (Tables S1-S4).
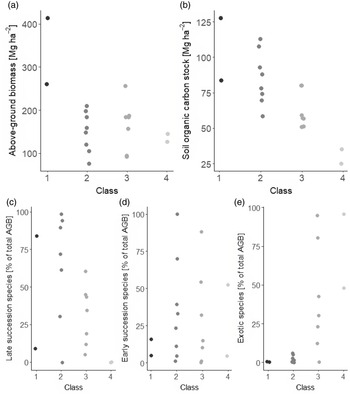
Strip charts showing (a) above-ground biomass (AGB), (b) soil organic carbon (SOC) stocks and species composition based on AGB divided into (c) late succession species, (d) early succession species and (e) exotic species for the four classes (1) primary forests, (2) secondary forests representing natural forests succession, (3) secondary forests after tree plantation/fruit orchard and (4) secondary forests after agriculture crop cultivation. For two plots [2 (Class 4) and 24 (Class 3)], no SOC data were available.

Example to illustrate the plot evaluation process for forest classification (Plot #5 – Evidence for primary forest conditions).

Soil organic carbon
The four forest classes described in Forest Classification section were further examined for their SOC stocks (Figure 4b) using soil samples taken on the inventory plots as described in Leitgeb et al. (Reference Leitgeb, Ghosh, Dobbs, Englisch and Michel2019). Samples were taken from the mineral soil in three soil depths (0–10, 10–20 and 20–50 cm) using an auger (7 cm diameter). All samples were air dried and sieved to 2 mm. A Scheibler Calcimeter, using the classic gas-volumetric technique, was used to measure CaCO3 content. Soil total C (Ct) was determined by dry combustion technique using a LECO C/N TruMAC Analyzer (LECO, Saint Joseph, MI). The SOC contents were calculated as the difference between Ct and CaCO3, if carbonates were present. This was the case for only one plot (plot 2). Therefore, for almost all plots, SOC content was equal to Ct content.
Bulk density was determined for each plot using intact soil cores. The soil cores were sampled using a soil core sampler and a liner (AMS Inc., American Falls, ID) with a volume of 102.96 cm3. Additionally, soil sample steel rings with a volume of 100 cm3 were used in some samples in order to correct the compaction caused by the soil core sampler. Three replicates per depth class and plot were obtained and pooled as a composite sample. The samples were dried at 105 °C to a constant weight. If coarse fragments (stones, roots) were present, their mass and volume were determined and taken into account when calculating soil bulk density. Soil C stocks were calculated by multiplying SOC content and bulk density for each soil depth class and aggregated for the soil depth from 0 to 50 cm.
Principal component analysis
A principal component analysis (PCA) was carried out with the functions prcomp and PCA (library FactoMineR, package factoextra) using R 3.6.3. (R Core Team 2020) in order to evaluate the results of forest successional classification. The correlation matrix was used as the input for PCA, which allows the user to include variables measured on different scales (James & McCulloch Reference James and McCulloch1990). In the process of the PCA, the axes are redefined so that components of multiple variables can be combined on one axis. PCA was applied on the standardised values of plant parameters (AGB, main height, maximum height, DBH, number of tree species) and SOC stocks for 0–50 cm depth. The four forest successional classes were used as grouping variable. Nineteen plots were included in the PCA. For two additional plots (2 and 24; Table 2), no data for SOC stocks for 0–50 cm depth were available.
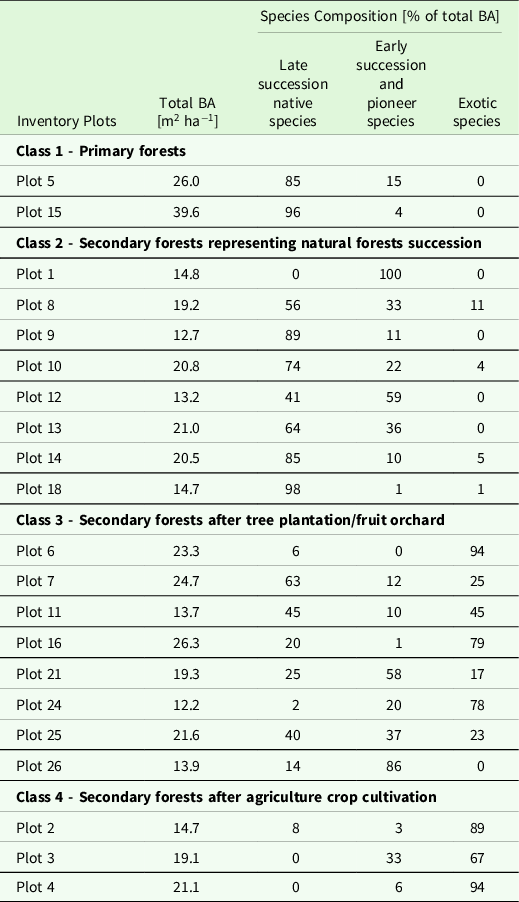
Basal area (BA) and species composition related to BA in the four forest classes based on land-use history and successional stages of the forest vegetation after disturbance.

Results
Classification and vegetation characterisation of the inventory plots
The four classes obtained (Figure 3) are described in the following section according to AGB, basal area (BA) and species composition. The latter is expressed in terms of the proportion of (a) late succession native species, (b) early succession and pioneer species and (c) exotic (non-native) species (Table 2, Figures 4c-e), indicating their successional stages.
Class 1: Primary forests
Two inventory plots are located in remnant primary forests of Singapore, one at Bukit Timah (around 150 ha) and one in a very small area within the Singapore Botanic Gardens. Species composition and structure are typical of primary lowland dipterocarp forests (Table 2, Figure 4a) in Southeast Asia. The forest stands are dominated by late succession native species (> 80 %) with AGB ranging from 261 to 414 Mg ha−1, which is typical of lowland primary forests. These forests have neither been subjected to timber extraction nor been negatively affected by excessive storm events (i.e. wind). Thus, these primary forests are largely intact, in terms of their structure and species composition, and also show the highest total AGB while plots of an earlier secondary successional stage have AGB levels below 200 Mg ha−1 (Figure 4a).
Class 2: Secondary forests representing natural forest succession
The forests in this class were subjected to heavy disturbance of AGB. All plots contain large native (remnant) trees of late succession stages (Figure 4c). This indicates that the forests were selectively logged for timber but were most likely not converted to non-perennial agriculture and exotic tree plantations. Large trees with DBH between 45.0 and 96.0 cm, such as Dyera sp., Palaquium sp., Shorea sp. and Litsea sp. with DBH growth rates between 0.5 and 0.8 cm per annum indicate minimal disturbances of the soils over the past 70 to 100 years. The proportion of early succession and pioneer native species in the inventory plots with a maximum of 100% for total AGB and BA (Table 2, Figure 4d) is a further characteristic of natural forest succession.
Class 3: Secondary forests after tree plantation/fruit orchard
These were forested areas that have been cleared to make way for tree plantations, such as rubber, coffee or fruit trees. Such stands show a completely different species composition compared to secondary forests following natural forest succession. For instance, the proportion of exotic tree species shows a maximum of 95 % of total AGB and 94 % of BA, respectively. This is distinctly higher compared to that of Class 2 [6 % (AGB) and 11 % (BA); respectively; Table 2, Figure 4e]. In the past, these areas were either managed as fruit orchards or tree plantations. The former fruit orchards tended to be composed of remnant fruit trees (mainly Durio zibethinus, Artocarpus ssp. and/or Dimocarpus longan) and are currently being inhabited by local Ficus and exotic Dracaena species. The former tree plantation sites investigated are stocked with Hevea brasiliensis and Acacia sp., partly recolonised by local, slow-growing pioneer species such as Adinandra sp., Cyrtophyllum fragrans and Vitex pinnata.
Class 4: Secondary forests after agriculture crop cultivation
There are two main zones in Singapore with sedimentary rocks, which at present are covered by forests and that were used for intensive agriculture in the past. These areas include (a) sites on Jurong Formation and (b) sites on Sajahat Formation on Tekong Island. These plots represented forest stands located in distinctively flat terrain and likely subjected to intensive agriculture in the early days of settlements, succeeding non-perennial crops of mainly non-native species. Currently, these spontaneous forests, which – to a varying degree – have turned into wilderness and found on abandoned lands, are composed of non-native trees such as Spathodea campanulata, Acacia auriculiformis, Hevea brasiliensis and native long-lived pioneer species including Adinandra dumosa and Syzygium lineatum, among others. The total AGB of the inventory plots of Class 4 varied distinctly from 87 to 137 Mg ha−1 (Figure 4a). It is noteworthy that all plots in Class 4 have a high proportion of exotic tree species as mentioned above and 88 and 96 % of total AGB were formerly planted, but in one plot (Plot 2) pioneer species such as Adinandra sp. and Dillenia sp. recolonised parts of the plot, indicating natural succession.
Relations between forest classification and soil organic carbon stocks
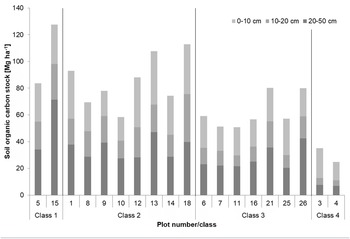
Maximum SOC stocks in 0–50 cm soil depth declined in the order of Class 1 (127.7 Mg ha−1) > Class 2 (112.8 Mg ha−1) > Class 3 (80.1 Mg ha−1) > Class 4 (35.2 Mg ha−1; Figure 4b). If the SOC stocks are divided according to sampling depth, the same pattern is in particular visible in 20–50 cm depth with clearly lower SOC stocks in Class 4 compared to the other three classes (Figure 5). Although a clear trend was observed supporting the above classification, these data must be considered with caution, given that SOC data for Classes 1 and 4 were derived from only two plots per class.
Soil organic carbon stocks in the 19 plots investigated differentiated by sampling depth and in relation to the different forest classes (Class 1: primary forests, Class 2: secondary forests representing natural forest succession, Class 3: secondary forests after tree plantation/fruit orchard, Class 4: secondary forests after agricultural crop cultivation). For two plots [2 (Class 4) and 24 (Class 3)], no SOC data were available.

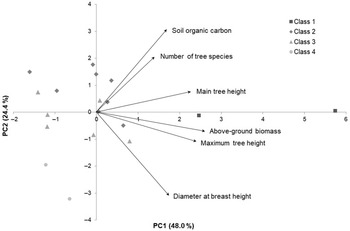
The first two principal components (PC) explained 48.0 and 23.4 % of the variation of the data from the 19 plots included in this PCA (Table 3). Although the data set available was rather small, the four forest classes described above were largely separated by PCA (Figure 6).
Eigenvalues, variance and cumulative variance explained for the first three principal components.

Principal component analysis (PCA) biplot (PC1 vs. PC2) illustrating relations among tree parameters and soil organic carbon (SOC) stocks, which are indicated along arrows. Ordinations of the 19 plots are illustrated as circles. The four classes are represented by different gray shades. (Class 1: primary forests, Class 2: secondary forests representing natural forest succession, Class 3: secondary forests after tree plantation/fruit orchard, Class 4: secondary forests after agricultural crop cultivation). For two plots [2 (Class 4) and 24 (Class 3)], no SOC data were available.

Results of principal component analysis
The two primary forest plots (Class 1) were separated by the first PC from the three other classes. The separation of Classes 2 and 3 was less distinct, but the two plots assigned to Class 4 were clearly separated by the second PC from the other plots. The most important factors contributing to the separation of the plots along PC1 were total AGB and maximum tree height with contributions of 28.1 and 21.0 % (positive loadings; Figure 6). Soil organic C contributed only 10 % to the separation along PC1. In contrast, the separation along PC2 was due mainly to SOC stocks (40.3 %, positive loading). The second most important factor was maximum DBH (38.8 %, negative loading; Figure 6). Thus, the PCA results supported the classification system of land-use history and forest successional stages. They further illustrate that SOC stocks may be related to the four forest classes specified above, as shown by its contribution to PC2. This was particularly evident in the differences in SOC stocks between Class 1 (primary forests) and Class 4 (secondary forests after agriculture crop cultivation), as highlighted in the PCA.
Discussion
Critical evaluation of the study approach
Singapore’s forested areas are fragmented due to rapid urbanisation, and thus many forest remnants are now located very close to urban infrastructure. Additionally, nearly all forest stands are influenced by past land-use practices. A comparison of SOC stocks of different forest successional classes under these conditions was based on a small number of plots (e.g., two plots in primary forests only) and on unbalanced distribution of plots between the classes. Therefore, the results are indicative in nature as no detailed statistical analyses such as mean comparisons could be performed. Despite the relatively small number of plots used in this study, the approach of reconstruction of the past vegetation is important, as it provides valuable insights into the C sequestration of tropical forest soils.
Comparison of vegetation classification with other locations in Southeast Asia
The levels of AGB measured in the four successional classes of the forests in Singapore are within the range obtained in similar forest and disturbance types in the region. A synthesis of AGB data from various studies in Malaysia conducted between 1969 and 2012 showed levels of AGB under primary forest conditions that were beyond 250 Mg ha−1 and went as high as 425 Mg ha−1 (Syafinie & Ainuddin Reference Syafinie and Ainuddin2015). These results are consistent with the results for the primary forest plots in Singapore (Class 1). Levels of AGB of 100 to 200 Mg ha−1 in secondary forests after natural forest succession (Class 2) are comparable with the levels found in regenerating dipterocarp forests after disturbance (mainly as a result of logging). These were reported as 139 Mg ha−1 in East Kalimantan (Toma et al. Reference Toma, Warsudi, Osone, Sutedjo, Sato and Sukartiningsih2017) or between 170 and 190 Mg ha−1 in Sabah, Malaysia (Saner et al. Reference Saner, Loh, Ong and Hector2012). No data from other countries in Southeast Asia are available on secondary forests after tree plantation/fruit orchard or intensive agricultural cultivation (Class 3 and Class 4), as elsewhere such land was either converted to plantations, human settlements or used for industrial development. Overall, the forest classification system employed in this study was a good match to previous studies on forest succession in Singapore (Yee et al. Reference Yee, Chong, Neo and Tan2016). Attempts to explain levels of SOC with successional stages of the forests and past land management – which was the main focus of this study – had not been undertaken before in Singapore. Such research may encourage future studies for the region as an indirect but realistic estimate for SOC levels.
Changes in soil organic carbon stocks in the forest classes
The range of SOC stocks up to 50 cm mineral soil depth is in accordance with other studies carried out in lowland dipterocarp forests in humid Southeast Asia. Although the maximum SOC stock (127.7 Mg ha−1) was detected in a primary forest plot, a depletion of SOC stocks in secondary forests representing natural forest succession (Class 2) was not found. Ngo et al. (Reference Ngo, Turner, Muller-Landau, Davies, Larjavaara, Nik Hassan and Lum2013) compared the relation of C in AGB with SOC stocks in primary and secondary forests in Bukit Timah and found that in the primary forest AGB was the dominant C pool. In contrast, SOC was the dominant C pool in the secondary forest. This suggests that forest age and soil fertility have strong influences on C stocks in tropical forests (Jones et al. Reference Jones, DeWalt, Lopez, Bunnefeld, Pattison and Dent2019). Species diversity was a key factor for SOC stocks in tropical and subtropical forests due to root biomass input, fine root growth or leaf litter C/N ratio (Li et al. Reference Li, Liu, Xu, Bongers, Bao, Chen, Chen, Guo, Lai, Lin, Mi, Tian, Wang, Yan, Yang, Zheng and Ma2020, Russel et al. Reference Russel, Raich, Valverde-Barrantes and Fisher2007). However, Subashree et al. (Reference Subashree, Dar and Sundarapandian2019) observed negative correlations between SOC stocks and vegetation attributes such as BA, number of trees and tree species composition illustrating that it is still poorly understood how multiple drivers simultaneously affect SOC storage (Wiesmeier et al. Reference Wiesmeier, Urbanski, Hobley, Lang, von Lützow, Marin-Spiotta, van Wesemael, Rabot, Ließ, Garcia-Franco, Wollschläger, Vogel and Kögel-Knaber2019). Depleted SOC stocks after tree plantation/fruit orchard (Class 3) and after agricultural crop cultivation (Class 4) were evident – with a minimum SOC of 25 Mg ha−1 in Class 4. Losses of SOC due to land-use change from primary forests to tree plantations were reported in many studies (Chiti et al. Reference Chiti, Grieco, Perugini, Rey and Valentini2014, Leuschner et al. Reference Leuschner, Moser, Hertel, Erasmi, Leitner, Culmsee, Schuldt and Schwendenmann2013). Borchard et al. (Reference Borchard, Bulusu, Meyer, Rodionov, Herawati, Blagodatsky, Cadisch, Welp, Amelung and Martius2019) concluded that land-use change can reduce SOC in topsoil, but C stored in deep soils of tree dominated land-use systems remains stable. This was, however, not investigated in the present study, but is a scientific issue for future research. Also, different soil types play a crucial role in assessing SOC changes in secondary forests (Paz et al. Reference Paz, Goosem, Bird, Preece, Goosem, Fensham and Laurance2016). Data from the IPCC soil inventory in Singapore showed prevailing nutrient-poor and acidic soil conditions in Singapore’s forests with only a few outliers, indicating anthropogenic influences, e.g. fertilisation (Leitgeb et al. Reference Leitgeb, Ghosh, Dobbs, Englisch and Michel2019). As such, outlier plots were not included in this study. Thus, differences in SOC stocks observed in the four forest classes are probably not due to soil heterogeneity and site conditions but are most likely related to former agricultural and forest management practices.
Conclusion
As demonstrated in this study, plant-related parameters such as AGB, species composition and tree size can be of help to describe forest succession and vegetation recovery in Singapore. We also revealed relationships between the four forest successional classes obtained and SOC stocks. The outcomes provide opportunities for future research into the relationships between forest vegetation cover and SOC stocks, as these will help to better understand the role of forest conservation and land management on SOC sequestration. Taken together, such work should stimulate more research towards longer term monitoring and surveillance systems of vegetation cover in order to enhance our understanding of the potential effects of land-use on soils.
Supplementary material
To view supplementary material for this article, please visit https://doi.org/10.1017/S0266467422000177
Acknowledgements
This study was part of a national project to report on carbon stocks and fluxes from the land use and vegetation sector of Singapore. This project was funded by the Government of Singapore and administered by the National Parks Board (NParks). The work was coordinated and carried out by the Austrian Natural Resources Management and International Cooperation Agency (ANRICA). The authors gratefully acknowledge Mohamad Fairoz, Denise Chng, Lorraine Tan, Mohamed Lokman, Michael Englisch, Raffaela Wettl and Eugenie Fink for their support and technical assistance. The authors also thank Nathan King for language editing.
Declaration of interests
None.