



1 Introduction
Turbulent plumes often arise in industrial applications and environmental studies. Examples include smoke rising from a chimney, volcanic eruptions and deep water oil spills.
Some of the earliest analytical work on turbulent plumes was presented in a series of seminal papers by Morton, Taylor & Turner (Reference Morton, Taylor and Turner1956), Morton (Reference Morton1959) and Morton & Middleton (Reference Morton and Middleton1973) who examined plumes in uniform and stratified environments. In these studies the authors made the assumption that the entrainment of ambient fluid is proportional to the axial velocity of the plume,
 $u_{r}=\unicode[STIX]{x1D6FC}u_{z}$
, where
 $\unicode[STIX]{x1D6FC}$
is the so called entrainment coefficient. By making this assumption Morton et al. (Reference Morton, Taylor and Turner1956) were able to determine the axial velocity and width of a plume at a given axial distance from the source. Morton (Reference Morton1959) introduced the non-dimensional plume source parameter,
 $\unicode[STIX]{x1D6E4}_{0}$
, which relates the relative strengths of the mass, momentum and buoyancy fluxes at the source of the plume. He compared the behaviour of pure plumes where
 $\unicode[STIX]{x1D6E4}_{0}=1$
, to forced plumes where,
 $\unicode[STIX]{x1D6E4}_{0}<1$
. Morton & Middleton (Reference Morton and Middleton1973) called plumes with a plume function greater than one, hot lazy plumes or distributed plumes, as
 $\unicode[STIX]{x1D6E4}_{0}>1$
indicates that buoyancy dominates momentum at the source. More recently, such plumes have been referred to simply as lazy plumes.
Later researchers such as Caulfield (Reference Caulfield1991) and Hunt & Kaye (Reference Hunt and Kaye2005) extended this early work by examining how
 $\unicode[STIX]{x1D6E4}$
evolves as a function of axial distance from the source, where
 $$\begin{eqnarray}\unicode[STIX]{x1D6E4}(\tilde{z})=\frac{5\widetilde{Q}(\tilde{z})^{2}\widetilde{F}(\tilde{z})}{4\unicode[STIX]{x1D6FC}(\widetilde{M}(\tilde{z}))^{5/2}},\end{eqnarray}$$
and
 $\widetilde{Q},\widetilde{F}$
and
 $\widetilde{M}$
are the respective dimensional mass flux, buoyancy flux and momentum flux. Unlike
 $\unicode[STIX]{x1D6E4}_{0}$
,
 $\unicode[STIX]{x1D6E4}(\tilde{z})$
is a function of
 $z$
and here we will refer to
 $\unicode[STIX]{x1D6E4}(\tilde{z})$
as the plume function and
 $\unicode[STIX]{x1D6E4}_{0}$
as the plume source parameter. Here we follow Hunt & Kaye (Reference Hunt and Kaye2005) and define the entrainment coefficient as
 $$\begin{eqnarray}\unicode[STIX]{x1D6FC}=\frac{{\displaystyle \frac{\text{d}}{\text{d}\tilde{z}}}\displaystyle \int _{0}^{\infty }\tilde{u} _{z}\tilde{r}\,\text{d}\tilde{r}}{2\left[\displaystyle \int _{0}^{\infty }\tilde{u} _{z}^{2}\tilde{r}\,\text{d}\tilde{r}\right]^{1/2}},\end{eqnarray}$$
where integration is in the radial coordinate direction,
 $r$
. Their definition is related to the definition by Morton, Taylor and Turner, who assumed a top-hat profile, as
 $\unicode[STIX]{x1D6FC}=\unicode[STIX]{x1D6FC}_{MTT}/\sqrt{2}.$
Mass, momentum and buoyancy fluxes are defined as,
 $$\begin{eqnarray}\displaystyle & \displaystyle \widetilde{J_{Q}}(\tilde{z})=2\unicode[STIX]{x03C0}\int _{0}^{\infty }\tilde{u} _{z}\tilde{r}\,\text{d}\tilde{r}, & \displaystyle\end{eqnarray}$$
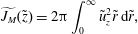 $$\begin{eqnarray}\displaystyle & \displaystyle \widetilde{J_{M}}(\tilde{z})=2\unicode[STIX]{x03C0}\int _{0}^{\infty }\tilde{u} _{z}^{2}\tilde{r}\,\text{d}\tilde{r}, & \displaystyle\end{eqnarray}$$
and
 $$\begin{eqnarray}\widetilde{J_{B}}(\tilde{z})=2\unicode[STIX]{x03C0}\int _{0}^{\infty }\tilde{u} _{z}\tilde{\unicode[STIX]{x1D719}}\tilde{r}\,\text{d}\tilde{r}\end{eqnarray}$$
respectively, where
 $\widetilde{\unicode[STIX]{x1D719}}$
is the dimensional buoyancy. Dimensional quantities are represented with a tilde and dimensionless quantities without one. In this study, as in Hunt & Kaye (Reference Hunt and Kaye2001), we will use the quantities
 $\widetilde{F}=2\widetilde{J_{B}}/\unicode[STIX]{x03C0}$
,
 $\widetilde{M}=2\widetilde{J_{M}}/\unicode[STIX]{x03C0}$
and
 $\widetilde{Q}=\widetilde{J_{Q}}/\unicode[STIX]{x03C0}$
.
It is known that in extremely lazy plumes, where
 $\unicode[STIX]{x1D6E4}_{0}\gg 1$
, the axial velocity initially accelerates and the plume width initially narrows near the plume source, before decelerating and widening in the far field. Caulfield (Reference Caulfield1991) showed analytically that this necking, or constricting of the plume radius, will occur when
 $\unicode[STIX]{x1D6E4}(\tilde{z})=2.5$
and that the flow will reach its maximum axial velocity when
 $\unicode[STIX]{x1D6E4}(\tilde{z})=1.25$
. Hunt & Kaye (Reference Hunt and Kaye2005) reformulated the equations of Morton et al. (Reference Morton, Taylor and Turner1956) (from here on referred to as MTT) in terms of the plume function,
 $\unicode[STIX]{x1D6E4}$
. Further, they derived approximate analytic formulas for
 $\unicode[STIX]{x1D6E4}$
as a function of non-dimensional axial distance. Their formulas are valid for very lazy plumes where
 $\unicode[STIX]{x1D6E4}_{0}$
is very large.
It is generally expected for
 $\unicode[STIX]{x1D6E4}(\tilde{z})$
to monotonically decrease to a value of
 $1$
as axial distance increases. However in a direct numerical simulation (DNS) of a purely convective plume,
 $\unicode[STIX]{x1D6E4}_{0}=\infty$
, carried out by Taub et al. (Reference Taub, Lee, Balachandar and Sherif2015) and a Reynolds-averaged Navier–Stokes (RANS) simulation conducted by Hargreaves, Scase & Evans (Reference Hargreaves, Scase and Evans2012), it was found that
 $\unicode[STIX]{x1D6E4}$
initially decreased to near zero then increased to a value greater than one, before beginning to monotonically approach the value of
 $1$
. A possible source for this behaviour is the assumption that the entrainment process is dependent on axial velocity is not valid near the source (Pham et al.
Reference Pham, Plourde, Kim and Balachandar2006; Taub et al.
Reference Taub, Lee, Balachandar and Sherif2015).
If
 $\unicode[STIX]{x1D6E4}(\tilde{z})$
does not monotonically decrease as expected, then other behaviour such as where necking and maximum axial velocity occur may also be called into question. In this study we attempt to address such questions by performing a series of direct numerical simulations of lazy plumes with varying values of
 $\unicode[STIX]{x1D6E4}_{0}$
. The evolution of properties such as maximum axial velocity, plume width, entrainment coefficient and
 $\unicode[STIX]{x1D6E4}$
as functions of axial distance will be examined. The value of
 $\unicode[STIX]{x1D6E4}$
at which the various plumes achieve their maximum axial velocity and narrowest width is compared to the theoretical values predicted by Caulfield (Reference Caulfield1991) and the evolution of
 $\unicode[STIX]{x1D6E4}(\tilde{z})$
is compared to that of the analytic solution predicted by Hunt & Kaye (Reference Hunt and Kaye2005). Further, the effect that plume laziness has on entrainment is explored. The simulation results for the lazy plumes are used to examine the recent energy consistent entrainment model of van Reeuwijk & Craske (Reference van Reeuwijk and Craske2015).
We begin in section § 2 by describing our non-dimensionalization, numerical technique and other assumptions we have made in this study. In section § 3 we will present our results and compare them to those expected from analytical theory. In our final section, § 4, we will discuss the repercussions of our findings.
2 Methodology
2.1 Flow model
We assume that the flow emanates either from a circular pipe or perhaps a heated plate of diameter
 $\tilde{D}$
. Fluid exiting the circular pipe or heated by the circular plate entrains ambient fluid above. We have limited our analysis to consider only plumes where variations in density are small compared to ambient density and thus use the Boussinesq approximation. Fluid properties, such as kinematic viscosity,
 $\tilde{\unicode[STIX]{x1D708}}$
, thermal diffusivity,
 $\tilde{k}$
, far-field ambient fluid density,
 $\tilde{\unicode[STIX]{x1D70C}}_{a}$
and gravitational acceleration,
 $\tilde{g}$
are considered constant.
To non-dimensionalize the governing equations, the proper scaling of velocity in the near-source region should be based on the dominant flux at the inlet. For a pure jet, the dominant flux is momentum and the proper velocity scale is
 $\tilde{U} _{I}$
, which is the average inlet velocity. For pure and lazy plumes, the dominant flux is buoyancy. An infinitely lazy plume, by definition, has
 $U_{I}=0$
, and hence must be scaled by
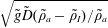 $\sqrt{\tilde{g}\tilde{D}(\tilde{\unicode[STIX]{x1D70C}}_{a}-\tilde{\unicode[STIX]{x1D70C}}_{I})/\tilde{\unicode[STIX]{x1D70C}}_{a}}$
, where
 $\tilde{\unicode[STIX]{x1D70C}}_{I}$
is the average density of the source fluid at inlet. For forced, pure and lazy plumes with
 $\tilde{U} _{I}$
not identically zero, either scaling can be used but it is more practical to use the scaling that corresponds to the dominant flux.
We non-dimensionalize the governing equations with plume inlet diameter
 $\tilde{D}$
as the length scale, the ambient density
 $\tilde{\unicode[STIX]{x1D70C}}_{a}$
as the density scale and
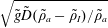 $\sqrt{\tilde{g}\tilde{D}(\tilde{\unicode[STIX]{x1D70C}}_{a}-\tilde{\unicode[STIX]{x1D70C}}_{I})/\tilde{\unicode[STIX]{x1D70C}}_{a}}$
as the velocity scale. We define the non-dimensional density perturbation as
 $\unicode[STIX]{x1D719}=(\tilde{\unicode[STIX]{x1D70C}}_{a}-\tilde{\unicode[STIX]{x1D70C}})/\tilde{\unicode[STIX]{x1D70C}}_{a}$
. With the above non-dimensionalization, we obtain the dimensionless Boussinesq governing equations as,
 $$\begin{eqnarray}\displaystyle & \displaystyle \unicode[STIX]{x1D735}\boldsymbol{\cdot }\boldsymbol{u}=0, & \displaystyle\end{eqnarray}$$
 $$\begin{eqnarray}\displaystyle & \displaystyle \frac{\unicode[STIX]{x2202}\boldsymbol{u}}{\unicode[STIX]{x2202}t}+\boldsymbol{u}\boldsymbol{\cdot }\unicode[STIX]{x1D735}\boldsymbol{u}=-\unicode[STIX]{x1D735}p+\frac{1}{\sqrt{Gr}}\unicode[STIX]{x1D6FB}^{2}\boldsymbol{u}+\unicode[STIX]{x1D719}\hat{\boldsymbol{k}}, & \displaystyle\end{eqnarray}$$
 $$\begin{eqnarray}\displaystyle & \displaystyle \frac{\unicode[STIX]{x2202}\unicode[STIX]{x1D719}}{\unicode[STIX]{x2202}t}+\boldsymbol{u}\boldsymbol{\cdot }\unicode[STIX]{x1D735}\unicode[STIX]{x1D719}=\frac{1}{\sqrt{Gr}Pr}\unicode[STIX]{x1D6FB}^{2}\unicode[STIX]{x1D719}, & \displaystyle\end{eqnarray}$$
where
 $\hat{\boldsymbol{k}}$
is the unit vector in the vertical direction. The dimensionless parameters appearing in the above equation are the Grashof number (
 $Gr$
) and the Prandtl number (
 $Pr$
), defined as:
 $$\begin{eqnarray}Gr=\frac{\left(\tilde{\unicode[STIX]{x1D70C}}_{a}-\tilde{\unicode[STIX]{x1D70C}}_{I}\right)\tilde{g}\tilde{D}^{3}}{\tilde{\unicode[STIX]{x1D70C}}_{a}\tilde{\unicode[STIX]{x1D708}}^{2}},\quad Pr=\frac{\tilde{\unicode[STIX]{x1D708}}}{\tilde{\unicode[STIX]{x1D6FC}}}.\end{eqnarray}$$
The computational domain is a rectangular region with non-dimensional length, width and height of
 $L_{x}$
,
 $L_{y}$
and
 $L_{z}$
respectively. The origin of the Cartesian coordinates,
 $x$
,
 $y$
and
 $z$
, is centred at the bottom of the rectangular box. The gravitational acceleration acting on the fluid is directed in the negative
 $z$
-direction.
2.2 Numerical simulations
Four different high resolution simulations were performed, starting with a slightly lazy plume all the way to a highly lazy plume. A fifth simulation of an infinitely lazy plume,
 $\unicode[STIX]{x1D6E4}_{0}=\infty$
, from a previous study by Taub et al. (Reference Taub, Lee, Balachandar and Sherif2015) was included as an asymptotic case. Each simulation was run long enough until statistical convergence was achieved. All simulations were run with a Prandtl number of 0.7 which is the approximate value for air. For the infinitely lazy plume, a Grashof number of
 $Gr=4.0\times 10^{6}$
was used with a zero inlet velocity. The rest of the simulations also used a Grashof number of
 $Gr=4.0\times 10^{6}$
and varying inlet velocities. The Grashof number was chosen in order to be large enough for the related flows to exhibit turbulence but small enough as to still be tractable by DNS. The inlet velocity was modified for each simulation in order to obtain the desired value of
 $\unicode[STIX]{x1D6E4}_{0}$
. In this way the ‘laziness’ of the simulated plume could be modified. These parameters are summarized in table 1. Note that the parameter
 $\unicode[STIX]{x1D6FC}_{0+}$
is the entrainment coefficient one grid point above the source, since the entrainment coefficient at the actual source is zero.
Table of DNS runs completed in the current study.

The governing equations were solved numerically on a Cartesian grid. The number of grid points in each direction are denoted as
 $N_{x}$
,
 $N_{y}$
and
 $N_{z}$
in the horizontal and vertical directions respectively. The grid points were clustered close to the source of momentum and buoyancy. The domain size was chosen to minimize the confinement effect in the lateral direction. Based on previous DNS studies where similar or larger Reynolds numbers were examined (such as Boersma, Brethouwer & Nieuwstadt (Reference Boersma, Brethouwer and Nieuwstadt1998) and Aissia, Zaouali & El Salem (Reference Aissia, Zaouali and El Salem2002)) we determine the size of our computational domain and grid resolution.
In the axial direction, the discrete function,
 $$\begin{eqnarray}\unicode[STIX]{x1D709}_{k}={\textstyle \frac{1}{2}}\tanh \left({\textstyle \frac{1}{2}}\unicode[STIX]{x1D713}_{k}\cdot \log (A_{z})\right),\end{eqnarray}$$
was used to obtain a non-uniform distribution of points. Here
 $\unicode[STIX]{x1D713}_{k}$
are
 $N_{z}$
evenly spaced discrete points ranging from zero to one and
 $A_{z}=1.76$
is the stretching parameter. These values were then scaled to generate the cell centre locations in the axial direction ranging from zero to
 $L_{z}$
. Fifty of the
 $N_{x}$
and
 $N_{y}$
grid points in the
 $x$
and
 $y$
directions are reserved for highly resolving the lazy plume core, which is defined as a square region of size
 $D$
in the
 $x{-}y$
plane centred along the jet or plume axis. Within this core region, grid points are evenly spaced. Outside this core region the size of each grid cell is progressively increased by a multiplicative factor of
 $A_{x}=A_{y}=1.037$
:
 $$\begin{eqnarray}\unicode[STIX]{x0394}X_{i+1}=A_{x}\unicode[STIX]{x0394}X_{i}\quad \text{and}\quad \unicode[STIX]{x0394}Y_{i+1}=A_{y}\unicode[STIX]{x0394}Y_{i}.\end{eqnarray}$$
The bottom boundary, at
 $z=0$
, where the radius,
 $r>1/2$
, we impose a no-slip wall. We allow the fluid to freely enter or leave the lateral boundaries,
 $x=\pm (1/2)L_{x},y=\pm (1/2)L_{y}$
, by applying Neumann boundary conditions. Neumann boundary conditions were set at the
 $z=L_{z}$
boundary of the simulations. The non-dimensional parameters, domain size, grid size and outflow boundary conditions used for the five simulations are summarized in table 1.
A second-order accurate central difference scheme is employed for the spatial discretization of the governing equations on a non-staggered grid system. A fractional step method is used for time advancement. In the advection–diffusion step, the nonlinear terms are treated explicitly using a second-order Adams–Bashforth scheme and the diffusion terms are treated implicitly with the Crank–Nicholson scheme. The pressure Poisson equation is solved as a pressure correction step. A final divergence-free velocity is obtained at each time step as part of the pressure correction step. More information regarding verification and validation of the code can be found in Taub et al. (Reference Taub, Lee, Balachandar and Sherif2015).
2.3 Length scales
The various mass, momentum and buoyancy fluxes at the plume source are also presented in table 1. From these source conditions the following length scales can be derived. The source radius length scaling,
 $$\begin{eqnarray}L_{q}=\frac{5Q_{0}}{6\unicode[STIX]{x1D6FC}M_{0}^{1/2}},\end{eqnarray}$$
which also represents the distance from the source to the virtual origin of a pure plume. The source momentum jet length,
 $$\begin{eqnarray}L_{m}=\sqrt{\frac{5M_{0}^{3/2}}{9\unicode[STIX]{x1D6FC}F_{0}}},\end{eqnarray}$$
also known as the Morton length scale, which identifies the distance a forced plume requires to adjust to pure plume behaviour, and an acceleration length scale,
 $$\begin{eqnarray}L_{a}\approx L_{q}^{3/5}L_{m}^{2/5},\end{eqnarray}$$
which can be used to determine the length required for a lazy plume to take on pure plume behaviour. These length scales are discussed in more detail by Caulfield & Woods (Reference Caulfield and Woods1995) and Hunt & Kaye (Reference Hunt and Kaye2005). The values of these length scales found for the various simulations, as well as the virtual origin,
 $z_{v}$
, are presented in table 1. In order to solve for the asymptotic virtual origin of a lazy plume, the methodology from Hunt & Kaye (Reference Hunt and Kaye2001) was utilized:
 $$\begin{eqnarray}z_{v}=z_{v}^{\ast }L_{q}=\unicode[STIX]{x1D6E4}_{0}^{-1/5}(1-\unicode[STIX]{x1D6FF})\left(\frac{5Q_{0}}{6\unicode[STIX]{x1D6FC}M_{0}^{1/2}}\right),\end{eqnarray}$$
where
 $\unicode[STIX]{x1D6FF}$
is a simple summation of the form
 $\unicode[STIX]{x1D6FF}=(3/35)\unicode[STIX]{x1D716}+(9/425)\unicode[STIX]{x1D716}^{2}+(11/1125)\unicode[STIX]{x1D716}^{3}+\cdots \,,\unicode[STIX]{x1D716}=(\unicode[STIX]{x1D6E4}_{0}-1)/\unicode[STIX]{x1D6E4}_{0}$
and
 $z_{v}^{\ast }$
is the scaled asymptotic virtual origin of a pure plume. The summation,
 $\unicode[STIX]{x1D6FF}$
, is approximately equal to 0.147 for large values of
 $\unicode[STIX]{x1D6E4}_{0}$
.
In discussing conditions at the source of the plume it is important to distinguish between values of parameters at the true source of the plume and the value of parameters at the virtual origin. In the results that follow in the next section, axial distances are sometimes scaled by the virtual origin for lazy plumes instead of the length scale used in the numerical simulations,
 $\widetilde{D}$
, to obtain
 $\unicode[STIX]{x1D701}=z/z_{v}$
.
Comparison of iso-surfaces of
 $\unicode[STIX]{x1D706}_{ci}=0.5$
of plumes with various values for the initial plume function,
 $\unicode[STIX]{x1D6E4}_{0}$
, with a close up of the near-source region shown in the bottom panels. Even the top panels do not show the entire computational domain.

3 Results
3.1 Vortical structures
Using the
 $\unicode[STIX]{x1D706}_{ci}$
technique described by Zhou et al. (Reference Zhou, Adrian, Balachandar and Kendall1999) and Chakraborty, Balachandar & Adrian (Reference Chakraborty, Balachandar and Adrian2005), vortex structures were visualized. When the flow has any kind of local vortical structure, the velocity gradient tensor will have one real eigenvalue and two complex conjugate eigenvalues. The imaginary portion of the complex eigenvalues,
 $\unicode[STIX]{x1D706}_{ci}$
, measures the strength of the swirling rate inside the local vortices. As Zhou et al. (Reference Zhou, Adrian, Balachandar and Kendall1999) describes, the
 $\unicode[STIX]{x1D706}_{ci}$
technique is advantageous over other methods because it is independent of the frame of reference and, because of the nature of the eigenvalues, eliminates regions where the flow has vorticity but is not spiralling. Fiedler (Reference Fiedler1988) describes three different modes of coherent structures in turbulent jets. The zeroth mode takes the form of rings, the 1st mode takes the form of helices and the second mode takes the form of double helices. Figure 1 shows iso-surfaces for
 $\unicode[STIX]{x1D706}_{ci}=0.5$
for the five different cases considered here. The value of 0.5 was chosen so that there was little background noise and all the vortex structures could be easily visualized.
The least lazy plumes,
 $\unicode[STIX]{x1D6E4}_{0}=0.75\sqrt{2}$
and
 $\unicode[STIX]{x1D6E4}_{0}=1.5\sqrt{2}$
, have vortices forming in structured rings, near the origin, surrounding a laminar core. These zeroth mode coherent structures are formed due to intense shear immediately above the orifice and exist until
 $z=2.5$
for the two cases. The velocity inherently decays and the shear decreases, causing the vortex rings to break down and form first and second mode coherent structures. As the plumes get lazier, these rings become less ordered and shift to higher modes at
 $z=2$
. Additionally, the instabilities begin appearing more along the centreline with a reduced laminar core. Pham, Plourde & Doan (Reference Pham, Plourde and Doan2007) and Taub et al. (Reference Taub, Lee, Balachandar and Sherif2015) observed similar behaviour in their direct numerical and large eddy simulations. It was shown that in very lazy plumes production and dissipation are at their maximum values along the flow axis and hence instabilities formed in that region first.
Velocity profiles at two different downstream locations for the various lazy plumes. Experimental results by Rouse, Yih & Humphreys (Reference Rouse, Yih and Humphreys1952) are also shown.

3.2 Velocity and buoyancy profiles
While Morton et al. (Reference Morton, Taylor and Turner1956) developed the plume conservation equations assuming a top-hat profile for velocity and buoyancy, plume and jet variables take on a Gaussian profile in the far field when they reach self-similarity. The Gaussian profiles for a plume take the form of
 $$\begin{eqnarray}\displaystyle & \displaystyle u_{z}=B_{u_{z}}J_{B}^{1/3}(z-z_{v})^{-1/3}\exp \left(\frac{\ln (0.5)\unicode[STIX]{x1D6FD}^{2}}{\unicode[STIX]{x1D6FD}_{1/2,u_{z}}^{2}}\right), & \displaystyle\end{eqnarray}$$
 $$\begin{eqnarray}\displaystyle & \displaystyle \unicode[STIX]{x1D719}=B_{\unicode[STIX]{x1D719}}J_{B}^{2/3}(z-z_{v})^{-5/3}\exp \left(\frac{\ln (0.5)\unicode[STIX]{x1D6FD}^{2}}{\unicode[STIX]{x1D6FD}_{1/2,\unicode[STIX]{x1D719}}^{2}}\right), & \displaystyle\end{eqnarray}$$
where
 $u_{z}$
is the axial velocity and
 $\unicode[STIX]{x1D719}$
is the buoyancy. Here
 $\unicode[STIX]{x1D6FD}$
is the similarity coordinate, defined as
 $\unicode[STIX]{x1D6FD}=r/(z-z_{v})$
,
 $B_{u_{z}}$
and
 $B_{\unicode[STIX]{x1D719}}$
are the similarity solution constants, while
 $\unicode[STIX]{x1D6FD}_{1/2,u_{z}}$
and
 $\unicode[STIX]{x1D6FD}_{1/2,\unicode[STIX]{x1D719}}$
are the half-widths of the Gaussian curves.
Figure 2 shows the velocity profiles at two different heights,
 $z=15$
and
 $z=30$
, for all five lazy plumes and experimental results from Rouse et al. (Reference Rouse, Yih and Humphreys1952). Figure 3 shows the same results for the buoyancy profiles. The figures were scaled in such a way so that
 $B_{u_{z}}$
and
 $B_{\unicode[STIX]{x1D719}}$
could be determined from the centreline values at
 $\unicode[STIX]{x1D6FD}=0$
. At
 $z=15$
, the velocity and buoyancy profiles have not clearly collapsed on to one curve. By
 $z=30$
, both profiles show a much better collapse near the tails but slightly varying centreline values for large values of
 $\unicode[STIX]{x1D6E4}_{0}$
, especially when compared to the experimental data. This could be an indication that the virtual origin is incorrect. Kaye & Hunt (Reference Kaye and Hunt2009) showed that the entrainment model for the virtual origin failed at large values of
 $\unicode[STIX]{x1D6E4}_{0}$
. In the present study,
 $B_{u_{z}}$
is between
 $4.2$
and
 $4.5$
and
 $B_{\unicode[STIX]{x1D719}}$
between
 $13.5$
and
 $15.8$
, while the infinitely lazy case found
 $B_{u_{z}}=3.9$
and
 $B_{\unicode[STIX]{x1D719}}=13.7$
and the experiments by Rouse et al. (Reference Rouse, Yih and Humphreys1952) found
 $B_{u_{z}}=4.7$
and
 $B_{\unicode[STIX]{x1D719}}=11$
. Further experiments (Turner Reference Turner1973) indicate that the values found by Rouse et al. (Reference Rouse, Yih and Humphreys1952) best match most laboratory observations. For the Gaussian half-widths, the present study yields
 $\unicode[STIX]{x1D6FD}_{1/2,u_{z}}=0.0895$
and
 $\unicode[STIX]{x1D6FD}_{1/2,\unicode[STIX]{x1D719}}=0.092$
, the infinitely lazy plume yielded
 $\unicode[STIX]{x1D6FD}_{1/2,u_{z}}=0.095$
and
 $\unicode[STIX]{x1D6FD}_{1/2,\unicode[STIX]{x1D719}}=0.095$
and the experimental study found
 $\unicode[STIX]{x1D6FD}_{1/2,u_{z}}=0.084$
and
 $\unicode[STIX]{x1D6FD}_{1/2,\unicode[STIX]{x1D719}}=0.095$
. Previous studies such as George, Alpert & Tamanini (Reference George, Alpert and Tamanini1977) and Chen & Rodi (Reference Chen and Rodi1980) have found slightly lower values for
 $B_{u_{z}}$
and
 $B_{\unicode[STIX]{x1D719}}$
with a higher spread while Nakagome & Hirata (Reference Nakagome and Hirata1977), Papanicolaou & List (Reference Papanicolaou and List1987) and Papanicolaou & List (Reference Papanicolaou and List1988) found slightly higher values for
 $B_{u_{z}}$
and
 $B_{\unicode[STIX]{x1D719}}$
with a lower spread.
Buoyancy profiles at two different downstream locations for the various lazy plumes. Experimental results by Rouse et al. (Reference Rouse, Yih and Humphreys1952) are also shown.

The scaled centreline velocities seem to converge to the same value for both heights, even before full self-similarity is reached, while the scaled centreline buoyancy values seem to vary much more. However, further downstream at
 $z=30$
, this variation is reduced. Buoyancy decays faster than axial velocity and hence better collapse is expected for the downstream buoyancy profiles.
3.3 Necking
Taub et al. (Reference Taub, Lee, Balachandar and Sherif2015) found that in lazy plumes, the source axial velocity is less than what the similarity solution, derived by Morton et al. (Reference Morton, Taylor and Turner1956), dictates. When the initial condition deviates from self-similarity, the difference will decay above the plume source and the solution will entrain back to self-similar behaviour. As Morton & Middleton (Reference Morton and Middleton1973) showed, a lazy plume will undergo an initial acceleration, which is shown in figure 4. This acceleration happens because of the large buoyancy force (relative to initial momentum), which in turn causes a narrowing of the plume radius, or necking, and is shown in figure 5. Caulfield (Reference Caulfield1991) described this as occurring in plumes with
 $\unicode[STIX]{x1D6E4}_{0}>2.5$
. It should be noted that, unlike the model by Morton et al. (Reference Morton, Taylor and Turner1956), the model by Priestley & Ball (Reference Priestley and Ball1955) does not predict necking. The axial velocity begins increasing as soon as the plume starts to neck and stops only when the plume expands back out again, a distance between 4 and 6 inlet diameters from the origin. The similarity solution of the axial centreline velocity as a function of the downstream distance corrected by the virtual origin is given by
 $$\begin{eqnarray}u_{zc}(z)=\left(\frac{5}{6\unicode[STIX]{x1D6FC}}\right)\left(\frac{9\unicode[STIX]{x1D6FC}}{10}\right)^{1/3}\left(\frac{F_{0}}{\unicode[STIX]{x1D70C}_{a}}\right)^{1/3}(z-z_{v})^{-1/3}\end{eqnarray}$$
and it depends on the entrainment coefficient,
 $\unicode[STIX]{x1D6FC}$
, buoyancy flux,
 $F_{0}$
, and ambient density,
 $\unicode[STIX]{x1D70C}_{a}$
, which are taken to be constants.
Figure 4 shows that the similarity solution predicts the far-field behaviour very well. The deficit in momentum, the defining feature of lazy plumes, can be seen in the significantly lower source axial velocity compared to the prediction in (3.3). The rapid increase in axial velocity above the source, followed by a peak and subsequent decay are only seen in the simulations, as the theory only predicts monotonic decay.
Centreline axial velocity behaviour. The DNS results are compared against the theoretical predictions of Hunt & Kaye (Reference Hunt and Kaye2005).

The near-source plume width as a function of
 $z$
.

The neck is more pronounced the lazier the plume gets, however, there is still slight necking for
 $\unicode[STIX]{x1D6E4}_{0}=0.75\sqrt{2}$
, up to approximately 5 % of the initial radius. This is an important fact that must be considered because the theory shows a higher threshold for the source conditions at which a plume will undergo necking. Nevertheless, this could also be a numerical artefact, caused by the no-slip floor that the plumes are issuing from. For
 $\unicode[STIX]{x1D6E4}_{0}=150\sqrt{2}$
, we observe a neck that reduces up to 70 % of the initial diameter at its minimum radius. For the infinitely lazy case, we see a neck reduction up to 80 %. The minimum radius occurs between
 $z=0.5$
and
 $z=6$
, with lazier plumes having a longer region where the contraction occurs. The necks occur at a lower height than the maximal velocity, which Caulfield (Reference Caulfield1991) showed is the case for Boussinesq plumes. The actual contracted region can extend up to
 $z=6$
for the laziest plume. This is also the region where a shift from vortex rings to vortex helices takes place. As the ordered vortex rings move through the neck, they get compressed and stretched. They become longer and lose their coherency. As two-dimensional and three-dimensional instabilities take place, these structures break up into smaller finger-like and helical vortices once the neck opens back up. The larger initial vortex structures can engulf more fluid, and in fact entrain more, than the smaller vortices occurring further downstream. This is one of the reasons that the entrainment coefficient is larger in the neck, as will be seen in the next section. Furthermore, the larger entrainment means more ambient, low momentum fluid is pulled in, which could explain why the laziest plume sees a much sharper deceleration phase.
3.4 Entrainment
In their calculations, Morton et al. (Reference Morton, Taylor and Turner1956) and Morton & Middleton (Reference Morton and Middleton1973) use a constant value for the entrainment coefficient,
 $\unicode[STIX]{x1D6FC}_{MTT}$
, when determining the plume source parameter,
 $\unicode[STIX]{x1D6E4}_{0}$
. Furthermore, because a lazy plume is not self-similar in the near-source region and has to entrain to a self-similar solution, a larger value for the entrainment coefficient is expected for that region. As was shown (Abraham Reference Abraham1965), the entrainment coefficient cannot be a constant in the transition region between similarity solutions. This coefficient can also vary greatly between jets, pure plumes and lazy plumes (Matulka et al.
Reference Matulka, López, Redondo and Tarquis2014). In figure 6, this very same behaviour is presented. Entrainment was calculated using (1.2), where the integrals were taken across the entire horizontal domain for every height and then a vertical derivative was computed. At
 $z=0$
, the coefficient of entrainment is relatively high for all plumes. Immediately above the inlet, it quickly drops to a value close to zero and then increases very rapidly to a value between
 $0.2$
and
 $0.39$
in the four different lazy plume simulations as the neck forms and the plume accelerates. In the infinitely lazy case, the entrainment coefficient at
 $z=0$
is even higher, drops very close to zero and then quickly asymptotes to the far-field value of 0.12. This behaviour was also noted by van Reeuwijk et al. (Reference van Reeuwijk, Salizzoni, Hunt and Craske2016) for their pure plume case. The entrainment in the near field is dominated by the large, ordered ring structures and the long, helical structures in the neck (Liepmann & Gharib Reference Liepmann and Gharib1992; Citriniti & George Reference Citriniti and George2000; McIlwain & Pollard Reference Mcilwain and Pollard2002). After the initial increase, the entrainment coefficient decreases, more or less, monotonically. At about
 $z=20$
, the entrainment coefficient converges for all five simulations to a value of
 $0.12$
. Many experimental researchers have found similar values. Lee & Emmons (Reference Lee and Emmons1961), Anwar (Reference Anwar1969) and Harris (Reference Harris1999) have found values of 0.13 for plane plumes while Schmidt (Reference Schmidt1941), Railston (Reference Railston1954), Kotsovinos (Reference Kotsovinos1975), George et al. (Reference George, Alpert and Tamanini1977) and Nakagome & Hirata (Reference Nakagome and Hirata1977) found values of 0.12 for round plumes. Rouse et al. (Reference Rouse, Yih and Humphreys1952) found a value of
 $\unicode[STIX]{x1D6FC}=0.12$
for a plume with Grashof number of
 $Gr=1974^{2}$
, while the present study used a Grashof number of
 $Gr=2000^{2}$
. For this reason, the present study used a constant value for the entrainment coefficient when computing the plume source parameter,
 $\unicode[STIX]{x1D6E4}_{0}$
(see table 1), in order to compare with the constant entrainment coefficient derivations for the plume function from Hunt & Kaye (Reference Hunt and Kaye2005).
Comparison of the entrainment coefficient, using the top-hat definition of Morton et al. (Reference Morton, Taylor and Turner1956), from the DNS of plumes with various initial values for the plume source parameter,
 $\unicode[STIX]{x1D6E4}_{0}$
, plotted against the vertical coordinate,
 $z$
. The inset shows the variation in the region from
 $z=0$
to
 $z=1$
.

In a recent paper, van Reeuwijk & Craske (Reference van Reeuwijk and Craske2015) relate the theories of Priestley & Ball (Reference Priestley and Ball1955) and Morton et al. (Reference Morton, Taylor and Turner1956) to derive an energy consistent unified entrainment relation (see also Fox Reference Fox1970; Kaminski, Tait & Carazzo Reference Kaminski, Tait and Carazzo2005). The theory by Morton et al. (Reference Morton, Taylor and Turner1956) assumes a constant entrainment coefficient that is not a function of the Richardson number while the other theory by Priestley & Ball (Reference Priestley and Ball1955) assumes constant turbulence production that is not a function of the Richardson number. In order to apply the unified theory of van Reeuwijk & Craske (Reference van Reeuwijk and Craske2015), first we define the integral buoyancy,
 $B$
, Richardson number,
 $Ri$
, and the profile coefficients for the energy flux,
 $\unicode[STIX]{x1D6FE}_{m}$
, buoyancy flux,
 $\unicode[STIX]{x1D703}_{m}$
, and turbulence production,
 $\unicode[STIX]{x1D6FF}_{m}$
, as
 $$\begin{eqnarray}\displaystyle & \displaystyle B=2\int _{0}^{\infty }\unicode[STIX]{x1D719}r\,\text{d}r, & \displaystyle\end{eqnarray}$$
 $$\begin{eqnarray}\displaystyle & \displaystyle Ri=\frac{2\sqrt{2}BQ}{M^{3/2}}, & \displaystyle\end{eqnarray}$$
 $$\begin{eqnarray}\displaystyle & \displaystyle \unicode[STIX]{x1D6FE}_{m}=\frac{8Q}{M^{2}}\int _{0}^{\infty }u_{z}^{3}r\,\text{d}r, & \displaystyle\end{eqnarray}$$
 $$\begin{eqnarray}\displaystyle & \displaystyle \unicode[STIX]{x1D703}_{m}=\frac{FQ}{BM}, & \displaystyle\end{eqnarray}$$
and
 $$\begin{eqnarray}\unicode[STIX]{x1D6FF}_{m}=\frac{16\sqrt{2}Q^{2}}{M^{5/2}}\int _{0}^{\infty }u_{z}^{\prime }u_{r}^{\prime }\frac{\text{d}u_{z}}{\text{d}r}r\,\text{d}r.\end{eqnarray}$$
Primed quantities represent fluctuating components of the total flow. The rigorous derivation of van Reeuwijk & Craske (Reference van Reeuwijk and Craske2015), after some simplifying assumptions for a mean, self-similar plume, leads to
 $$\begin{eqnarray}\unicode[STIX]{x1D6FC}_{MS}=-\frac{\unicode[STIX]{x1D6FF}_{m}}{2\unicode[STIX]{x1D6FE}_{m}}+\left(1-\frac{\unicode[STIX]{x1D703}_{m}}{\unicode[STIX]{x1D6FE}_{m}}\right)Ri.\end{eqnarray}$$
The Richardson number,
 $Ri$
, profile coefficients for the energy flux,
 $\unicode[STIX]{x1D6FE}_{m}$
, and buoyancy flux,
 $\unicode[STIX]{x1D703}_{m}$
, and the entrainment coefficient,
 $\unicode[STIX]{x1D6FC}_{MS}$
, for a mean self-similar plume, defined in van Reeuwijk & Craske (Reference van Reeuwijk and Craske2015), and plotted as a function of plume height. Panel (d) is plotted from
 $z=15$
to
 $z=45$
to highlight the downstream values for the entrainment coefficient, where the plumes reach a self-similar state.

Different analyses led other researchers (Fischer et al.
Reference Fischer, List, Koh, Imberger and Brooks1979; Wang & Law Reference Wang and Law2002; Kaye Reference Kaye2008) to the same conclusions. The two terms in (3.9) represent the contributions from turbulent kinetic energy production and the influence of the Richardson number. For top-hat profiles, the Richardson number is directly proportional to
 $\unicode[STIX]{x1D6E4}$
. This relation holds very well for pure jets, buoyant jets and pure plumes but has not been extensively scrutinized for lazy plumes, especially in the near-source region. Equations (3.5)–(3.7) and (3.9) are plotted in figure 7. The Richardson number, in figure 7(a), has a value of 0.15 and 0.5 at
 $z=0$
for
 $\unicode[STIX]{x1D6E4}_{0}=0.75\sqrt{2}$
and
 $\unicode[STIX]{x1D6E4}_{0}=1.5\sqrt{2}$
respectively. It quickly decays to a far-field value of 0.05 in both instances. For the laziest two cases, initially the Richardson number is extremely large because the velocity and the resulting shear are very low relative to the buoyancy. For
 $\unicode[STIX]{x1D6E4}_{0}=15\sqrt{2}$
, the initial Richardson number is equal to 50.6, two orders of magnitude larger from the previous two cases, and decays nearly monotonically, reaching the same far-field value of 0.05 after approximately
 $20$
plume source diameters. The
 $\unicode[STIX]{x1D6E4}_{0}=150\sqrt{2}$
case starts at a Richardson value of 5201.8, another two orders of magnitude larger than the value for
 $\unicode[STIX]{x1D6E4}_{0}=15\sqrt{2}$
, and decays until
 $z=4$
, after which it increases slightly over an axial distance of two source diameters and then decreases again monotonically, reaching far-field values of 0.05 at
 $z=30$
. The profile coefficients for energy flux and buoyancy flux, figure 7(b,c), behave in a similar manner to one another. For all four cases, the initial values at
 $z=0$
are about 1 due to the specified inlet profiles and immediately increase above the source, reaching peak values at
 $z=4.5$
for the laziest case and at
 $z=3.5$
for all others. At
 $z=20$
, a self-similar state is reached and the curves show great collapse, with far-field values of
 $\unicode[STIX]{x1D6FE}_{m}=1.7$
and
 $\unicode[STIX]{x1D703}_{m}=1.3$
. These values are slightly higher than experimental results for pure and forced plumes. In figure 7(d) we plot
 $\unicode[STIX]{x1D6FC}_{MS}$
, defined in (3.9), from
 $z=15$
to
 $z=45$
to highlight the far-field values for the entrainment coefficient, where the assumption of a self-similar state holds. The coefficient in the near field, computed using (3.9), is severely over predicted and not shown. van Reeuwijk et al. (Reference van Reeuwijk, Salizzoni, Hunt and Craske2016) showed that this model holds very well in the region
 $z>20$
, but over prediction by conventional models has been addressed by Kaye & Hunt (Reference Kaye and Hunt2009) as noted in Carlotti & Hunt (Reference Carlotti and Hunt2017). In the far field, however, the coefficient for entrainment reaches values between 0.06 and 0.08, which are the approximate values for Gaussian plumes. For a lazy plume, it is known that in the near field, velocity and buoyancy profiles are changing shape and turbulence levels are fluctuating significantly. This might very well be one reason for the over prediction by (3.9). Furthermore, certain assumptions break down near the source. van Reeuwijk & Craske (Reference van Reeuwijk and Craske2015), in describing turbulent kinetic energy production, make a boundary layer assumption which asserts that the gradient of the axial velocity in the radial direction is dominant. Taub et al. (Reference Taub, Lee, Balachandar and Sherif2015) showed that this boundary layer approximation does not hold near the source region. Additionally, van Reeuwijk et al. (Reference van Reeuwijk, Salizzoni, Hunt and Craske2016) concluded that the greatest contributions to entrainment comes from the production term. In figure 8, we plot the turbulent kinetic energy production as given by (3.8) as well as the full production term given in (3.10), evaluated from the DNS, where
 $u_{\unicode[STIX]{x1D703}}^{\prime }$
is the azimuthally fluctuating velocity component:
 $$\begin{eqnarray}\unicode[STIX]{x1D6FF}_{total}=u_{z}^{\prime }u_{r}^{\prime }\left(\frac{\unicode[STIX]{x2202}u_{z}}{\unicode[STIX]{x2202}r}+\frac{\unicode[STIX]{x2202}u_{r}}{\unicode[STIX]{x2202}z}\right)+u_{z}^{\prime }u_{z}^{\prime }\frac{\unicode[STIX]{x2202}u_{z}}{\unicode[STIX]{x2202}z}+u_{r}^{\prime }u_{r}^{\prime }\frac{\unicode[STIX]{x2202}u_{r}}{\unicode[STIX]{x2202}r}+u_{\unicode[STIX]{x1D703}}^{\prime }u_{\unicode[STIX]{x1D703}}^{\prime }\frac{u_{r}}{r}.\end{eqnarray}$$
Production, because it is a sink term in the equation for mean kinetic energy, is negative in this instance. However, in the DNS, production becomes positive directly above the inlet, implying it first acts as a source term for mean kinetic energy before becoming negative approximately 3 plume inlet diameters downstream. It is evident from figure 8 that production behaves similarly in both instances. Nonetheless the magnitudes vary by two orders. Clearly the influence of radial and azimuthal fluctuations as well as other gradients of mean velocity are too significant to neglect. In essence the boundary layer theory is inapplicable in the near-source region and this will also diminish the role of the Richardson number in correctly predicting near-field entrainment.
The turbulent kinetic energy production plotted as a function of plume height (a) as predicted by van Reeuwijk & Craske (Reference van Reeuwijk and Craske2015) and (b) as seen in the present DNS.

The entrainment coefficient, as predicted by theory from Carlotti & Hunt (Reference Carlotti and Hunt2017), plotted against the vertical coordinate,
 $z$
.

Building on this work, Carlotti & Hunt (Reference Carlotti and Hunt2017) derived an empirical entrainment model for lazy plumes that would encompass Boussinesq and non-Boussinesq flow regimes. Their theory is based on a power-law formulation of the form
 $\unicode[STIX]{x1D6FC}=\unicode[STIX]{x1D6FC}_{p}(\unicode[STIX]{x1D6E4}/\unicode[STIX]{x1D6E4}_{p})^{\unicode[STIX]{x1D714}}$
, where the subscript
 $p$
denotes pure plume values and the parameter
 $0\leqslant \unicode[STIX]{x1D714}<1$
is the power-law exponent. Further, they defined a new plume acceleration length scale, similar to the definitions by Caulfield & Woods (Reference Caulfield and Woods1995) and Hunt & Kaye (Reference Hunt and Kaye2005), as
 $$\begin{eqnarray}L=\frac{2^{7/10}}{5\unicode[STIX]{x1D6E4}_{p}^{4/5}}\frac{2^{-3\unicode[STIX]{x1D714}/(10(1-\unicode[STIX]{x1D714}))}}{1-\unicode[STIX]{x1D714}}\frac{G_{0}^{3/5}}{\unicode[STIX]{x1D70C}_{a}^{3/5}F^{1/5}}.\end{eqnarray}$$
Here, the Boussinesq-limit mass flux,
 $Q_{0}$
, has been replaced with a generalized mass flux,
 $G_{0}$
, in order to allow for non-Boussinesq limits. Ultimately, they arrive at the following functional form for the entrainment coefficient,
 $$\begin{eqnarray}\unicode[STIX]{x1D6FC}_{CH}=\unicode[STIX]{x1D6FC}_{p}\left(\frac{(3z/8L+2^{3/8})^{8/3}}{(3z/8L+2^{3/8})^{8/3}-2}\right)^{1/4}.\end{eqnarray}$$
We plot (3.12) in figure 9, using a value of
 $\unicode[STIX]{x1D714}=0.62$
. The theory predicts very rapid decay to far-field behaviour (less than 5 plume source diameters) while in the DNS we observe this behaviour only after 20 plume diameters. All of the plumes are in the Boussinesq limit and hence density does not vary significantly. This as well as the fact that the input fluxes do not differ considerably are possible reasons for the nearly indistinguishable difference between the curves. Nevertheless the above model is able to partially capture the rapid increase in
 $\unicode[STIX]{x1D6FC}$
seen in the simulation results (see figure 6). The drastic differences between the model and simulations can be attributed to the shortcomings of a purely empirical model.
The plume function plotted against scaled height
 $\unicode[STIX]{x1D701}=z/z_{0}$
. Panel (b) shows a plot of plume function plotted against the shifted
 $\unicode[STIX]{x1D701}^{\prime }$
and the DNS results are compared against theory from Hunt & Kaye (Reference Hunt and Kaye2005).

Variation of mass flux and momentum flux with axial distance, corrected by virtual origin, for the DNS and theory.

3.5 Plume function
The original plume conservation equations derived by Morton et al. (Reference Morton, Taylor and Turner1956) were for ideal, long thin self-similar plumes. Lazy plumes do not fall into this category near the source. Hence the inapplicability of the self-similar conservation equations is to be expected (Kaye & Hunt Reference Kaye and Hunt2009). The plume function initially increases before decreasing monotonically towards an asymptotic value of 1. Morton & Middleton (Reference Morton and Middleton1973) and Hunt & Kaye (Reference Hunt and Kaye2005) predicted a strictly monotonic decrease but, just like Hargreaves et al. (Reference Hargreaves, Scase and Evans2012) and Taub et al. (Reference Taub, Lee, Balachandar and Sherif2015) have shown, the present study observed this not to be the case for a lazy plume, as shown in figure 10(a). The aforementioned researchers considered a constant entrainment coefficient while the present study found it to be variable, particularly in the near-source region where the lazy plume entrains towards self-similarity. Initially, the plume function decreases for all plumes to a value below 2 before increasing, reaching maximum values of
 $\unicode[STIX]{x1D6E4}=2.1,2.6,3.2$
and
 $7.5$
at
 $\unicode[STIX]{x1D701}=1$
, respectively, before monotonically decaying to the pure plume behaviour. It has been argued that a lazy plume can be thought of as a forced plume with a virtual origin above the physical source, where the momentum flux is acting against the flow, hence slowing the plume down and causing it to be lazy. Furthermore, Chen & Rodi (Reference Chen and Rodi1980) found that the virtual origin can exist anywhere between three diameters below the orifice and three diameters above the orifice. However, a more consistent definition of virtual origin was provided by Hunt & Kaye (Reference Hunt and Kaye2001, Reference Hunt and Kaye2005) with expression (2.10) for the location of the virtual origin below the source. In figure 10(b) we plot the plume function against the shifted coordinate,
 $\unicode[STIX]{x1D701}^{\prime }=\unicode[STIX]{x1D701}-1$
. Using the value
 $\unicode[STIX]{x1D6E4}^{\prime }=\unicode[STIX]{x1D6E4}(\unicode[STIX]{x1D701}=1)$
as the new reference we use the analytical result from Hunt & Kaye (Reference Hunt and Kaye2005) to obtain the corresponding theoretical prediction,
 $$\begin{eqnarray}\unicode[STIX]{x1D6E4}=1+\left({\textstyle \frac{4}{5}}\unicode[STIX]{x1D6FA}\unicode[STIX]{x1D701}^{\prime }+(\unicode[STIX]{x1D6E4}^{\prime }-1)^{-4/5}\right)^{-5/4}\end{eqnarray}$$
and plot it alongside the DNS result, where
 $\unicode[STIX]{x1D6FA}=(10/3)\unicode[STIX]{x1D6E4}^{\prime 1/2}/(\unicode[STIX]{x1D6E4}^{\prime }-1)^{3/10}.$
The agreement is quite good, particularly in the far field. The slight discrepancy, which is more pronounced for lower values of
 $\unicode[STIX]{x1D6E4}^{\prime }$
, can be attributed to the fact that (3.13) was derived for large values of
 $\unicode[STIX]{x1D6E4}$
, where the assumption
 $\unicode[STIX]{x1D6E4}\approx \unicode[STIX]{x1D6E4}-1$
was made. Hence, for smaller values of
 $\unicode[STIX]{x1D6E4}$
some discrepancy can be expected. All of the lazy plumes asymptote to pure plumes with a value of
 $\unicode[STIX]{x1D6E4}=1$
around
 $\unicode[STIX]{x1D701}^{\prime }\gtrapprox 5$
, as observed by Shabbir & George (Reference Shabbir and George1994). The laziest plume actually decays to pure plume behaviour at a faster rate than the less lazy plumes. This behaviour is due to the larger entrainment coefficient in the laziest plume throughout the neck and transitional region as it evolves to a self-similar state. Figure 11(a,b) shows the variation of mass flux and momentum flux with axial distance compared to the theoretical predictions by Hunt & Kaye (Reference Hunt and Kaye2005), which are given below. The simulation results have been corrected by the virtual origin for each case:
 $$\begin{eqnarray}\displaystyle & \displaystyle Q(z)=\left(\frac{5F_{0}}{4\unicode[STIX]{x1D6FC}}\right)^{1/3}\left(\frac{6\unicode[STIX]{x1D6FC}(z-z_{v})}{5}\right)^{5/3}, & \displaystyle\end{eqnarray}$$
 $$\begin{eqnarray}\displaystyle & \displaystyle M(z)=\left(\frac{5F_{0}}{4\unicode[STIX]{x1D6FC}}\right)^{2/3}\left(\frac{6\unicode[STIX]{x1D6FC}(z-z_{v})}{5}\right)^{4/3}. & \displaystyle\end{eqnarray}$$
It is clear that these fluxes grow monotonically. Furthermore, buoyancy flux is constant for all plumes. Hence, the rapid variation in
 $\unicode[STIX]{x1D6E4}$
can be explained by the rapid change in the entrainment coefficient and variation in mass flux and momentum flux. As the plume propagates from the inlet into the ambient, the entrainment coefficient grows much faster than the momentum and buoyancy flux, causing
 $\unicode[STIX]{x1D6E4}$
to decrease rapidly. Once the plumes start accelerating and entraining more fluid, the mass and momentum flux grow while the entrainment coefficient decreases, which is seen as an increase in
 $\unicode[STIX]{x1D6E4}$
. Eventually, this coefficient asymptotes to a value of 0.12 and the plume function starts decaying monotonically. The theoretical predictions for mass and momentum flux have roughly the same slope as the simulation results, with some variation occurring for mass flux in the far field.
Total, mean and fluctuating buoyancy flux as a function of plume height for the five cases scaled by the total flux.

Centreline axial buoyancy evolution as a function of plume height for the different cases considered.

We plot the contributions of the mean,
 $F_{m}=4\int _{0}^{\infty }\,\!u_{z}\unicode[STIX]{x1D719}r\,\text{d}r$
, and fluctuating,
 $F_{f}=4\int _{0}^{\infty }u_{z}^{\prime }\unicode[STIX]{x1D719}^{\prime }r\,\text{d}r$
, components of the total buoyancy flux,
 $F_{tot}=F_{m}+F_{f}$
, in figure 12. For
 $\unicode[STIX]{x1D6E4}_{0}=0.75\sqrt{2}$
and
 $\unicode[STIX]{x1D6E4}_{0}=1.5\sqrt{2}$
, contributions from the fluctuating component are negligible until
 $z=2.5$
, which corresponds to the minimum radius location. At
 $z=4.5$
, the fluctuations reach their peak (and far field) contributions of
 $13\,\%$
and
 $15\,\%$
, respectively. This location also corresponds to the end of the plume neck, after which the plume spreads out radially. The two laziest cases,
 $\unicode[STIX]{x1D6E4}_{0}=150\sqrt{2}$
and
 $\unicode[STIX]{x1D6E4}_{0}=\infty$
, behaved in a different manner. Right above the source, the contributions from the fluctuating components are between
 $12\,\%$
and
 $17\,\%$
. At the minimum radius,
 $z=3$
, the fluctuations drop to
 $8\,\%$
and then rapidly increase to peak values of
 $33\,\%$
, corresponding to the end of the plume neck. Three diameter lengths after the neck, the fluctuations decay to their far-field values. The intermediate case,
 $\unicode[STIX]{x1D6E4}_{0}=15\sqrt{2}$
, behaved in yet another way. The buoyancy fluctuations increase immediately above the source, reaching their peak of
 $20\,\%$
at the minimum radius,
 $z=3$
. The fluctuations then decay until the end of the neck at
 $z=4.5$
, reaching their constant far-field value of
 $13\,\%$
.
Figure 13 shows the behaviour of centreline buoyancy,
 $\unicode[STIX]{x1D719}(r=0)=\unicode[STIX]{x1D719}_{c}$
. Buoyancy begins decaying almost immediately above the source for the laziest two cases. As the flow passes through the neck, mixing decreases slightly until the end of the neck. For
 $\unicode[STIX]{x1D6E4}_{0}=15\sqrt{2}$
, buoyancy begins decaying monotonically as soon as the neck forms. However, in the case of
 $\unicode[STIX]{x1D6E4}_{0}=0.75\sqrt{2}$
and
 $\unicode[STIX]{x1D6E4}_{0}=1.5\sqrt{2}$
, buoyancy remains constant until the fluid passes through the minimum radius at
 $z=3$
, after which it decays monotonically.
4 Conclusion
The non-dimensional plume function,
 $\unicode[STIX]{x1D6E4}$
, is a combination of the mass, momentum and buoyancy fluxes and is a way to characterize plume and jet flows. Pure jets, buoyant jets and pure plumes have received a great deal of attention in the past. A flow in which buoyancy dominates momentum is termed as a lazy plume. These types of flows have not received nearly as much attention and surely not through high resolution direct numerical simulations. Four lazy plumes with varying inlet velocities corresponding to different values of the plume function were simulated to study the evolution of the entrainment coefficient and coherent structures in the near-field region. The model by Morton et al. (Reference Morton, Taylor and Turner1956) assumes that turbulent Reynolds stresses are more dominant than viscous shear stresses in a plume. In the immediate near-field non-turbulent stresses dominate and cause vortex rings to form. These rings can engulf ambient fluid and promote mixing, causing plumes to decay faster. Because the axial velocity at the source in lazy plumes is less than what the self-similar solution predicts, a neck forms to accelerate the flow. In the neck region, the coherent ring structures are deformed and stretched, resulting in larger helical structures. The presence of buoyancy in lazy plumes promotes the formation of these larger coherent structures while also accelerating the plumes. Hence it is one of the possible reasons plumes have a greater entrainment coefficient than jets. In the near-source region it was shown that this coefficient is not a constant, but rather varies along the downstream direction. This is a direct result of the lazy plume needing to entrain more fluid in order to evolve to a self-similar state (Carazzo, Kaminski & Tait Reference Carazzo, Kaminski and Tait2006). Because of this, the plume function does not decay monotonically as theorized (Hunt & Kaye Reference Hunt and Kaye2005). If, however, the data are plotted against a new axial coordinate,
 $\unicode[STIX]{x1D701}^{\prime }$
, a monotonic decay that matches very well with theory is observed. The lazy plumes all converge on a far-field value of
 $\unicode[STIX]{x1D6E4}=1$
, corresponding to pure plume behaviour, after five non-dimensional lengths. The most important take away is that the entrainment coefficient, velocity and
 $\unicode[STIX]{x1D6E4}$
increases in the neck region and are functions of the plume source parameter,
 $\unicode[STIX]{x1D6E4}_{0}$
.
Acknowledgements
This work was supported by the U.S. Department of Energy, National Nuclear Security Administration, Advanced Simulation and Computing Program, as a Cooperative Agreement to the University of Florida under the Predictive Science Academic Alliance Program, under contract no. DE-NA0002378. The authors would like to thank Professor C. P. Caulfield of the University of Cambridge for his enlightening suggestions that partially motivated this study.



