INTRODUCTION
Phosphorus (P) fertilization is one of the most important measures for improving crop yield, ensuring soil fertility and meeting the need for food of an increasing population, particularly for China with its population of 1·4 billion (China Agriculture Press 2008). However, intensive crop production and excessive P fertilization have resulted in P accumulation in soils (Barberis et al. Reference Barberis, Ajmone, Scalenghe, Lammers and Schwertmann1995; De Smet et al. Reference De Smet, Hofman, Vanderdeelen, Van Meirvenne and Baert1996; Zhou Reference Zhou and Horst2001; Djodjic et al. Reference Djodjic, Bergstrom and Grant2005; Ma et al. Reference Ma, Li, Li, Tang, Liang, Huang, Wang, Liu and Yang2009), which can lead to freshwater eutrophication (Sharpley et al. Reference Sharpley, Foy and Withers2000). Optimal P fertilization management makes the best use of non-renewable P resources, while minimizing environmental pollution risks.
Dobermann et al. (Reference Dobermann, Cassman, Sta. Cruz, Adviento and Pampolino1996), based on long-term experiments across 11 sites in Asia, reported that rice requires 1·8–4·2 kg P to produce 1 t of grain. In another long-term wheat–maize rotation experiment across five sites in China, Tang et al. (Reference Tang, Li, Ma, Hao and Li2008) showed that 4·0–4·4 kg P/ha is required to produce 1 t of maize and 3·0–4·0 t/ha of wheat. However, no attempt was made to estimate P fertilizer requirements for specific target yields. Such information is very important when making optimal P fertilization recommendations and improving P fertilizer efficiency.
In rainfed ecosystems, there is generally an increase of 2 mg Olsen-P/kg per 100 kg surplus P (SP)/ha in a sandy loam soil (Aulakh et al. Reference Aulakh, Garg and Kabba2007). Tang et al. (Reference Tang, Li, Ma, Hao and Li2008) also reported that Olsen-P in soil increased by 2·3–5·7 mg P/kg per 100 kg SP/ha in wheat–maize rotations in China. However, there is little information regarding the rate of P accumulation in soil for wheat–rice cropping systems, one of the most common agricultural production systems (used on 24 million ha globally and 10·5 million ha in China and South Asia alone). It provides staple grains for more than 480 million people, or about 0·08 of the world's population (Ladha et al. Reference Ladha, Dawe, Pathak, Padre, Yadav, Singh, Singh, Singh, Kundu, Sakal, Ram, Regmi, Gami, Bhandari, Amin, Yadav, Bhattarai, Das, Aggarwal, Gupta and Hobbs2003). Information on the rate of P accumulation in soil will also be useful for predicting Olsen-P dynamics in soils and optimizing P-fertilization in alternating wet and dry cropping systems.
The objectives of this study were to: (i) investigate grain yield trends when P fertilizer is applied or not and the contribution of soil indigenous P to yield in a wheat–rice cropping system over 14 years; (ii) quantify the partial factor productivity (PFP), agronomic efficiency (AE), internal efficiency (IE) and recovery efficiency (RE) of P fertilizer over 14 years; (iii) estimate the P fertilizer requirements for specific target yields; and (iv) characterize the relationship between SP and Olsen-P and predict the rate of P accumulation in soils.
MATERIALS AND METHODS
Experimental location, soil properties and climate
The site used in this study was located in Beipu, Chongqing, China at 29°48′N, 106°24′E and 266·3 m asl. Long-term mean annual precipitation is 1105·5 mm, with 0·78 typically occurring from April to September; mean annual air temperature and frost-free periods are 18·3°C and 330 days, respectively. The soil was a purplish soil (Chinese taxonomy) or Eutric Cambisol (FAO taxonomy) (Gong et al. Reference Gong, Chen, Shi, Zhang, Zhang, Zhao, Luo, Gao, Chao, Chao and Lei1999) with the following characteristics in the plough layer (0–200 mm): pH 7·7, 24·0 g organic matter/kg, 1·25 g total nitrogen (N)/kg, 0·67 g total P/kg, 21·1 g total potassium (K)/kg, 4·3 mg Olsen-P/kg, bulk density 1·38 g/ml and clay content (<0·002 mm) 268 g/kg. Local cultivars of wheat and rice were grown without fertilizer for 2 years before the experiment was set up in order to reduce any residual effect of previous fertilization and reach a relatively uniform fertility. The crop rotation was winter wheat grown from November to April followed by rice from May to August each year. September to October was the summer fallow period.
A randomized complete block design was used. The seven treatments investigated were: (1) Control (unfertilized), (2) N (nitrogen only), (3) NK (nitrogen and potassium), (4) NP (nitrogen and phosphorus), (5) NPK (nitrogen, phosphorus and potassium), (6) NPKM (nitrogen, phosphorus and potassium plus pig manure) and (7) NPKSt (nitrogen, phosphorus and potassium plus rice straw). All P and K fertilizers and 0·6 of the N fertilizer were applied as basal fertilizers prior to seeding for wheat and prior to transplanting for rice. The remaining N fertilizer was applied as a top dressing later during the crop-growing season. The pig manure and rice straw were applied each autumn before winter wheat seeding. The same amount of total N was applied each year for the N, NK, NPK, NPKM and NPKSt treatments. Inorganic fertilizer was the only N source for N, NK and NPK, while both inorganic fertilizer and pig manure contributed to the total N applied each year for NPKM, and inorganic fertilizers and rice straw for the NPKSt treatment. The same amount of inorganic P (or K) fertilizer was applied to the NP (or NK), NPK, NPKM and NPKSt treatments. Thus, the NPKM and NPKSt treatments received more P and K than the NK and NPK treatments, as manure and rice straw contributed additional P and K. Application rates of total N, P and K for inorganic fertilizers were 150 kg N/ha, 32·8 kg P/ha and 62·2 kg K/ha per crop each year from 1991 to 1996. The P and K fertilization was decreased to 26·2 and 49·8 kg/ha from 1997 onwards, while wheat and rice received 135 and 150 kg N/ha each year, respectively. Urea, superphosphate and potassium sulphate (K2SO4) were the fertilizer sources. The annual application rates of pig manure and rice straw were 22·5 and 7·5 t/ha, incorporated into the soil to a depth of 200 mm. The concentration of nutrients in pig manure ranged from 1·80 to 2·17 mg/kg (mean 1·96 mg/kg) for N, 0·60 to 0·81 (mean 0·70 mg/kg) for P and 1·60 to 1·88 (mean 1·75 mg/kg) for K.
Weeds were controlled by hand weeding and fungicides and insecticide were applied when required. Crops were harvested manually, close to the ground, using sickles and all harvested biomass was removed from the plots with little or no crop residue returned to the land. Grain yields were determined from the whole plot area. Grain samples were air-dried on concrete, threshed, oven-dried at 65°C to a uniform moisture level, and then weighed.
Soil and plant sampling and analysis
At the start of this study and before treatments were imposed, soil samples were collected from the plough layer (0–200 mm) in 1991. Soil samples from each treatment were collected annually from 1992 to 2005, c. 1–2 days after crop harvesting. An auger with an internal diameter of 50 mm was used for taking soil samples at five locations in each plot, which were mixed thoroughly. The fresh soil samples were air-dried, sieved through a 2·0 mm sieve and stored for analysis.
Soil samples were analysed for organic carbon (OC) (digestion method), available N (alkaline diffusion method), 0·5 m sodium bicarbonate (NaHCO3, pH 8·5)-extractable P (Olsen-P), 1 m ammonium acetate (NH4OAc)-extractable K and pH (in water at 1:2·5 solid:liquid ratio) following Page et al. (Reference Page, Millar and Keeney1982). Total N, P and K in soils were determined separately using micro-Kjeldahl digestion, colorimetric analysis and a dissolution-flame photometer (Page et al. Reference Page, Millar and Keeney1982).
The crop samples were finely ground to pass through a 0·15 mm sieve. To determine the P content, the plant samples were digested with acidic peroxide (H2SO4–H2O2) following the method of Jackson (Reference Jackson1958) and concentration in the digesting solution was measured using the molybdenum-blue colorimetric method (Page et al. Reference Page, Millar and Keeney1982).
Calculations
The contribution of P fertilizers to crop yield increase (PI) was calculated as the yield difference between NPK and NK treatments divided by yield from NK treatment as in eqn (1). The contribution of soil indigenous P to yield (PS) was calculated from the relative yield of NK to NPK treatment as in eqn (2):


where PI is the crop yield increase due to P fertilizer application, PS is the contribution of soil indigenous P to yield, Y P is the grain yield with P fertilizer application (kg/ha), and Y 0 is the grain yield without P fertilizer applied (kg/ha).
The amount of crop P uptake was calculated based on the grain and crop residue yield and their corresponding P concentrations. Based on the amount of P fertilizer applied and crop P uptake over the 14 years, the PFP (Cassman et al. Reference Cassman, Gines, Dizon, Samson and Alcantara1996), AE (Dobermann Reference Dobermann2007), IE (Witt et al. Reference Witt, Dobermann, Abdulrachman, Gines, Wang, Nagarajan, Satawatananont, Son, Tan, Tiem, Simbahan and Olk1999), RE over 14 years (Dobermann Reference Dobermann2007), PPB and the SP (the P input–output balances, i.e. the amount of fertilizer applied in excess of crop removal) were calculated as follows:






where Y is the grain yield (kg/ha), Y P is the grain yield with applied P fertilizer (kg/ha), Y 0 is the grain yield without P fertilizer applied (kg/ha), F P is the amount of P fertilizer applied (kg P/ha) and U P is the total P uptake by crops (grain and straw) (kg P/ha) and U 0 is the total P uptake by the crops without P applied (kg P/ha).
Statistical analysis
In order to investigate the differences in crop grain yield, P content in grain and straw, crop P uptake, the PFP, AE and IE in different treatments, data over the 14 years were pooled together for analysis of variance (ANOVA) as a randomized block design (Cochran & Cox Reference Cochran and Cox1957). Correlation analysis was used for determining the relationships between the grain yields, the contribution of soil indigenous P to yield and the cultivation time, between the P input–output balance (SP) and Olsen-P. All statistical analyses were conducted with the software package SAS 9.1 (SAS 2004) and a 0·05 probability level was adopted.
RESULTS
Yield responses to P fertilizers
The mean annual grain yields over 14 years from the Control treatment were 1·32 t/ha for wheat and 3·66 t/ha for rice, which represented 0·44 and 0·54 of yields from NPK treatments (Table 1), respectively. For all treatments, the yield was in decreasing order of NPKM=NPKSt>NPK>NP>NK>N>Control for both crops.
Wheat and rice yield responses to fertilizer treatments during the 14-year experimental period

* s.e.d. is the standard error of difference in mean to compare crop yields with different fertilizer treatments in a row. Degree of freedom (d.f.) is 96 for both wheat and rice.
† PI is the contribution of P fertilizers to crop yield increase, i.e. grain yield differences between NP and N treatments divided by N grain yield, and NPK and NK treatments divided by NK grain yield.
‡ PS is the contribution of soil indigenous P to yield, i.e. the yield ratio for N to NP treatments and NK to NPK treatments.
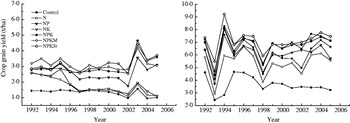
The wheat yield from plots receiving P (NP, NPK, NPKM and NPKSt treatments) increased over the 14 years of the study (Fig. 1). The increase is significant (P<0·05) at a rate of 65·7 kg/ha per year in the NPKSt treatment. In contrast, the wheat yield from plots receiving no P decreased (P<0·05) over time at rates of 31·2, 103 and 106 kg/ha per year for the Control, N and NK treatments, respectively. However, time had no significant effect on rice yields in any treatment (Fig. 1).
Changes in wheat and rice grain yield over 14 years.

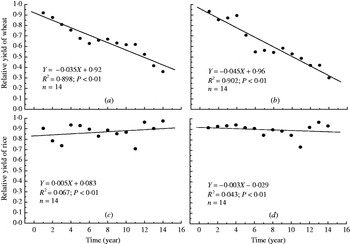
The NP fertilizer increased wheat yield by 53% over N alone, and NPK by 65% over NK treatments, over the 14 years (Table 1), while the increases seen for rice were not significant. The contribution of P fertilizer to yield increase was greater for wheat than rice. However, the contribution of soil indigenous P to yield, i.e. the relative yields of wheat from NP and N treatments, and NPK and NK treatments, were 25 and 33% lower than the corresponding values for rice. Furthermore, the relative yields from NP and N treatments, and NPK and NK treatments for wheat decreased significantly over cultivation time at an average rate of 3·5 and 4·5% per year (Fig. 2). However, there was no significant effect of time on the relative yields for rice during the cultivation period (Fig. 2).
The contribution of soil indigenous P to crop yield for wheat and rice over 14 years of cultivation. (a) and (c) show the relative yield of N to NP treatments, (b) and (d) show the relative yield of NK to NPK treatments.

Phosphorus content and uptake
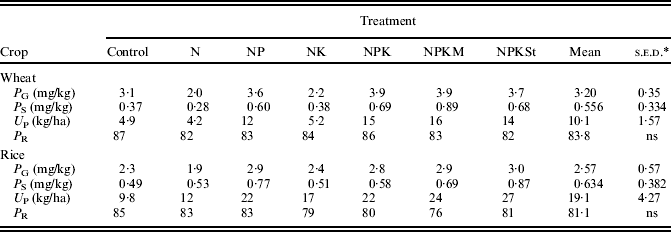
The P concentrations for wheat and rice ranged from 1·87 to 3·91 g P/kg grain and 0·28 to 0·89 g P/kg straw for all treatments (Table 2). The P concentration for the N and NK treatments were below 2·5 g P/kg in both wheat and rice grain, significantly lower (P<0·05) than the mean values of 3·79 (wheat) and 2·88 g P/kg (rice) from the NP, NPK, NPKM and NPKSt treatments.
Phosphorus concentrations in crop grains and straw and phosphorus uptake averaged over 14 years
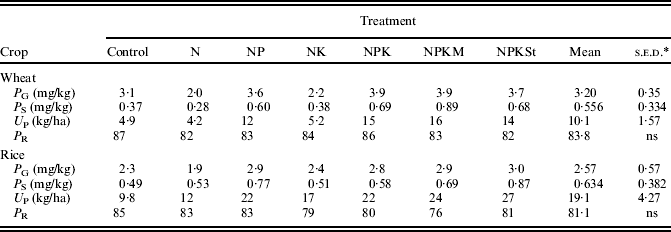
P G and P S are the P concentrations from crop grains and straw, respectively. U P is the crop P uptake. P R is the ratio of P uptake from crop grain to whole crop aboveground biomass.
* s.e.d. is standard error of difference in mean to compare different fertilizer treatments in a row. Degree of freedom (d.f.) is 96 for both wheat and rice. ns: not significant (P>0·05).
The mean P uptake from the Control, N and NK treatments was 4·8 kg P/ha for wheat (grain+straw) and 13·2 kg P/ha for rice, which were 66 and 44% lower than treatments receiving P fertilizer (NP, NPK, NPKM and NPKSt treatments). The P in grains on average accounted for 84 and 81% of total P uptake for wheat and rice, respectively (Table 2).
Phosphorus efficiency
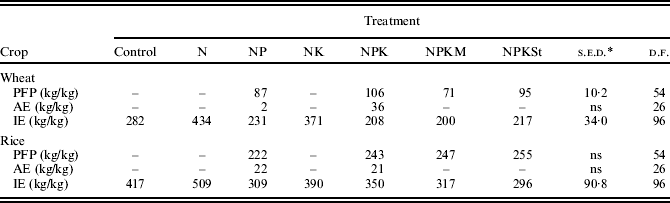
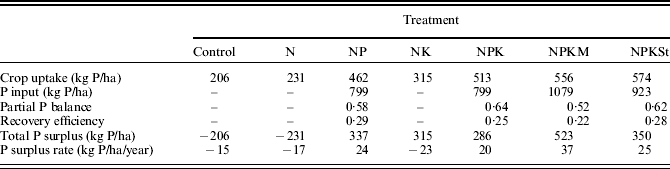
The PFP of P fertilizer for wheat ranged from 80 to 177 kg grain/kg P fertilizer, with an average of 106 kg grain/kg P fertilizer in the NPK treatment during the cultivation period (Table 3). The mean PFP for wheat from NP and NPKM treatments was 18 and 33% lower than in the NPK treatment. The mean PFP for rice was 222–255 kg grain/kg P fertilizer with an average of 242 kg grain/kg P fertilizer. However, the mean AE over the 14-year period were 31·9 and 21·3 kg grain/kg inorganic P fertilizer for wheat and rice, respectively. The IE in soils receiving P fertilizer ranged from 200 to 231 kg grain/kg P uptake with an average of 214 kg grain/kg P uptake for wheat and from 296 to 350 kg grain/kg P uptake with an average of 318 kg grain/kg P for rice. The mean value of IE without P application (Control, N and NK treatments) was 362 kg grain/kg P uptake for wheat and 439 kg grain/kg P uptake for rice, which was 69 and 38% higher, respectively, than for wheat and rice receiving P fertilizer (Table 3). The PPB over the 14-year period was 0·58, 0·52, 0·62 and 0·64 for NP, NPKM, NPKSt and NPK treatments with an average of 0·59 in the wheat–rice cropping system, while the RE of P fertilizer was from 0·22 to 0·29 (mean 0·26).
Partial factor productivity, AE of P fertilizer and IE averaged over 14 years
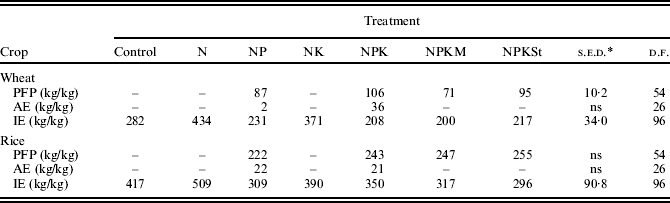
The PFP (kg grain/kg P fertilizer) is the partial factor productivity of P fertilizer from the ratio of grain yield to the applied P rate. The AE (kg grain/kg P fertilizer) is agronomic efficiency of yield response to P fertilizer divided by the amount applied. The IE (kg grain/kg P uptake) is the internal efficiency calculated as the ratio of grain yield to the total crop P uptake.
* s.e.d.: standard error of difference in mean to compare different fertilizer treatments in a row. d.f.: degree of freedom. ns: not significant (P>0·05).
The P input–output balance
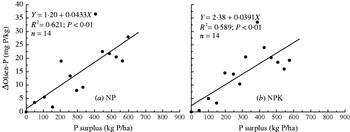
As indicated by the negative P surplus values in the plough layer (0–200 mm), crop uptake caused a net P loss of 14·7, 16·5 and 22·5 kg P/ha per year from the Control, N and NK treatments but a net gain of 20·4, 24·1, 25·0 and 37·3 kg P/ha per year for the NPK, NP, NPKSt and NPKM treatments, respectively (Table 4). This was further confirmed by the positive linear relationship between the Olsen-P level in soil and the SP (Fig. 3). The present results showed that for every 100 kg P/ha P surplus, there would be an average 4·33 and 3·91 mg/kg increase in Olsen-P in soil for NP and NPK treatments, respectively.
Responses of soil Olsen-P to P surplus (amount of fertilizer applied in excess of crop removal) across the treatments of (a) NP and (b) NPK. (Δ Olsen-P=Olsen-P i−Olsen-P 0, where i=1, 2 … 14 years; P 0 is the initial Olsen-P in soil).

Recovery efficiency and mass balance of P in a wheat–rice cropping system over 14 years
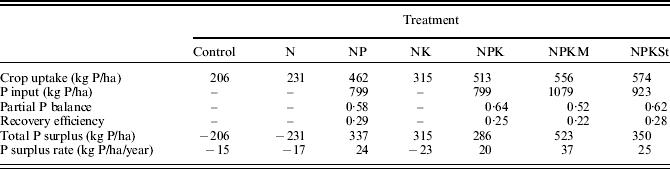
The values of crop uptake, P input and total P surplus are totals over 14 years. The PPB is the ratio of the sum of crop P uptake to the amount of the sum of P input over the 14 years. The RE is calculated as the increase in the sum of crop P uptake caused by the application of P fertilizer, divided by the amount of the sum of P input over the 14 years.
DISCUSSION
The present results over 14 years indicate that the relative yield of the Control (unfertilized) to NPK treatments was 0·44 for wheat and 0·54 for rice, which implies that the contribution of P fertilizer application to yield increases is greater for wheat than rice. Thus, a greater portion of fertilizer, especially P fertilizer, should be applied to wheat rather than rice production in a wheat–rice rotation. Based on the trends of relative yields from the treatments with and without P fertilizer, the contribution of soil indigenous P to yield decreased significantly over time for wheat, but not for rice (Fig. 3). In other words, wheat was more responsive to P fertilization than rice.
The greater dependence of wheat on P fertilization is in part due to the lower soil P supplying capacity during the early growing season when temperature is lower, leading to slower mineralization to replenish the P in the available pool consumed by growing plants (Gardner & Jones Reference Gardner and Jones1973; Sánchez & Boll Reference Sánchez and Boll2005). In contrast, soil P supplying capacity is higher during the rice growing season, when temperatures are higher, and soil indigenous P was found to have a greater contribution during rice production (Table 1). Additionally, the P availability is enhanced as Fe3+ is reduced during flooding with rice cultivation (Willett Reference Willett, Deturck and Ponnamperuma1991).
The amount of P in grains accounted for 84% of total P uptake (grain and straw) for wheat and 81% for rice. The result is similar to the 81% in wheat grain reported by Tang et al. (Reference Tang, Li, Ma, Hao and Li2008) from long-term wheat–maize cropping systems across five experimental sites located in China. The present data suggest a similar grain to total P uptake ratio in rice grains as in wheat grains.
The PFP of wheat in NPK treatment was higher than those in the NP and NPKM treatments. This difference was probably due to both nutrient imbalances in the NP treatment and excessive P fertilization in the NPKM treatment. The wheat PFP is in the range of 80·2–177 kg grain/kg P fertilizer, which corresponds to grain yield of 2·6–4·0 t/ha in NPK treatments. The relatively low PFP for wheat (80 kg grain/kg P fertilizer) might be due to P applications in excess of the optimal rates, which resulted in higher levels of P in the soil test. For rice, the PFP of 193–283 kg grain/kg P fertilizer could be achieved under balanced N, P and K nutrition at yield levels of 6–8·0 t/ha. The future challenge will be to increase PFP at constant or increased grain yield levels with balanced N, P and K nutrition and improved crop management.
To produce 1 t of grain, wheat requires 2·7–5·8 kg P (Liu et al. Reference Liu, Yu, Liu and Konijn2006; Tang et al. Reference Tang, Li, Ma, Hao and Li2008). This is reconfirmed in the present long-term experiments with wheat–rice rotation systems, the results of which showed that c. 4·3–5·0 kg P/ha (mean 4·7 kg P/ha) was required to produce 1 t of wheat grain. The yields in soil with only N and K fertilizer were c. 1·8 t/ha during the cultivation period. If the target yields of wheat are 3·5 t/ha, this would require a P fertilization rate of 20–24 kg P/ha at the mean level of AE achieved in this study of 0·36 from the NPK treatment. For rice, previously reported values ranged from 1·8 to 11 kg P/t grain yield (Goswami & Banerjee Reference Goswami, Banerjee and Brady1978; Dobermann et al. Reference Dobermann, Cassman, Sta. Cruz, Adviento and Pampolino1996; Witt et al. Reference Witt, Dobermann, Abdulrachman, Gines, Wang, Nagarajan, Satawatananont, Son, Tan, Tiem, Simbahan and Olk1999). Similarly, according to this study, in order to produce 1 t rice grain, the amount of P uptake needs to be 2·8–3·4 kg. The rice yields in soil with only N and K fertilizer were c. 6 t/ha. If the target yield for wheat is 8 t/ha, then this would require a P fertilization rate of 26–32 kg P/ha at the mean level of AE of 0·21 from the NPK treatment. This suggests that in order to produce 11·5 t grain/ha (3·5 t/ha for wheat and 8 t/ha for rice), the rate of P fertilization would be 46–56 kg P/ha based on the current levels of soil fertility. However, different soils are expected to respond differently with respect to agronomic and fertilizer use efficiency of P fertilizer. For soils with different characteristics, the values will need to be determined.
This study with wheat–rice cropping indicates that for every 100 kg SP/ha, there would be an average 3·95 mg/kg (4·33 and 3·91 mg/kg for NP and NPK treatments) increase in Olsen-P in soil, which is consistent with the values reported in the literature of 2–6 mg/kg (Shepherd & Withers Reference Shepherd and Withers1999; Aulakh et al. Reference Aulakh, Garg and Kabba2007; Tang et al. Reference Tang, Li, Ma, Hao and Li2008). Routine soil analysis for estimating P fertilizer requirements can presumably be extended to time intervals of several years, if rough estimates of the PPB are available.
We thank the National Basic Research Program (2005CB121102), the Key Technologies R&D Program of China (2006BAD05B01) and the Special Fund for Agriculture Profession (200803030) for providing funding for this work and all scientists associated with National Long-term Monitoring Network of Soil Fertility and Fertilizer Effects in Chongqing for supplying the historic dataset for the long-term experiments.