INTRODUCTION
Tree growth underlies population dynamics (Clark & Clark Reference CLARK and CLARK1999), species interactions (Swetnam & Lynch Reference SWETNAM and LYNCH1993), carbon sequestration (Caspersen et al. Reference CASPERSEN, PACALA, JENKINS, HURTT, MOORCROFT and BIRDSEY2000) and species responses to climate change (Clark Reference CLARK2002, Reference CLARK2004; Clark et al. Reference CLARK, PIPER, KEELING and CLARK2003). Nevertheless, reliable estimates of tree growth are limited, as data are time consuming to collect, and there are challenges associated with inference (Clark et al. Reference CLARK, WOLOSIN, DIETZE, IBANEZ, LADEAU, WELSH and KLOEPPEL2007). Annual growth rates can be stage-dependent (Clark & Clark Reference CLARK and CLARK1999), temporally correlated (Clark et al. Reference CLARK, WOLOSIN, DIETZE, IBANEZ, LADEAU, WELSH and KLOEPPEL2007), and spatially correlated, primarily through competition (Canham et al. Reference CANHAM, PAPAIK, URIARTE, MCWILLIAMS, JENKINS and TWERY2006, Condit et al. Reference CONDIT, ASHTON, BAKER, BUNYAVEJOHEWIN, GUNATILEKE, GUNATILLEKE, HUBBELL, FOSTER, Itoh, LAFRANKIE, LEE, LOSOS, MANOKARAN, SUKUMAR and YAMAKURA2000, Hubbell et al. Reference HUBBELL, FOSTER, O'BRIEN, WECHSLER, CONDIT, HARMS, WRIGHT and LOO DE LAU1999, Reference HUBBELL, AHUMADA, CONDIT and FOSTER2001; Webster & Lorimer Reference WEBSTER and LORIMER2005). Tree census data show considerable individual variation in growth, variation inherent in the process of growth, as well as temporal and spatial variation in the covariates affecting growth (Clark & Clark Reference CLARK and CLARK1999, Clark et al. Reference CLARK, WOLOSIN, DIETZE, IBANEZ, LADEAU, WELSH and KLOEPPEL2007, Condit et al. Reference CONDIT, ASHTON, BAKER, BUNYAVEJOHEWIN, GUNATILEKE, GUNATILLEKE, HUBBELL, FOSTER, Itoh, LAFRANKIE, LEE, LOSOS, MANOKARAN, SUKUMAR and YAMAKURA2000, Hubbell et al. Reference HUBBELL, FOSTER, O'BRIEN, WECHSLER, CONDIT, HARMS, WRIGHT and LOO DE LAU1999). Additionally, as with any long-term census, data are often missing and observation errors vary due to changes in protocol.
Clark et al. (Reference CLARK, WOLOSIN, DIETZE, IBANEZ, LADEAU, WELSH and KLOEPPEL2007) introduced a hierarchical Bayesian approach to modelling tree growth that accommodates uncertainty in process, data and parameters. The model also allows interpolation of missing data through predictive distributions that reflect uncertainty both in the measurement of growth, and the growth process, with constraints based on known biological information such as the fact that diameter increment growth cannot be negative (Clark et al. Reference CLARK, WOLOSIN, DIETZE, IBANEZ, LADEAU, WELSH and KLOEPPEL2007), growth generally depends on size and growth rate in the previous times step (Wyckoff & Clark Reference WYCKOFF and CLARK2002), and it may vary from year to year and according to individual effects (Clark et al. Reference CLARK, WOLOSIN, DIETZE, IBANEZ, LADEAU, WELSH and KLOEPPEL2007).
Here, we modify this approach to meet the challenges of tropical tree data sets, particularly the lack of consistency in the height at which trees are measured due to growing buttresses. Growth increments corresponding to years where the height of measurement has changed may be simply omitted from analyses (Feeley et al. Reference FEELEY, WRIGHT, NUR SUPARDI, KASSIM and DAVIES2007). Alternatively, where at every time-step diameters at several points of measurement are taken on potentially problematic trees, so that no growth increments are lost (Clark et al. Reference CLARK, PIPER, KEELING and CLARK2003), suites of measurements within an individual may be from several different heights. Both issues render problematic the inference of individual growth trajectories. However, it is of particular importance to capture these observations, as in two of the major tropical tree data-sets a strong signal of declining growth through time has been detected (Clark Reference CLARK2004, Clark et al. Reference CLARK, PIPER, KEELING and CLARK2003, Feeley et al. Reference FEELEY, WRIGHT, NUR SUPARDI, KASSIM and DAVIES2007). If there is covariance between time and tree size (Feeley et al. Reference FEELEY, WRIGHT, NUR SUPARDI, KASSIM and DAVIES2007), or time and height of measurement, or time and individuals present in the population, there is potential for the perceived decline over time to reflect biases in the estimation techniques that neglect the many levels of variation. Here we develop a method that integrates all sources of information to formally model measurements taken at several heights in the presence of uncertainty in measurements (Clark & Bjornstad Reference CLARK and BJORNSTAD2004). We then show how this framework can be extended to allow inference when long or uneven census intervals are considered, without neglecting the cumulative effects of variance in growth through time that will occur as growth is inherently stochastic.
In the following methods section we first introduce the two methods, then briefly outline the data-sets used for this analysis. The resulting patterns of growth through time are then presented. We conclude by discussing the insights available from our method, and how our results relate to previous work on this topic.
METHODS
Data modelling
Data consist of repeated diameter measures on individuals through time associated with a height of measurement. The model is developed to maximize the support drawn from the full dataset while emphasizing information associated with specific trees and years. Relationships between different model components are specified as conditional distributions, allowing estimation using a Gibbs sampling approach. Specifically, our approach consists of two steps. First, we specify an observation model to convert diameter observed at any height into a ‘true’ diameter at 1.3 m (allowing for measurement error in our observations). Second, we specify a growth model for diameter growth at 1.3 m to allow direct comparison among individuals and years.
For the first step, for every individual for every year, we model a diameter at a height of 1.3 m as a latent variable denoted D i,1.3,t. To infer this value, we use information from observations taken at different heights, and link them using a tapering model, defined by a parameter α, and a model describing observation error (measurement error). If D (o)i,h,t is the diameter in cm of tree i measured at height h (o)i,h,t in m in year t, we define

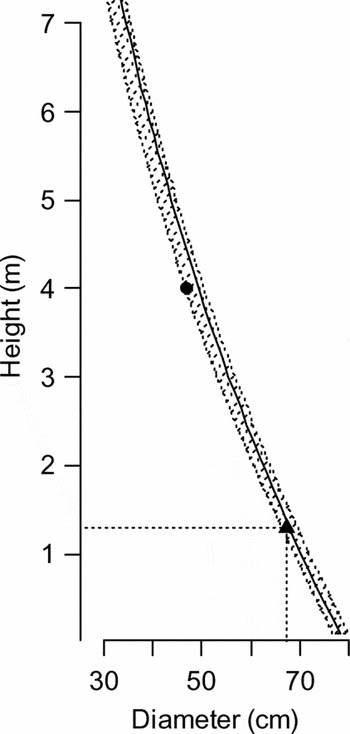
where the (o) superscript indicates an observation, α is the tapering parameter, and variance w captures Gaussian observation error. The concept is illustrated in Figure 1. Since exp [α(h (o)i,h,t−1.3] indicates the proportion by which diameter is decreased at increasing heights, the value in brackets will need less than 1, i.e. α will be less than 1. Although proportionate taper (summarized by the constant α, i.e. the tapering parameter) may change during the course of ontogeny, only large trees generally experience shifts in measurement height, so this assumption of a constant exponent will minimally affect results. Trees where several measurements of diameter at different heights are available within the same year will contribute directly to calibrating α. For years where measurements are only available at one height per individual, α will be informed indirectly by all observations.
Illustration of the model for the data observation process (Eqn. 1). Diameter measurements are made at a range of heights. Here one such is shown by the black circle. We wish to identify a relationship between height and diameter like that shown by the cross-hatched area, defined by a tapering parameter α, so that we can obtain an estimate of diameter at the same height of 1.3 m for all trees, shown here by the black triangle and dotted lines. The growth model (Eqn. 2) can then be applied across the data-set to diameter values at a common height of 1.3 m. For a certain number of trees, more than one measurement is available at a particular census (Table 1), so that the tapering relationship can be directly calibrated. For others, the information is borrowed across the entire data set. Results shown here correspond to posteriors for α for Luehea seemannii and one individual measurement from that data-set. The cross-hatched area incorporates uncertainty in the tapering parameter, α, and uncertainty around the observed data−point due to observation error, w.

To complete the observation model, we define priors for each of the parameters, α and w. A parameter's prior is a probability density function that represents prior knowledge about what the parameter's value or range of values should be. For example, if previous analyses indicate that measurement error is of 1 mm then we would centre the probability density function for w narrowly around 1, equivalent to specifying an ‘informative prior’. If we have no information, we will use uninformative priors with broad distributions. The forms of the prior distributions used in the full sampling procedure are normal for α and conjugate inverse gamma for w.
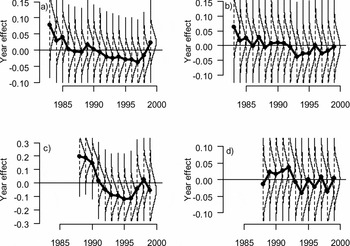
To achieve the second step, we develop a model of growth based on Clark et al. (Reference CLARK, WOLOSIN, DIETZE, IBANEZ, LADEAU, WELSH and KLOEPPEL2007) that exploits the information on overall tree growth, with a mean for the full population β 0, random individual effects βi (how tree i differs from the rest of the population) and fixed year effects βt (there can be shared year-to-year variation due to, say, climate). We model growth increments at a height of 1.3 m as,

where Xi,t is the diameter increment added between year t and t+1 at a height of 1.3 m. This is a linear equation with deterministic components defined by population mean growth rate β 0, random individual effect βi, year effect βt and process error ɛi,t,



‘Process error’ ɛi,t is the extent to which main effects (mean, individual and year) fail to describe diameter increment. Prior distributions are conjugate normal and inverse gamma respectively,
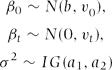
For random individual effects, the variance has the prior

Use of the inverse gamma prior for variances is discussed in Clark (Reference Clark2007) and Clark et al. (Reference CLARK, WOLOSIN, DIETZE, IBANEZ, LADEAU, WELSH and KLOEPPEL2007). The beginning of the study is defined as the year when diameter data were first collected for the individual at a particular height, ti,h. We define the end of the study Ti,h as the time when the most recent diameter data were collected or individual i dies, whichever comes first. For every height, we model the data on a tree-by-tree basis for all years t between ti,h and Ti,h.
The result of sampling from the full model is that the latent state variable D i,1.3,t, corresponding to diameter measured at a height of 1.3 m, is conditionally dependent on observations that might be available for diameter at a range of heights, D (o)i,h,t, and on the unknown states D i,1.3,t+1 and D i,1.3,t−1, which will also be modelled. A full discussion of this structure is contained in Clark et al. (Reference CLARK, WOLOSIN, DIETZE, IBANEZ, LADEAU, WELSH and KLOEPPEL2007). Non-independence of data is accommodated by the stochastic treatment of the underlying process. Here is the joint probability for a single tree year (conditioned on the rest of the model):
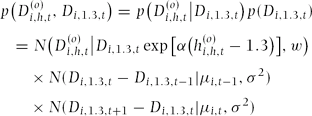
The densities in the last line are, respectively, the diameter data model, which includes a parameter describing tapering (α) to allow for data from several different heights to enter inference, and the process model for growth from t−1 to t and from t to t+1. Stochasticity in our process model includes process error and random effects (Eqns 2–5).
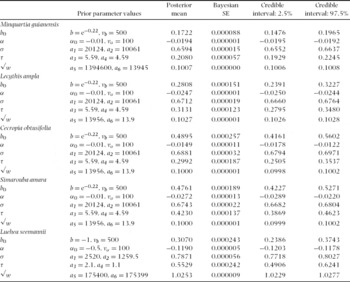
We now have specified the full model, including the form of the prior distributions for all parameters, and the conditionals describing how the different components are interrelated. The final step before applying the full model to data is to specify values for parameters of the prior distributions, based on knowledge of the approximate ranges of variability in measurements. Take for example the observation error parameter, w. Re-measurement in the La Selva database yields an average difference between measurements of 0.03 cm, with a maximum of 0.1 cm (Clark & Clark Reference CLARK and CLARK2006). We could set w = 0.01 to reflect a belief that observations are normally distributed around the ‘true’ value of diameter with a variance of 0.01 (which more or less captures the characteristics above from Clark & Clark Reference CLARK and CLARK2006). However, we do not know for sure that w = 0.01, and wish to infer its value using both information from the data and information based on our prior beliefs (e.g. that it should be 0.01). We therefore define a prior distribution for w, taken as conjugate inverse gamma, e.g.

where the parameters a 5 and a 6 will be chosen so that the mean of this prior distribution is around 0.01, and the variance around this mean reflects how certain we are that measurement error is close to this value vs. how much the data can define it. To weight our belief about the mean value to be a hundred times the weight of the data, we can specify
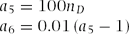
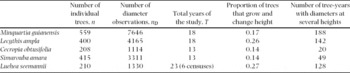
where nD is the number of diameter observations (Table 1 and Table 2, see Clark et al. Reference CLARK, WOLOSIN, DIETZE, IBANEZ, LADEAU, WELSH and KLOEPPEL2007 for details of weighting). For the BCI database, re-measurement information given in Chave et al. (Reference CHAVE, CONDIT, AGUILAR, HERNANDEZ, LAO and PEREZ2004) suggests we use a prior mean for observation error variance of 1, and we use the same weighting scheme as in Eqn. 10.
Data available for each of the five species. Data from La Selva (species in the first four rows) is much more detailed partly as measurements were taken yearly rather than every 5 y.

Prior parameters (calculated using the text and Table 1) and the posterior means, Bayesian standard errors, and credible intervals for the mean growth increment, μ (cm), the tapering parameter, α, the process error, the individual standard deviation τ, and the observation error standard deviation √w.

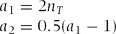
For process error σ 2, we use a prior mean of 0.5, and weight it to be twice the number of tree years and heights, n T = ∑i,h (T i,h − t i,h). This is equivalent to restricting possible values of σ 2 to be quite close to 0.5, so that the process error will generally be large, to avoid excessive smoothing,
Other priors are non-informative, e.g. we do not introduce prior beliefs into their modelling. The prior distribution for mean growth rate is normally distributed with mean b = 0.8, i.e. a prior mean growth rate of 0.80 cm y−1; and v 0 = 500 where this large variance reflects our lack of prior certainty. Inference about this parameter will consequently be chiefly determined by the data. The prior on the tapering parameter α has mean α 0 = −0.1 and variance vα = 100, which is likewise weak, so that data will dominate. The prior for the variance of random effects τ 2 has mean set to 1, and weighted roughly 0.01 of the data. This is accomplished with a 3 = n/100, where n is the number of trees (Table 1 and Table 2). Year effects βt have prior mean zero and vt = 1.
Analysis of the model is accomplished by Gibbs sampling (Gelfand & Smith Reference GELFAND and SMITH1990), implementation of which is discussed in the Appendix 1. The model output will be a sample from the posterior distributions of all parameters and of latent diameters for every individual at every time-step. Posterior distributions are density functions defined by the product of the prior distributions and conditional distributions defining the observation and the process model. Posterior distributions were not influenced by the mean values selected for β 0, τ 2 and βt because priors were weak. Increments are sampled from truncated normal distributions to ensure that they remain positive.
Extension for uneven sampling intervals
For some data-sets, measurements are taken at intervals longer than a year, in which case, there is no information for growth in individual years. Furthermore, intervals may be uneven, further complicating estimation of yearly growth increments. To model data in this case, we can explicitly model the differing time lags. We define the multi-year increments as ΔX i,t, and Δt as the number of years separating consecutive censuses, such that

Assuming that variation accumulates as white noise (variance scales linearly with Δt), using the same notation as above for μi ,t (i.e. growth increment in one time-step) and σ 2 (process error for one time-step) this is distributed as

which can be sampled directly. This formulation captures the fact that variance will increase with time elapsed. The joint probability for a single tree becomes
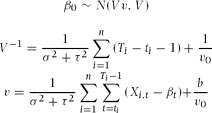
where n is the number of trees and ti and Ti are the first and last measurements for individual i. Random individual effects are sampled from
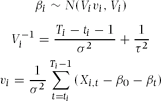
Year effects are sampled from


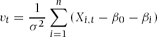
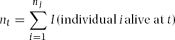
where I(A) is the indicator variable equal to one, when event A is true, and zero, otherwise. All year effects are updated simultaneously, and we impose a sum-to-zero constraint on the year effects by subtracting the mean at each Gibbs step. The tapering parameter is sampled indirectly using a Metropolis–Hastings step, from
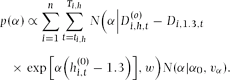
Variance parameters are all directly sampled from inverse gamma distributions. These are
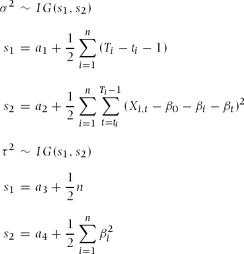
Observation errors on diameter are sampled from



where {TDi} is the set of diameter observations on tree i.
We do not prove convergence, but extensive simulation indicates that the algorithm does converge to appropriate estimates. The latent diameter states were initialized by interpolation, subject to the constraint that there can be no decreasing diameters. The latent growth rates are initialized as the differenced initial diameter series.
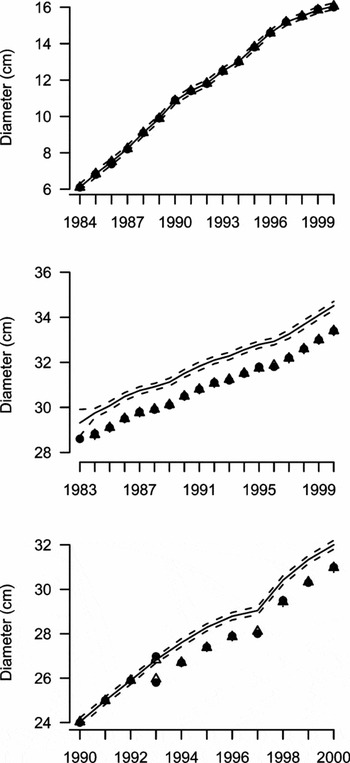
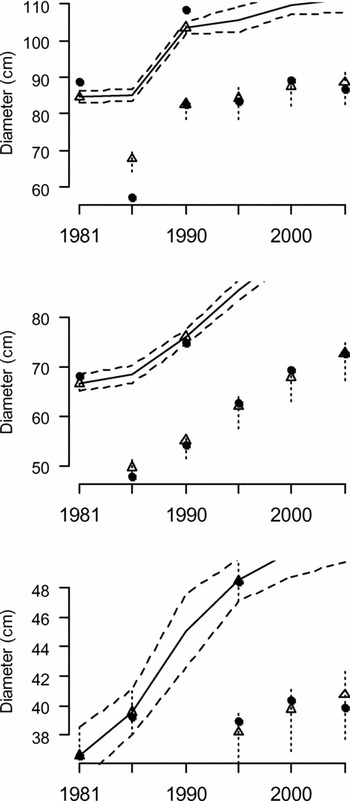
For the Metropolis steps in the Gibbs sampler (e.g. updating latent diameters for the first time step, Di, 1, latent diameter increment values, Xi ,t, and updating the tapering parameter, α) we generated candidates as random normal deviates around current parameter values, or time-series estimates, and accepted or rejected based on the Metropolis–Hastings ratios. We chose variances for these sampling distributions to obtain acceptance rates of between 0.1 and 0.4. The Gibbs sampler was run 500 000 iterations to insure convergence and then run an additional 500 000 iterations to obtain posterior estimates. Because of the large number of estimates for most species, we did not retain all estimates each for diameter and growth. Rather, we retained the sums and the sums of the squared diameter and log growth estimates from every twentieth Gibbs step. Because both variables were approximately Gaussian, 95% credible intervals were calculated as ± 1.96 standard deviations, which came, in turn, from first and second moments. These are the intervals shown in Figures 1 and 2. For all other parameters credible intervals are obtained as percentiles of the Gibbs output (Table 2).
Appendix 2
For the second model, which includes varying time increments, the full conditional distribution is
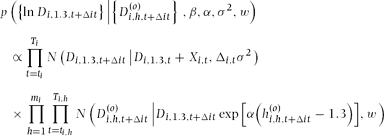
As above, a Metropolis sample from this distribution begins with a proposal for the first diameter value from a lognormal density that is centred on the first observation. Then all diameter increments are proposed from a truncated normal distribution (to ensure that they are positive) for the years in which individuals were alive and included in the study. Proposals are accepted on a tree-by-tree basis using the likelihood above. The conditional distribution of average growth increments in one time step Xi for individual i is
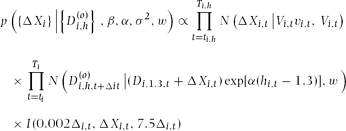
where I is the indicator function, and insures that growth increments are contained between a chosen lower bound 0.002 cm y−1; and an upper bound of 7.5 cm y−1, and
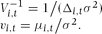
The solutions for these conditional distributions are provided in Clark (Reference Clark2007). For the overall mean growth rate, the conditional posterior (for simplicity not integrated over random effects), is

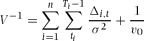

where n is the number of trees and ti and Ti are the first and last measurements for individual i, and ΔXi ,t denotes the modelled increment obtained from Δ time steps, as above. Random individual effects are sampled from

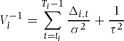
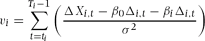
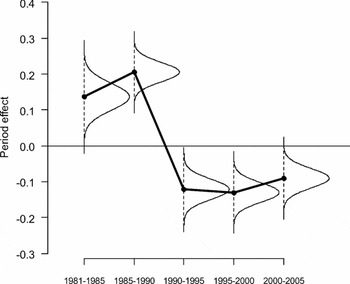
As year effects are modelled above, here we can model equivalent period effects. As there is overlap with the census intervals considered, these period effects are not confounded with the census intervals, and are identifiable. They can be sampled from

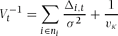

We impose a sum-to-zero constraint on the period effects by subtracting the mean at each Gibbs step.
The tapering parameter, and observation error variance is sampled as above. Variance parameters are all directly sampled from inverse gamma distributions. These are

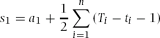



The Gibbs sampler was run as is detailed above.