I. INTRODUCTION
High-entropy alloys (HEAs), also known as complex concentrated alloys, have generated a significant interest in the scientific community because of their unique microstructures and excellent mechanical properties.Reference Yeh, Chen, Lin, Gan, Chin, Shun, Tsau and Chang1–Reference Diao, Feng, Dahmen and Liaw7 Recently, the development of a specific class of HEAs using refractory elements has been interest amongst the researchers for their potential use in high temperature structural applications. These refractory high-entropy alloys (RHEAs) are based on a body-centered cubic (BCC) crystal structure and may include ordered B2 and/or Laves phases.Reference Senkov, Scott, Senkova, Miracle and Woodward8–Reference Senkov, Senkova, Woodward and Miracle13 These alloys exhibit high temperature properties that are competitive with the current Ni-based superalloys. For example, in equiatomic NbMoTaW and VNbMoTaW alloys, a compressive strength over 400 MPa has been achieved at 1600 °C.Reference Senkov, Wilks, Scott and Miracle10 The density of these alloys was aimed to reduce by replacing high-density refractory elements like W and Ta, by low-density elements such as V, Cr, Mo, Nb, Ti, and Al.Reference Senkov, Senkova, Woodward and Miracle13–Reference Senkov, Senkova and Woodward16,Reference Stepanov, Shaysultanov, Salishchev and Tikhonovsky18,Reference Stepanov, Yurchenko, Sokolovsky, Tikhonovsky and Salishchev19 Some of these low-density RHEAs show high temperature strengths superior to Ni-based superalloys and Fe-based steels.Reference Gorsse, Miracle and Senkov20 Unfortunately, most of the RHEAs suffered from a good balance of properties like reasonable RT ductility and good oxidation.Reference Senkov, Isheim, Seidman and Pilchak21 Recent developments in RHEAs have included addition of Al as an alloying element, but with a lower concentration as compared to the principal elements. Al addition, apart from density reduction, is known to be beneficial for high temperature properties, for example, by forming coherent gamma prime (Ni3Al) precipitates in Ni-based superalloys leading to enhanced strength and creep resistance.Reference Duhl, Tien and Caulfield22 Addition of Al can also improve oxidation and corrosion resistance by forming a protective oxide layer. In HEAs based on 3-d transition elements like CoCrFeNi and CoCrFeMnNi, progressive Al addition can form hard intermetallic ordered precipitated (L12, B2) leading to a significant increase in strength.Reference Gwalani, Soni, Lee, Mantri, Ren and Banerjee26–Reference Choudhuri, Gwalani, Gorsse, Mikler, Ramanujan, Gibson and Banerjee28
Al addition to some of the RHEAs results in a mixture of two BCC phases that form a very fine, interwoven basket weave-like nanophase microstructure.Reference Senkov, Woodward and Miracle15–Reference Senkov, Jensen, Pilchak, Miracle and Fraser17,Reference Jensen32 Higher resolution characterization revealed that this two-phase microstructure resembles that of nickel or cobalt-based superalloys.Reference Senkov, Woodward and Miracle15,Reference Han, Luan, Liu, Chen, Li, Shao and Yao24,Reference Jensen32 However, unlike γ(fcc) + γ′ (ordered L12 precipitates) microstructure in case of Ni-based superalloys, these RHEAs exhibit a microstructure consisting of cuboidal BCC nanoscale precipitates within a B2 matrix. While they exhibit exceptionally good strength at both room and elevated temperatures, substantially exceeding those of single-phase BCC RHEAs, these novel two-phase RHEAs have very limited room temperature ductility. This can be explained by the inherent brittleness of the ordered B2 matrix phase.Reference Jensen32 Despite microstructural characterization of as-processed (AP) RHEAs and property assessments as a function of temperature and alloying elements,Reference Senkov, Woodward and Miracle15,Reference Senkov, Jensen, Pilchak, Miracle and Fraser17,Reference Han, Chen, Zhao, Fan, Yang, Shao and Yao23–Reference Wang and Xu25 only few studies discuss the phase stability with temperature in these alloys.Reference Yao, Liu, Gao, Jiang, Li, Liu, Zhang and Fan29–Reference Wu, Si, Lin, Wang, Wang, Wang, Liu and Hui31
The present study focuses on a detailed phase stability evaluation of an Al-containing RHEA as a function of temperature. A low density (7.4 g/cm3) RHEA, with the nominal composition Al0.5NbTa0.8Ti1.5V0.2Zr, has been chosen based on a good combination of its room and high temperature strength.Reference Senkov, Woodward and Miracle15 After the initial processing of the alloy, the microstructure consists of two BCC phases with very similar lattice parameters that form a very fine, interwoven basket weave-like, nanophase structure. The alloy was reported to have a room temperature yield strength of 2035 MPa but had only 4.5% compressive strain before fracture. This alloy was solutionized at a high temperature (1200 °C), followed by isothermal annealing at temperatures ranging from 600 to 1200 °C to study the phase stability. The phase stability as a function of temperature has been characterized in detail and discussed in this paper.
II. EXPERIMENTAL METHODS
A. Sample preparation
The Al0.5NbTa0.8Ti1.5V0.2Zr alloy was prepared by arc melting under vacuum backfilled with argon, using high purity (99.9%) elements. Details of the alloy preparation are explained elsewhere.Reference Senkov, Woodward and Miracle15 The nominal alloy composition from SEM-EDS is Al-11.3 1.0.7, Nb-22.3 ± 0.4, Ta-13.1 ± 1.2, Ti-27.9 ± 0.5, V-4.5 ± 0.8, and Zr-20.9 ± 0.9 (all in atomic percent). After solidification in a water-cooled copper hearth of the arc melter, the alloy was wrapped in a Ta foil and hot isostatically pressed (HIP’d) at 1200 °C for 2 h at a pressure of 210 MPa under high-purity argon. The alloy was then homogenized by annealing at 1200 °C for 24 h in a tube furnace with continuously flowing argon, and then slowly cooled at a controlled rate of 10 °C/min. This condition will be referred as the “as-processed” alloy. The AP alloy was sealed in a quartz tube filled with high-purity argon and annealed at 1200 °C for 2 h followed by water quenching. This condition will be referred to as the AP + solution annealed or APSA. The APSA alloy was cut in several pieces, which were sealed in argon-filled quartz tubes and annealed at 600 °C for 120 h, 800 °C for 20 h, or 1000 °C for 20 h. All solutionizing/annealing treatments that were performed on the AP alloy were followed by water quenching to retain the phases formed at the annealing temperatures.
B. Nomenclature
AP: Annealed at 1200 °C for 24 h and furnace cooled (10 °C/min).
APSA: AP followed by annealing at 1200 °C for 2 h and water quenched.
APSA + 1000: APSA followed by annealing at 1000 °C for 20 h and water quenched.
APSA + 800: APSA followed by annealing at 800 °C for 20 h and water quenched.
APSA + 600: APSA followed by annealing at 600 °C for 120 h and water quenched.
AP + 600: AP followed by annealing at 600 °C for 120 h and water quenched.
C. Characterization
The microstructure and composition of the heat-treated alloy samples were examined by using an FEI Nova-NanoSEM 230™ (FEI, Hillsboro, Oregon) scanning electron microscope (SEM). The SEM was equipped with an energy dispersive X-ray (EDS) detector (EDAX, Model: Apollo X, FEI, Hillsboro, Oregon), and a pure Ni standard was used to calibrate it. The chemical composition was determined from several regions of a total area of 1 × 1 mm2 per each sample to average the composition inhomogeneity, and EDAX’s Genesis Spectrum version 6.0 software (FEI, Hillsboro, Oregon) was used to process the raw data.
Conventional transmission electron microscopy (TEM) studies were carried out with a FEI Tecnai G2 TF20™ operating (FEI, Hillsboro, Oregon) at 200 kV. Phase characterization was done using conventional and high angle annular dark field-scanning TEM (HAADF-STEM) modes. Compositional mapping was done using an FEI-TITAN G2 TEM microscope operating (FEI, Hillsboro, Oregon) at 300 kV in the HAADF STEM mode and equipped with an energy dispersive spectroscopy detector (Super-X system). The results were analyzed with FEI’s ES vision software version 6 (FEI, Hillsboro, Oregon).
Atom probe tomography (APT) was used to determine local composition of the alloy and the phases present. All the atom probe experiments were conducted in the temperature range of 40–60 K, using a voltage evaporation mode with 0.5–1.0% evaporation rate and pulsing voltage maintained to 20% of the steady-state voltage at a frequency of 200 kHz. Raw data from the atom probe experiments were analyzed using Cameca’s IVAS 3.6.8®, Cameca, Madison, Wisconsin (Integrated Visualization and Analysis Software).
TEM foils and APT tips were prepared by using an FEI Nova Nanolab 200 dual-beam focused ion beam instrument (FEI, Hillsboro, Oregon) using a Ga ion beam for milling. The ion beam thinning of the samples was done in multiple steps starting from 30 kV ions and finishing with 5 kV ions to reduce the surface damage caused by higher energy ions.
III. RESULTS AND DISCUSSION
A. AP condition
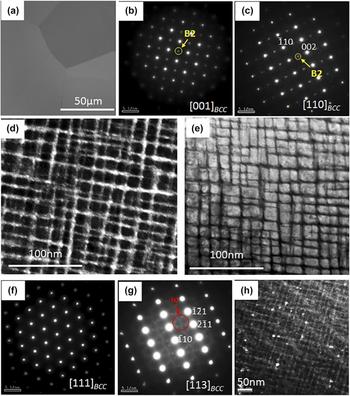
The microstructure of the alloy in the AP condition has been previously reported to have a mixture of two BCC phases with similar lattice parameters forming a very fine interwoven basket-weave like nanophase.Reference Senkov, Woodward and Miracle15 SEM backscatter imaging reveals a coarse-grained microstructure [Fig. 1(a)] appearing to be a single-phase. TEM examination identifies a two-phase nanostructure inside the grains. Selected area electron diffraction patterns (SADP) from the [001]BCC and [011]BCC zone axes [Figs. 1(b) and 1(c) respectively] clearly show the presence of superlattice reflections at {001} positions, indicating the presence of an ordered BCC-based phase in this alloy. This ordered BCC-based phase is the B2 phase (Strukturbericht notation). A dark-field TEM (DFTEM) image [Fig. 1(d)] created using a {001} type superlattice reflection in the [001]BCC SADP [highlighted by the yellow circle in Fig. 1(b)] shows that the B2 phase comprises the matrix and is present in the form of thin continuous channels around the discrete cuboidal BCC precipitates. Though the volume fraction of the BCC phase seems to be higher than that of the B2 phase, the latter phase forms the continuous and connected matrix phase. These phases exhibit a cube-on-cube orientation relationship described by (001)BCC//(001)B2 and [100]BCC//[100]B2. The BCC precipitate thickness along the 〈100〉 direction is ∼20 nm and that of the B2 channels is ∼2 nm. A scanning TEM (STEM) image, shown in Fig. 1(e), clearly depicts the arrangement of the B2/BCC phases in this microstructure with the bright contrast cuboidal phase being the BCC phase, whereas the interconnected dark matrix phase is the B2 phase. The lattice parameters of the BCC and B2 phases as calculated using X-ray diffraction are 3.30 Å and 3.32 Å, respectively. SADPs from [111]BCC and [113]BCC zone axes are shown in Figs. 1(f) and 1(g), respectively. The superlattice reflections at 1/3{112} and 2/3{112} in the [113]BCC zone axis diffraction pattern [Fig. 1(g)] correspond to the omega phase (ω) with hexagonal symmetry (P6/mmm), generally observed in Ti- and Zr-based alloys.Reference Bendersky, Boettinger, Burton, Biancaniello and Shoemaker36–Reference Ng, Devaraj, Nag, Bettles, Gibson, Fraser, Muddle and Banerjee38 This phase is rich in Ti and Zr, and lean in all other solute elements.Reference Hickman37 The DFTEM image from superlattice spots corresponding to the omega phase is shown in Fig. 1(h). These precipitates seem to be present in a randomly distributed fashion, often in the proximity of BCC/B2 interfaces, and have a very low volume fraction relative to the other two phases.
AP alloy condition: (a) SEM-BSED image; (b) TEM-SADP from [001]BCC where the extra superlattice spot corresponding to the B2 phase is highlighted by the yellow circle; (c) TEM-SADP from [110]BCC where the extra superlattice spot corresponding to the B2 phase is highlighted; (d) DFTEM created from the superlattice spot highlighted in Fig. 2(b); (e) STEM image showing the microstructure of the AP condition; (f) TEM-SADP from [111]BCC, no extra spots are observed; (g) TEM-SADP from [113]BCC showing the faint extra spots corresponding to the omega phase which is highlighted by red circle; (h) DFTEM corresponding to the omega spot in Fig. 2(g).

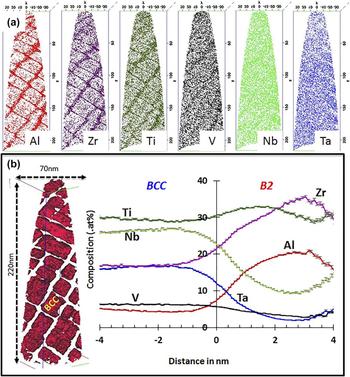
Figure 2 shows the APT results from the AP condition. Figure 2(a) presents the individual ion maps of each element. While Al, Zr, and Ti partition to the B2 channels, the cuboidal BCC phase is enriched in Nb, Ta, and V. The compositional profile across the BCC/B2 interface is shown by a “proximity histogram” (also referred to as a “proxigram”, see Ref. Reference Hellman, Vandenbroucke, Rüsing, Isheim and Seidman33) [Fig. 2(b)]. An isoconcentration surface of 10.5 at.% Al is used to create this proxigram. The reconstruction on the left of Fig. 2(b) shows the isosurface (red color) enclosing the BCC phase. The composition of BCC and B2 phases captured by APT are as follows (all values are in at.%):
AP alloy condition: (a) APT reconstruction showing individual ion maps for Al, Zr, Ti, V, Nb, and Ta (left to right) (b) reconstruction showing the cuboidal BCC phase encapsulated by Al isosurface (red color) on left and proximity histogram showing the compositional partitioning of the elements across the B2/BCC interface on right.
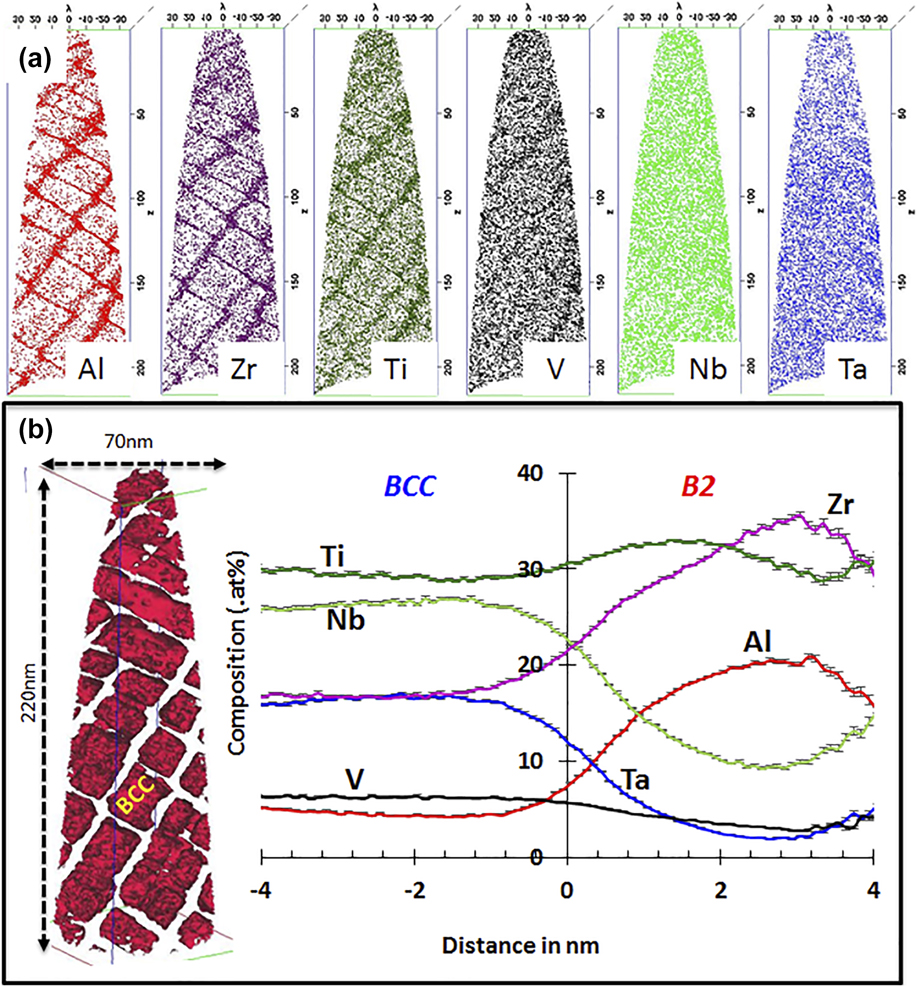
AP–B2: Al-19.34 ± 0.3, Nb-10.28 ± 0.4, Ta-4.11 ± 0.7, Zr-30.97 ± 0.5, Ti-31.05 ± 0.2, V-4.20 ± 0.9.
AP–BCC: Al-4.86 ± 0.9, Nb-27.31 ± 0.2, Ta-18.05 ± 0.5, Zr-10.91 ± 0.8, Ti-32.85 ± 0.5, V-5.99 ± 0.8.
B. AP + solutionized at 1200 °C condition (APSA)
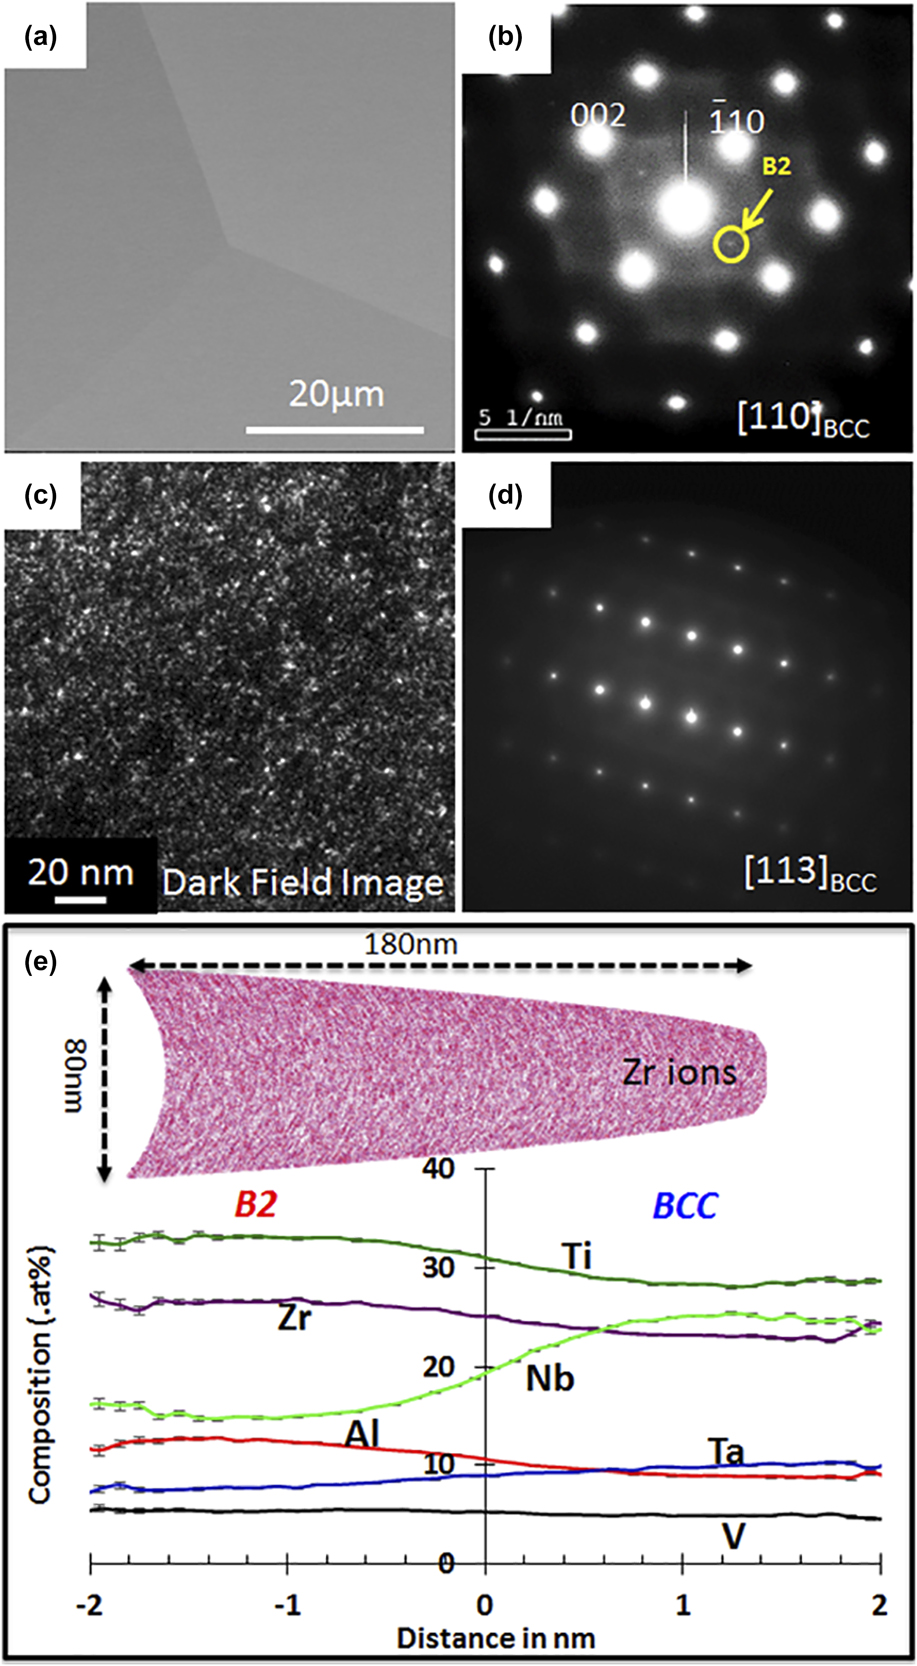
The AP alloy was solution annealed (APSA) at 1200 °C for 2 h and water quenched. Backscatter SEM images indicate the microstructure to be a single phase with coarse grains [Fig. 3(a)]. A SAED pattern from the [110]BCC zone axis shows very faint {001}-superlattice reflections [Fig. 3(b)], confirming the presence of ordering in the BCC matrix. A DFTEM image [Fig. 3(c)] recorded from the superlattice {001} spot indicates that the B2 precipitates are finely distributed in the BCC matrix and are of the order of few nanometers in size. An SADP from the [113]BCC zone axis [Fig. 3(d)] does not show any additional reflections corresponding to the omega phase. A detailed compositional analysis of the APSA condition was carried out using APT, and the results are shown in Fig. 3(e). An APT reconstruction is shown on the top of Fig. 3(e), which shows the Zr ion map, indicating a weak clustering in the matrix. A very weak partitioning trend appears to be present, dividing the reconstruction into Al, Zr, and Ti-rich regions versus Ta, Nb, and V-rich regions, as seen in the proxigram. The partitioning trend of these elements resembles that observed between the B2 and BCC phases in the AP condition. Even though the alloy was water-quenched after the annealing at 1200 °C, it is highly probable that some compositionally partitioning might have taken place while quenching causing nanoprecipitation of the B2 phase in the BCC matrix. Hence, the B2 nanoprecipitation is likely an indication of the BCC phase instability at lower temperatures when quenching the alloy from 1200 °C, and the high temperature phase is possibly a disordered solid solution (SS) BCC phase. Note that the microstructure of the 1200 °C annealed and quenched condition is starkly different from the AP condition, which has a well-decomposed two-phase B2–BCC microstructure resembling that of a superalloy. Based on the comparison between the microstructures of the AP and APSA conditions, it appears that in the case of the AP condition, the slow cooling at 10 °C/min from 1200 °C resulted in a higher degree of phase decomposition during the cooling process and formation of the well-developed B2 (matrix) + BCC (cuboidal precipitates) microstructure. The lattice parameter of the BCC phase, calculated using X-ray diffraction, is 3.34 Å.
APSA condition: (a) SEM-BSED image; (b) TEM-SADP from [011]BCC where the extra superlattice spot corresponding to the B2 phase is highlighted by the yellow circle; (c) DFTEM image taken from the superlattice spot observed in [011]BCC; (d) TEM-SADP from [113]BCC, no extra spots are observed; (e) APT reconstruction showing Zr ions (top) and proximity histogram showing the compositional partitioning of the elements across the compositional fluctuation (bottom).

C. Solutionized and subsequently annealed at 1000 °C and 800 °C conditions (APSA-1000 and APSA-800)
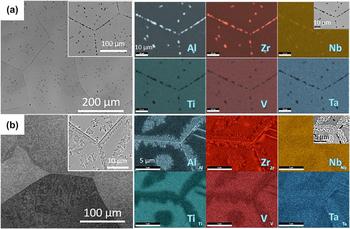
The APSA alloy samples (AP + 1200 °C/2 h + quenched) were annealed at 600, 800, or 1000 °C for different holding times to investigate the phase stability at these temperatures. SEM micrographs, after annealing at 1000 and 800 °C for 20 h, are shown in Figs. 4(a) and 4(b), respectively. SEM images from both annealing conditions show a grey contrast matrix and dark contrast precipitates at grain boundaries and within the grains [left of Figs. 4(a) and 4(b)]. In APSA-1000 [Fig. 4(a)], faceted precipitates can be observed on the grain boundaries and sparsely located within the grains. The SEM-EDS mapping from a grain boundary region reveals that these faceted precipitates are rich in Al and Zr and depleted in other elements. APSA-800 shows more dispersed and fine scale second phase precipitation compared to APSA-1000 [Fig. 4(b)]. Within the coarse-grained matrix, the grain boundary regions as well as intragranular regions reveal a fine scale discontinuous precipitation of a phase exhibiting a dark contrast, surrounded by local regions exhibiting a brighter contrast as compared to the matrix grains. Note that the brighter regions around the dark second phase and the matrix do not show any sharp phase boundary. The compositional maps from SEM-EDS reveal that the small dark contrast beads (second phase) are rich in Al and Zr, whereas the regions around these beads are depleted in these elements. Phase identification and further compositional characterization have been carried out using TEM.
SEM-BSE image (left) and SEM-EDS elemental maps (right) after (a) annealing at 1000 °C for 20 h (APSA-1000) and (b) annealing at 800 °C for 20 h (APSA-800).

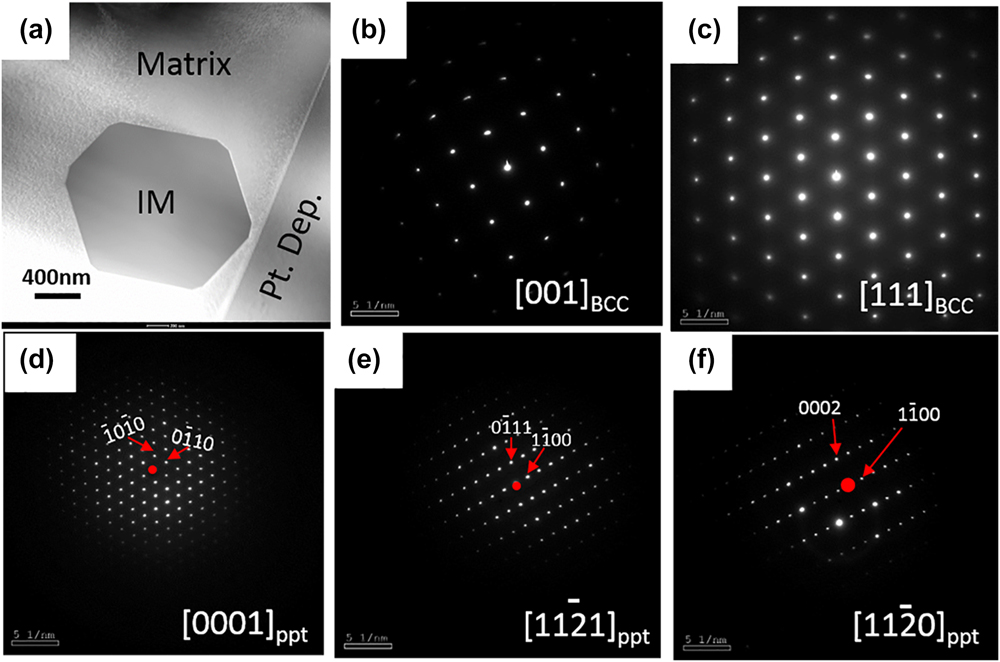
TEM results from the APSA-1000 are shown in Fig. 5. Figure 5(a) shows a STEM image containing one such precipitate. Note that the faceted morphology of the precipitate was also noticed in backscatter SEM images. Figures 5(b) and 5(c) show the electron diffraction patterns from [001]BCC and [111]BCC zones of the matrix, and it can be concluded that the matrix is a disordered BCC SS. The SADPs from the precipitates [Figs. 5(d)–5(f)] can be consistently indexed as the [0001],  $\left[ {11\bar{2}1} \right]$, and
 $\left[ {11\bar{2}0} \right]$ zone axes of a hexagonal closed packed (HCP) structure, respectively, with a very large lattice parameter as compared to that of the BCC matrix. Additionally, it was noticed that the [111]BCC was parallel to the [0001]HCP and [001]BCC was parallel to the
 ${\left[ {11\bar{2}1} \right]_{{\rm{HCP}}}}$ of the precipitate phase. This second phase is likely to be an intermetallic phase precipitated within the BCC matrix. The lattice parameter of the BCC matrix phase is a = 3.33 Å and that of the HCP intermetallic phase is a = 8.23 Å c = 6.38 Å.
TEM results from (APSA-1000): (a) STEM image showing the matrix and the intermetallic (IM) phase, (b and c) SADPs from the matrix, and (d, e, and f) SADPs from the IM phase.

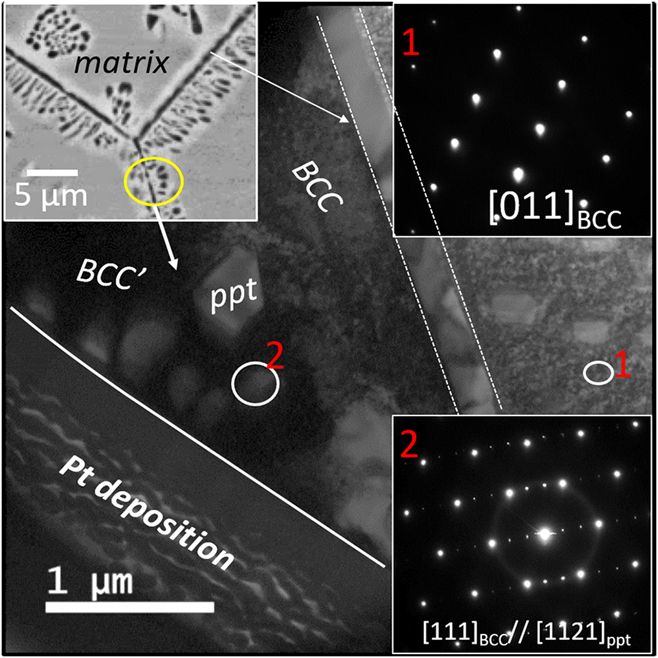
TEM analysis from the APSA-800 is shown in Fig. 6. Figure 6 is a bright-field image from this condition, which shows a continuous wetting layer of the precipitates on the grain boundary and discrete nanoscale precipitates around it; a representative region is marked in the SEM-BSED image by a yellow circle (shown as the inset on the top left of the figure). The SADP from the matrix region (marked as 1 by a white circle in Fig. 6) confirms the matrix to be a disordered BCC phase, without the presence of any superlattice reflections in the diffraction pattern (the inset of Fig. 6: top right). The SADP from region 2 ([ZA = 111]BCC), shown in the bottom right, has extra reflection corresponding to the precipitated intermetallic phase. The additional reflections in the [111]BCC diffraction patterns can be consistently indexed based on the  ${\left[ {11\bar{2}1} \right]_{{\rm{HCP}}}}$ zone axis. This is similar to the observation in case of the APSA-1000 condition where the
 ${\left[ {11\bar{2}1} \right]_{{\rm{HCP}}}}$ zone was found to be parallel to the [111]BCC zone. Also note that the morphology of the precipitates in the case of the APSA-800 condition is faceted with sharp corners, similar to the APSA-1000 condition. This Al–Zr rich HCP intermetallic phase is consistently observed in both APSA-1000 and APSA-800 conditions. Therefore, it appears that there is only a difference in the transformation pathways that lead to the precipitation of the HCP intermetallic phase in the case of APSA-1000 versus APSA-800. In the case of APSA-1000, the intermetallic phase precipitates heterogeneously as discrete precipitates on the grain boundaries and homogeneously within the BCC matrix. Whereas in APSA-800, the same intermetallic phase precipitates via discontinuous precipitation, both at grain boundaries as well as homogeneously within the matrix grains. The composition of the HCP intermetallic phase in APSA-1000 from STEM EDS was found to be Al-36.54 ± 0.9, Nb-6.04 ± 1.2, Ta-3.63 ± 1.5, Zr-37.50 ± 1.4, Ti-16.29 ± 0.7, V-0.00 (all values are in at.%). Based on the diffraction patterns and the composition, it appears that the Al–Zr rich precipitate phase is likely to be an Al4Zr5-type intermetallic phase. However, further detailed investigations are required to determine the true identity of this phase. Additionally, it should be noted that a grain boundary precipitate phase, of similar composition and crystal structure, was recently reported by Jenson et al. in an AlMo0.5NbTa0.5TiZr alloy having a space group P63/mcm.Reference Jensen32
TEM results from (APSA-800): Bright-field image: the inset shows a SEM-BSE image (left), SADP from [011]BCC zone of the matrix (top right), and SADP from [111]BCC (bottom right) from the ppt/matrix interface.

D. Solutionized and subsequently annealed at 600 °C condition (APSA-600)
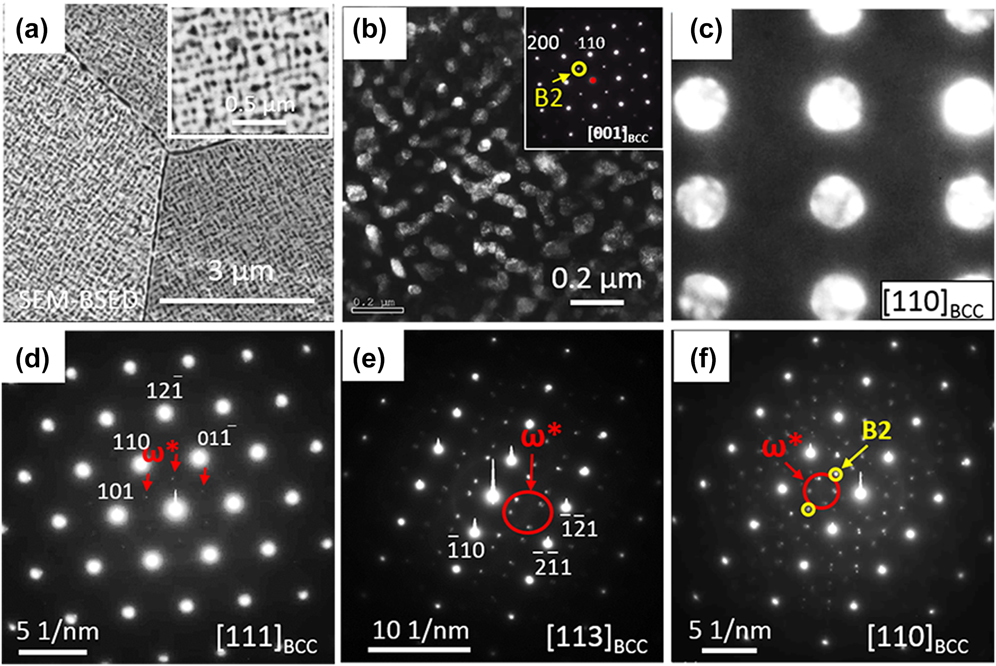
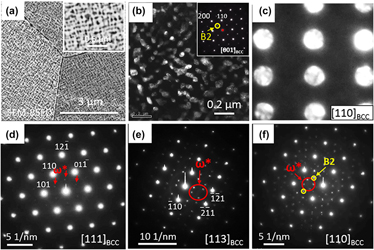
Backscatter SEM images of the APSA-600 are shown in Fig. 7(a). The microstructure consists of a bright matrix phase and dark phase precipitates distributed homogeneously within the matrix [more clearly seen in the inset of Fig. 7(a)]. TEM examination was performed to characterize the phases further and the results are shown in Figs. 7(b)–7(f). The {100} superlattice spot in the [001]BCC zone axis electron diffraction pattern, shown in Fig. 7(b), inset, clearly establishes the ordered nature of the BCC lattice. A DFTEM image recorded from the ordered superlattice spot (marked by the yellow circle in the inset diffraction pattern) highlights the B2 precipitates in the BCC-phase matrix. This establishes that the dark precipitates in the SEM-BSE micrograph [Fig. 7(a)] are the B2 phase, whereas the bright matrix is the BCC phase. The directional alignment of the B2 precipitates along the 〈100〉BCC directions can be a result of two possible reasons. First, as the B2 precipitates grow and coarsen in size, their elastic strain energy increases and can lead to their alignment along the elastically soft 〈100〉BCC directions. This is similar to the case of alignment of L12 γ′ precipitates within the FCC matrix of nickel-based superalloys.Reference Caron and Khan34 Another possible hypothesis is that initially the BCC phase undergoes phase separation via spinodal decomposition into BCC1 and BCC2 phases, followed by ordering within either one of these two BCC phases to form the B2 phase. Such a possible concomitant phase separation and ordering transformation in binary alloys has been previously reported.Reference Soffa and Laughlin35 Assuming that phase separation occurs via spinodal decomposition, the interference of {001} compositional waves results in cuboidal pockets of compositionally different regions as compared with the continuous matrix phase. Thus, in this case, pockets rich in Al–Zr can result from the spinodal decomposition within the parent BCC matrix; subsequently, these pockets undergo an ordering transformation to form B2 precipitates, whereas the other pockets rich in Ta and Nb remain disordered. Note that contrary to the AP microstructure where the B2 phase was the continuous matrix phase, in the APSA-600 microstructure, the continuous matrix phase is the BCC phase while the discontinuous discrete phase is the B2 phase. Besides, to confirm that the continuous matrix phase is the disordered BCC phase, a convergent beam microdiffraction pattern is recorded from the matrix [Fig. 7(c)] showing the [011]BCC zone axis diffraction pattern. SADPs from different zone axes [Figs. 7(d)–7(f)] also reveal that an ordered omega phase  $\left( {{\omega ^ * },\;p\bar{3}m1} \right)$ is present in addition to the BCC and B2 phases. Ordered omega phase can form by a collapse of {111} planes of a B2 structure,Reference Bendersky, Boettinger, Burton, Biancaniello and Shoemaker36 very similar to the formation of the omega phase by collapse {111} planes in the disordered BCC structure in Ti alloys on thermal annealing or thermal shock.Reference Bendersky, Boettinger, Burton, Biancaniello and Shoemaker36–Reference De Fontaine, Paton and Williams39 The lattice parameters of the BCC and B2 phases, calculated using X-ray diffraction, are 3.29 Å and 3.41 Å, respectively.
TEM results from (APSA-600): (a) SEM-BSED image (the inset shows a high magnification image); (b) DFTEM image created from the B2 superlattice spot highlighted by yellow circle in the SADP [001]BCC shown as the inset of this figure; (c) TEM-SADP from [110]BCC from the matrix phase; (d–f) TEM-SADP from [111]BCC, [113]BCC, and [110]BCC, respectively, showing extra spots corresponding to the ordered omega phase highlighted by red arrows.

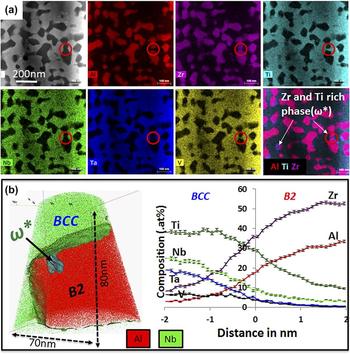
The phase compositions of both B2 and BCC phases have been analyzed using both STEM EDS and APT techniques. Figure 8(a) shows EDS elemental maps of the constituent elements, recorded in STEM in an aberration-corrected TITAN microscope using the Super-X™ detector (FEI, Hillsboro, Oregon). As seen from the first image (top left) in Fig. 8(a), the darker contrast in the STEM image is the B2 phase, whereas the bright matrix is the BCC phase. The encircled regions in the individual maps show the presence of the ordered omega phase. This phase appears to be rich in Ti and Zr, and lean in other elements. APT is used to further explore the compositional changes between the different phases.
Compositional examination of (APSA-600) by CHEM-STEM EDS and APT: (a) STEM image and elemental maps showing the element partitioning, red circles highlight the ordered omega phase. (b) APT reconstruction with Al and Nb ions and the proxigram across the B2–BCC interface.

Figure 8(b) shows the APT analysis from the sample annealed at 600 °C for 120 h. This 3D APT reconstruction shows only Al atoms (red color) and Nb atoms (green color), together with an 8 at.% Nb isoconcentration surface (green color surface), delineating the B2 and BCC phases, and a 50 at.% Ti isoconcentration surface (cyan color surface on the top left side of the B2 phase), delineating the ordered omega precipitate. It should be noted that based on this 3D view, the ordered omega phase appears to lie within the B2 phase. This is consistent with the omega precipitate observed in the STEM-EDS map in Fig. 8(a). A proxigram across the B2–BCC interface is shown in Fig. 8(b) (right). While the Al and Zr ions partition into the B2 phase, the BCC phase is enriched in the other elements. Note that Ti partitions into the BCC phase. This is in contrast with the previous observation in the AP condition where Ti appeared to be partitioning toward the B2 phase. The composition of the various phase in APSA-600 are as follows (all values are in at.%):
APSA-600-B2: Al-32.55 ± 0.8, Nb-1.84 ± 0.7, Ta-0.09 ± 0.07, Zr-54.34 ± 0.5, Ti-11.08 ± 0.2, V-0.06 ± 0.02.
APSA-600-BCC: Al-1.85 ± 0.1, Nb-24.51 ± 0.2, Ta-11.86 ± 0.8, Zr-16.37 ± 0.8, Ti-37.49 ± 1.3, V-7.92 ± 0.3.
APSA-600-ω*: Al-4.91 ± 0.2, Nb-2.52 ± 0.2, Ta-0.06 ± 0.03, Zr-35.26 ± 1.4, Ti-57.05 ± 1.9, V-0.18 ± 0.1.
E. Temperature-dependent phase stability and proposed transformation pathways
The current alloy in the AP condition exhibited a B2/BCC microstructure with B2 being the continuous matrix phase and BCC formed the cuboidal discrete phase. As the alloy was annealed at various temperatures and water quenched, the phase stability at different temperatures was investigated. In the APSA condition, the alloy exhibited a SS BCC matrix and ordered B2 nanoprecipitates randomly distributed inside the matrix. During annealing at 1000 and 800 °C, an additional Al–Zr-rich intermetallic phase having a hexagonal crystal structure nucleates and grows heterogeneously at grain boundaries as well as at certain intragranular locations. The exact nature of the intragranular nucleation sites for these intermetallic precipitates has not yet been determined. Since the number density of intragranular intermetallic precipitates is substantially lower than the extremely high number density observed for the B2 nanoprecipitates in the APSA condition, it appears that the B2 nanoprecipitates dissolved on annealing at 800 and 1000 °C, and the new phase stability regime at these elevated temperatures leads to the precipitation of the hexagonal Al–Zr-rich intermetallic phase. However, during isothermal annealing at 600 °C, the hexagonal intermetallic phase does not form, but the B2 + BCC microstructure is stable and develops further from the initial APSA condition.
The present investigation of the phase stability at different temperatures suggests that the decomposition of the high temperature BCC phase into BCC + B2 phases, observed in the initial AP condition, occurred below 800 °C during slow cooling at 10 °C/min from 1200 °C. The “superalloy-like” microstructure consisting of cuboidal pockets of BCC, within a continuous matrix of the ordered B2 phase, could potentially be the result of phase separation via spinodal decomposition accompanied by concomitant ordering, as described previously.Reference Soffa and Laughlin35 However, it should be noted that the details of the transformation pathway require more detailed investigation that are presently underway. The results presented in this paper clearly show that isothermal annealing of the APSA condition (nano-B2 precipitates in the BCC matrix) at 600 °C for 120 h leads to a two-phase microstructure comprising discrete B2 precipitates within a continuous BCC matrix. Additionally, similar long-term annealing experiments have been carried out starting from the AP condition, comprising discrete cuboidal BCC precipitates within a continuous ordered B2 matrix, and then annealed at 600 °C for 120 h. The resultant microstructure, shown in Fig. S1 (Supplementary Material figures), reveals that starting from the AP condition, the microstructure inverts to form discrete B2 precipitates within a continuous BCC matrix. These results clearly indicate that at the early stages of decomposition (AP condition), the phase fractions of the B2 and BCC phases are far from equilibrium. During isothermal annealing at 600 °C, the phase fractions of these two phases change quite substantially, with an increase in the B2 phase fraction and reduction in the BCC phase fraction, eventually leading to an inversion of the microstructure with discrete B2 precipitates within a continuous BCC matrix. While this inversion of the microstructure is very interesting and novel, the details of the mechanism that leads to this change in phase fractions is yet to be investigated.
IV. SUMMARY
The microstructural evolution and phase stability in an Al0.5NbTa0.8Ti1.5V0.2Zr RHEA has been investigated in detail as a function of temperature, viz. 600, 800, 1000, and 1200 °C.
With progressively decreasing temperature, the sequence of phase evolution and stability in this alloy can be described as folllows:
(1) In the AP condition [AP, annealed at 1200 °C for 24 h and furnace cooled (10 °C/min)]—a BCC + B2 microstructure, comprising a continuous B2 matrix phase with discrete cuboidal BCC precipitates. Additionally, a small fraction of omega phase is also observed in this microstructure
(2) At 1200 °C—a BCC SS phase matrix with B2 nanoprecipitates;
(3) At 1000 °C—a BCC matrix phase with sparsely distributed second phase precipitates, at grain boundaries and also within grains, of a faceted Al–Zr rich HCP intermetallic phase of size scale of ∼2 µm;
(4) At 800 °C—a BCC matrix with regions exhibiting discontinuous precipitation to form the Al–Zr rich HCP phase and a Al and Zr depleted, BCC′ phase, and finally;
(5) At 600 °C—a BCC + B2 microstructure, comprising a continuous BCC matrix phase with discrete B2 precipitates. An ordered omega phase is detected within the B2 phase, which is enriched in Ti and Zr and lean in all the other elements.
The microstructure at 600 °C possibly emerged via a spinodal decomposition within the BCC phase, coupled with concurrent B2 ordering of one of the resultant BCC phases. However, in the early stages, the B2 ordering appears to occur within the lower phase fraction continuous BCC phase. Subsequently, longer term isothermal annealing at 600 °C, results in an inversion of the microstructure, presumably driven by the increase in the B2 phase fraction, finally resulting in discrete B2 precipitates within a continuous BCC matrix. These results highlight the substantial changes in phase stability as a function of temperature in RHEAs, and HEAs in general, and the importance of accounting for these changes especially while designing alloys for high temperature applications.
Supplementary Material
To view supplementary material for this article, please visit https://doi.org/10.1557/jmr.2018.223.
ACKNOWLEDGMENTS
This work has been supported by the U.S. Air Force Office of Scientific Research under contract FA9550-17-1-0395 and conducted at the University of North Texas. Technical support from P. Fagin is gratefully appreciated. Work by ONS was supported through the U.S. Air Force on-site contract FA8650-15-D-5230 managed by UES, Inc., Dayton, Ohio, and through the Air Force Research Laboratory, Materials and Manufacturing Directorate, Lab Director’s funds. The authors acknowledge the Materials Research Facility (MRF) at the University of North Texas for the use of microscopy and atom probe tomography facilities, and the Center for Electron Microscopy and Analysis (CEMAS) at the Ohio State University, for microscopy facilities.