


Introduction
Acetylcholinesterase (AChE, EC 3.1.1.7), encoded by the ace locus, is an essential enzyme at cholinergic nerve synapses in all animals (Soreq & Zakut, Reference Sorer and Zakut1993; Soreq & Seidman, Reference Soreq and Seidman2001). The basic role of the enzyme is to terminate neurotransmission by catalyzing the hydrolysis of the neurotransmitter acetylcholine (ACh) in the central nervous system. In contrast to vertebrate cholinesterases, which are highly polymorphic in their molecular forms (Massoulié et al., Reference Massoulié, Pezzementi, Bon, Krejci and Vallette1993), the predominant form of AChE in insects is a globular amphiphilic dimer attached to membrane via a glycolphosphatidylinositol (GPI) anchor at the C-terminal of each catalytic subunit (Gnagey et al., Reference Gnagey, Forte and Rosenberry1987; Fournier et al., Reference Fournier, Bergé, Cardoso de Almeida and Bordier1988; Haas et al., Reference Haas, Marshall and Rosenberry1988; Toutant, Reference Toutant1989).
The enzyme is the principal target of organophosphate (OP) and carbamate (CB) insecticides, which inhibit AChE by phosphorylation or carbamylation, resulting in the accumulation of ACh at the postsynaptic membrane, desensitization of the nervous system and eventual death. Insensitive AChE caused by structural alteration has been proven to be the mechanism of OP and CB resistance in Drosophila (Mutero et al., Reference Mutero, Pralavorio, Bride and Fournier1994), Colorado potato beetle (Zhu et al., Reference Zhu, Lee and Clark1996), house fly (Kozaki et al., Reference Kozaki, Shono, Tomita and Kono2001; Walsh et al., Reference Walsh, Dolden, Moores, Kristensen, Lewis, Devonshire and Williamson2001), Australian sheep blowfly (Chen et al., Reference Chen, Newcomb, Forbes, McKenzie and Batterham2001), olive fruit fly (Vontas et al., Reference Vontas, Hejazi, Hawkes, Cosmidis, Loukas, Janes and Hemingway2002) and cotton aphid (Li & Han, Reference Li and Han2004). Therefore, details of the enzyme's biochemistry, genetics and molecular biology are valuable for understanding and elucidating the intricacies of the molecular mechanisms of OP resistance in insects.
Since the first invertebrate ace gene isolation from D. melanogaster by homology to Torpedo AChE (Hall & Spierer, Reference Hall and Spierer1986), characterization of AChE encoding cDNA has been carried out in several species including Diptera (Huang et al., Reference Huang, Qiao, Williamson and Devonshire1997; Chen et al., Reference Chen, Newcomb, Forbes, McKenzie and Batterham2001), Coleoptera (Zhu & Clark, Reference Zhu and Clark1995), Hemiptera (Hall & Malcolm, Reference Hall and Malcolm1991; Anthony et al., Reference Anthony, Rocheleau, Mocelin, Lee and ffrench-Constant1995; Tomita et al., Reference Tomita, Hidoh and Yoshiaki2000; Gao et al., Reference Gao, Kambhampati and Zhu2002; Li & Han, Reference Li and Han2002), Lepidoptera (Lee et al., Reference Lee, Kim, Shin, Kim and Boo2006; Seino et al., Reference Seino, Kazuma, Tan, Tanaka, Kono, Mita and Shiotsuki2007) and Acari (Hernandez et al., Reference Hernandez, He, Chen, Ivie, George and Wagner1999; Baxter & Barker, Reference Baxter and Baker1998). However, its gene organization has been completed in only a few species, including D. melanogaster (Hall & Spierer, Reference Hall and Spierer1986), Anopheles stephensi (Hall & Malcolm, Reference Hall and Malcolm1991), Lucilia cuprina (Chen et al., Reference Chen, Newcomb, Forbes, McKenzie and Batterham2001), Aedes aegypti (Mori et al., Reference Mori, Lobo, deBruyn and Severson2007) and Bombyx mori (Seino et al., Reference Seino, Kazuma, Tan, Tanaka, Kono, Mita and Shiotsuki2007).
The olive fruit fly, B. oleae, is the major, high impact pest of the olive tree. Damage, which is caused by oviposition of fly eggs in the olive fruit and feeding of the emerged larvae upon the pulp, results in extremely high losses of olive yield (Montiel Bueno & Jones, Reference Montiel Bueno and Jones2002). In the Mediterranean, control of the olive fly costs the olive industry hundreds of millions of euros every year. The management of B. oleae in most regions with high population densities of the pest still relies heavily on organophosphate (OP) insecticides, since alternative measures are either not effective enough (Economopoulos et al., Reference Economopoulos, Avtzis, Zervas, Tsitsipis, Haniotakis, Tsiropoulos and Manoukas1977; Kapatos, Reference Kapatos, Rombinson and Hooper1989; Broumas et al., Reference Broumas, Haniotakis, Liaropoulos, Tomazou and Ragoussis2002) or considerably costlier (spinosad). However, their intensive and non-prudent use has resulted in the progressive development and spread of insecticide resistance in natural insect populations. Three mutations have been identified to correlate with higher levels of tolerance in B. oleae (Vontas et al., Reference Vontas, Hejazi, Hawkes, Cosmidis, Loukas, Janes and Hemingway2002; Kakani et al., Reference Kakani, Ioannides, Margaritopoulos, Seraphides, Skouras, Tsitsipis and Mathiopoulos2008, Reference Kakani, Bon, Massoulié and Mathiopoulos2011).
In 2002, Vontas et al. cloned and characterized the complete coding AChE mRNA sequence of B. oleae. In this study, we present the genomic organization of the olive fruit fly ace locus, as well as structural and functional features of the enzyme.
Material and methods
Insect-laboratory strain
Bactrocera oleae flies have been reared in our laboratory for over seven years. The original stock was obtained from the Department of Biology, ‘Demokritos’ Nuclear Research Center, Athens, Greece. In the laboratory, the flies are reared on an artificial medium based on yeast hydrolysate, sucrose, egg yolk and water at 25 °C with a 12 h light/12 h dark cycle, as previously detailed in Rodriquez et al. (Reference Rodriguez, Simonetti, Premoli and Marini1967) and Tsitsipis (Reference Tsitsipis1977).
Screening of genomic library
A constructed λ-DASH®IΙ genomic library of adult olive fly was used for screening (Lagos et al., Reference Lagos, Ruiz, Sánchez and Komitopoulou2005) according to standard protocols (Sambrook et al., Reference Sambrook, Fritch and Maniatis1989). Screening of the library was performed through two different experimental approaches: (i) direct screening of genomic library and (ii) screening of preselected fractions of genomic library.
Direct screening
About 100,000 recombinant bacteriophages of an olive fly genomic library were directly screened with B. oleae ace cDNA as probe. Given the genome size of the olive fly (322 Mb: Tsoumani & Mathiopoulos, Reference Tsoumani and Mathiopoulos2011) and, according to the formula N = ln(1–P)/ln(1–f) (P= probability, f = insert/genome size) (Clarke & Carbon, Reference Clarke and Carbon1976), this would allow the isolation of a single copy gene with a probability of 99%.
Screening of preselected library fractions
In the beginning, the olive fly genomic library was modified into a serial collection of aliquots. More specifically, approximately 100,000 recombinant phages of the olive fly genomic library plated onto a 22 × 22 cm2 dish were divided into 484 primary fractions that contained about 200 clones each. Subsequently, ten primary fractions were combined together to form 49 secondary fractions (with ∼2000 clones each), and afterwards they were combined per five in ten tertiary fractions (with ∼10,000 clones each). In this way, a clone of interest can be isolated by a series of simple PCRs and a final screen in a library fraction, as follows. Initially, the clone of interest is localized in one of the tertiary fractions by a PCR. The five secondary fractions that correspond to the identified tertiary fraction can then be analyzed with a new PCR, and a final round of PCRs can ultimately lead to the primary fraction of phage clones that should contain the fragment of interest. Consequently, only this last fraction of the library (containing ∼200 clones) needs to be screened in order to isolate the phage of interest.
PCR products of AChE cDNA (exons II-X) and exons II, VII and IX were used as probes after labeling with 11-dUTP-biotin by random priming (DecaLabel™ DNA Labeling Kit, Fermentas, Burlington, Canada) at the hybridization temperature 65 °C. Amplification of the probes was performed under the following conditions: initial denaturation at 94 °C for 4 min, followed by 30 cycles consisting of denaturation at 94 °C for 30 s, annealing temperature for 30 s and 72 °C for extension time. This was followed by 7 min of final extension. Primers, annealing temperatures and extension times are described in table 1.
Oligonucleotide primers and conditions used in PCRs.

Polymerase chain reaction - RACE, long and inverse PCR
Primers for PCR amplifications were designed based on the known B. oleae cDNA sequence (Vontas et al., Reference Vontas, Hejazi, Hawkes, Cosmidis, Loukas, Janes and Hemingway2002). Primers, annealing temperatures and extension times are described in table 1. Genomic DNA and total RNA were extracted from adult olive flies (of the ‘Demokritos’ strain) using Wizard® Genomic DNA Purification Kit (Promega, Madison, WI, USA) and Absolutely RNA Isolation Kit (Stratagene, La Jolla, CA, USA), respectively. PCR products were verified after subcloning and sequencing.
5′ RACE PCR
While the originally isolated ace cDNA was obtained by a 5′ and a 3′ RACE reaction (Vontas et al., Reference Vontas, Hejazi, Hawkes, Cosmidis, Loukas, Janes and Hemingway2002), the 5′ end of the complete ace transcript was not included. A further part of the missing 5′-end of the ace transcript was obtained by an additional 5΄ RACE according to the protocol described in Sambrook et al. (Reference Sambrook, Fritch and Maniatis1989). Reverse transcription (RT-) PCR was performed using the Affinity-Script QPCR cDNA synthesis kit (Stratagene) using a gene specific primer 1 (GSP1: ATGTCTGCACCACCAAAC, between positions 176 and 193 of the ATG) and 1 μg of total RNA as template. dATPs were added to the 3΄-OH of the resulting first strand by terminal deoxynucleotidyl tranferase (TdT, Fermentas). One-tenth of this product was subjected to PCR amplification using the GSP1 primer, a second gene specific primer (internal of GSP1) (GSP2: TGACGCCATACACGGAGGACATAC, between positions 146 and 169 of the ATG) and an oligo-dT primer. The amplification reaction was performed in 20 μl reaction volume that contained a final concentration of 1 × Taq buffer, 1.5 mM MgCl2, 0.2 mM of each dNTP, 0.6 μΜ of GSP1 and GSP2 primer, 0.3 μM of oligo-dT primer, and one unit of Taq polymerase (Bioline, London, UK). The reaction conditions were: initial denaturation at 94 °C for 4 min, followed by 30 cycles consisting of 94 °C for 30 s, annealing temperature for 30 s and 72 °C for extension time. This was followed by 7 min of final extension.
Long PCR
Long PCR was performed in 25 μl reaction volume, and ∼1 μg genomic DNA was used as template. The amplification reactions contained a final concentration of 1 × long PCR buffer supplemented with 1.5 mM MgCl2, 0.2 mM of each dNTP, 0.6 μΜ of each primer, 2.5 units of long PCR enzyme mix (Fermentas) and 4% DMSO. DMSO increases yields and improves reliability of the system for long PCR and PCR of complex targets according to the manufacturer's specifications. All amplifications were performed under the following conditions: initial denaturation at 94 °C for 2 min, followed initially by ten cycles consisting of 94 °C for 30 s, annealing temperature for 30 s and 72 °C for extension time and then by another 25 cycles consisting of 94 °C for 30 s, annealing temperature for 30 s and 72 °C for extension time +10 s cycle–1. This was followed by 7 min of final extension.
Inverse PCR
Inverse PCR was performed according to Sambrook et al. (Reference Sambrook, Fritch and Maniatis1989). Genomic DNA (∼1 μg) was digested by restriction enzyme EcoRI. A series of ligation reactions were performed using a part of the cleaved template DNA (50–100 ng) and T4 DNA ligase (Fermentas). Following phenol/chloroform extraction and ethanol precipitation, the ligation products were used as template for PCR amplification. The reaction volume was 20 μl, containing a final concentration of 1 × Taq buffer, 1.5 mM MgCl2, 0.2 mM of each dNTP, 0.6 μΜ of each primer and one unit of Taq polymerase (Bioline). The reaction conditions were: initial denaturation at 94 °C for 4 min, followed by 30 cycles consisting of 94 °C for 30 s, annealing temperature for 30 s and 72 °C for extension time. This was followed by 7 min of final extension.
In situ hybridization
Polytene chromosome preparations of salivary glands were made from late third-instar larvae, as described in Zambetaki et al. (Reference Zambetaki, Zacharopoulou, Scouras and Mavragani-Tsipidou1999). Phage λBoace3-5 was mapped on polytene chromosomes after labeling with digoxigenated dUTP (dig-11dUTP) using the random priming method at a hybridization temperature of 62 °C, and the detection of the signals was performed with specific antibodies (ROCHE Diagnostics, Mannheim, Germany) according to Drosopoulou & Scouras (Reference Drosopoulou and Scouras1995).
Bioinformatic analysis
DNA sequences were analyzed using the Omiga software (Kramer, Reference Kramer2001), ClustalW online software (Thompson et al., Reference Thompson, Higgins and Gibson1994) and BLAST programs available on NCBI (Altschul et al., Reference Altschul, Gish, Miller, Myers and Lipman1990). In silico analyses were performed using a wide range of softwares available on ExPASy portal (http://us.expasy.org/tools/), including NetPhos 2.0 (Blom et al., Reference Blom, Gammeltoft and Brunak1999), NetNClyc 1.0 (Gupta et al., 2004), big-PI Predictor (Eisenhaber et al., Reference Eisenhaber, Bork and Eisenhaber1999) and GCUA (Fuhrmann et al., Reference Fuhrmann, Hausherr, Ferbitz, Schödl, Heitzer and Hegemann2004).
Results
Isolation of ace gene
Screening genomic library
The B. oleae ace gene has an open-reading frame of 2022 bp, encoding a putative protein of 673 amino acids (Vontas et al., Reference Vontas, Hejazi, Hawkes, Cosmidis, Loukas, Janes and Hemingway2002). We used the sequence of the B. oleae AChE mRNA to probe a genomic olive fly library in order to isolate and characterize its acetylcholinesterase locus. To this aim, the screening of an adult genomic lambda (λ-DASH®IΙ) library of olive fly (Lagos et al., Reference Lagos, Ruiz, Sánchez and Komitopoulou2005) was carried out through two different experimental approaches: (i) direct screening of genomic library and (ii) screening of preselected via PCR fractions of genomic library.
The direct screening yielded a bacteriophage with an approximately 13 kb insert. An internal HindIII fragment of 5 kb hybridized strongly to the B. oleae cDNA coding region, and partial sequence determination confirmed that it contained a part of intron 2, the intact sequence of exon ΙΙΙ, intron 3, exon IV, intron 4, exon V and a part of intron 5 according to Drosophila's organization and B. oleae cDNA (supplementary material, fig. S1). This phage was named λBoace3-5.
On the other hand, PCR products of exons VII and IX were used in the screening of preselected fractions of genomic library in order to isolate downstream clones and a PCR product of exon II was used to isolate upstream clones. The initial screening of preselected primary fractions resulted in seven putative clones but secondary screening led to the isolation of only three positive single bacteriophages, designated λBoace2, λBoace7 and λBoace9 that included an insert size of approximately 15 kb, 14 kb and 16 kb, respectively (supplementary material, fig. S2). Comparison of sequence data of restriction fragments of λBoace2 and cDNA confirmed that a 1589 bp restriction fragment of λBoace2 contains at least the known sequence of the exon II (374 bp) (downstream of the initiation ATG codon), as well as part of the downstream intron (7 bp). Furthermore, the possibility that the rest of λBoace clone (1208 bp) contained sequences upstream of the ATG was examined. Alignment of the 5′ RACE-PCR product and the 1589 bp λBoace2 restriction fragment indicated that λBoace2 contains the 531 bp 5′ RACE-PCR product and additionally this consists part of exon II. However, bioinformatic analysis of the rest of λBoace2 restriction fragment suggested a putative splice acceptor site ∼700 bp upstream of ATG, indicating that the start codon is located at exon II and there is one noncoding exon upstream of it. No donor splice site was detected, thus it is unlikely that λBoace2 also contains exon I. Unfortunately, the 1208 bp restriction fragment was the leftmost fragment of the phage insert and therefore further upstream ace sequences were not part of the available bacteriophage (data not shown). λBoace7 contained the entire sequence of exon VII and part of the flanking introns and λBoace9 contained the entire sequence of exon IX and part of the flanking introns according to Drosophila's organization.
Long and inverse PCR
The analysis of the four isolated bacteriophages (total size of ∼58 kb) revealed that intron length in B. oleae ace is longer than in D. melanogaster ace (Fournier et al., Reference Fournier, Karch, Bride, Hall, Berge and Spierer1989). Since we did not accomplish the isolation of the entire ace locus through library screening, we tried the isolation of the remainder intragenic regions of B. oleae ace by long and/or inverse PCR.
The known cDNA sequence of B. oleae ace allowed the design of EPIC (exon primed intron crossing) primers in order to amplify introns 2, 5, 6, 7, 8 and 9 by long PCR. The size of intron 2 was approximately 12 kb, and the size of introns 6, 7, 8 and 9 was approximately 10 kb, 14 kb, 8 kb and 10 kb, respectively (supplementary material, fig. S3). Unfortunately, there was no amplification product for the intron 5, presumably due to its very large size.
An inverse PCR approach was used to identify the intron/exon boundaries in the cases where intron isolation had not proven possible via library screening or long PCR. Diverging primer pairs for exons VI were designed based on the known cDNA sequence and the sequence of the amplified products compared to the cDNA sequence determined intron 5/exon VI boundaries.
Organization of ace gene
The organization of the gene was deduced by comparison to the ace cDNA sequence of B. oleae (Vontas et al., Reference Vontas, Hejazi, Hawkes, Cosmidis, Loukas, Janes and Hemingway2002) and the organization of the locus in D. melanogaster (Fournier et al., Reference Fournier, Karch, Bride, Hall, Berge and Spierer1989), A. stephensi (Hall & Malcolm, Reference Hall and Malcolm1991), L. cuprina (Chen et al., Reference Chen, Newcomb, Forbes, McKenzie and Batterham2001), A. aegypti (Mori et al., Reference Mori, Lobo, deBruyn and Severson2007) and B. mori (Seino et al., Reference Seino, Kazuma, Tan, Tanaka, Kono, Mita and Shiotsuki2007). The organization of the gene is depicted in fig. 1.
Molecular map of the acetylcholinesterase locus of olive fly. The top line with the shaded boxes shows the molecular organization of the regions coding the mature protein. Exons are numbered I to X. The lower part depicts the ace transcript. The pre-mature molecule presents an N-terminal signal peptide, a hydrophilic peptide and a C-terminal peptide. In the mature protein the signal peptide is split off, the hydrophilic peptide also is cleaved leading to two polypeptides (P1, P2) that compose the monomer, whereas the C-terminal peptide is substituted by a GPI anchor. The isolated phages and regions where long, inverse and 5′ RACE PCR were conducted are indicated in the figure. The asterisk * indicates the approximate locations of the three resistance-associated mutations.

The fact that the start codon is involved in the second exon of all characterized insect ace genes allowed us to surmise the same structure for B. oleae ace. Although we were able to characterize eight introns experimentally and an additional putative splice acceptor site bioinformatically, we undoubtedly suggest that the gene comprises of ten exons (I–X) separated by nine introns (1–9). Exon I is non-coding, whereas exon II contains the initiation codon (ATG) and exhibits partial amino acid conservation between Drosophila and B. oleae. Exons III–IX form the catalytic subunit and are highly conserved between the two species and generally among insects. Exon X contains the stop codon (TAA) and exhibits partial amino acid conservation between species. The description of exons is illustrated in table 2.
Intron and exon size of olive fly ace.
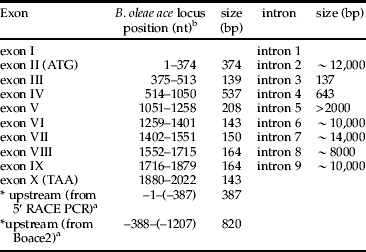
a *indicate the fragments isolated by 5΄ RACE PCR and λBoace2.
b Numbering of nucleotides is based on the B. oleae ace cDNA, where +1 and +2022 correspond to start and stop codons, respectively.
The positions of introns replicate exactly those determined in Drosophila and Anopheles. Intron length varies from 137 bp to at least 12,000 bp. Despite the use of two different approaches (library screening and long PCR) introns 1 and 5 were not fully determined, presumably due to their very large size. Introns of B. oleae ace present extensive divergence in size compared to the corresponding of Drosophila. All intron-exon boundaries obey the GT-AG rule of Breathnach et al. (Reference Breathnach, Benoist, O'Hare, Cannon and Chambon1978) and match well with consensus donor and acceptor sites (Mount, Reference Mount1982). Furthermore, they contain a conserved internal signal (branch point) important for splicing YTNAN (Keller & Noon, Reference Keller and Noon1985). Nucleotide BLAST search of intron sequences revealed a part of Cotesia plutallae polydnavirus (EF067331) in intron 2, a part of D. sturtevanti P transposable element in intron 4 and a part of B. tryoni mariner element in intron 5. The characteristics of introns are shown in tables 2 and 3.
Sequences at the intron junctions of B. oleae ace.

The eight exon/intron junction sequences are compared with the eukaryotic splice site consensus derived by Mount (Reference Mount1982) and with the sequence consensus of the branch point of lariat formation C/TTNAN derived by Keller & Noon (Reference Keller and Noon1985). The bold and underlined nucleotides in the splice acceptor column represent the putative branch point, whereas the underlined nucleotides in splice donor and acceptor column correspond to conserved nucleotides that participate in splicing. The last column indicates the intron phase.
As a result, B. oleae ace locus extends for at least 60,000 bp, excluding the length of introns 1 and 5. Bearing in mind that all characterized introns of B. oleae are larger than Drosophila and that intron 1 and 5 of Drosophila are the largest, 11,648 and 5019 bp, respectively, then the locus of Bo ace should be at least 75 kb. The initiation codon lies in the context AGCATGGC. There are termination codons upstream of the initiation codon in all three frames and three upstream ATG codons. However, none of them would be very favorable for initiation by the Kozak (Reference Kozak1986) criteria with a purine adenine in position –3 and guanine in position +4 of the start codon. The transcription start has not yet been determined and according to Markov Chain Promoter Finder McPromoter006 (Ohler, Reference Ohler2006) is not contained in the sequence.
Ace genome location
The precise map position of the B. oleae ace gene was determined by in situ hybridization to salivary gland polytene chromosome using the phage λBoace3-5 as probe. According to the available polytene chromosome maps (Mavragani-Tsipidou et al., Reference Mavragani-Tsipidou, Karamanlidou, Zacharopoulou, Koliais and Kastritisis1992; Zambetaki et al., Reference Zambetaki, Kleanthous and Mavragani-Tsipidou1995), the B. oleae ace locus was mapped in division 34 on the chromosome arm IIL. This chromosomal arm is syntenic to D. melanogaster 3R (Mavragani-Tsipidou, Reference Mavragani-Tsipidou2002) where its ace gene is localized (Hall & Spierer, Reference Hall and Spierer1986). Moreover, the in situ hybridization of B. oleae ace showed the presence of a single major ace locus, which is in agreement with the results of Vontas et al. (Reference Vontas, Hejazi, Hawkes, Cosmidis, Loukas, Janes and Hemingway2002).
In silico analysis
In 2002, Vontas et al. (Reference Vontas, Hejazi, Hawkes, Cosmidis, Loukas, Janes and Hemingway2002), investigating the insecticide resistance of B. oleae, cloned the full length sequence of the B. oleae precursor AChE mRNA and demonstrated that the open reading frame (2022 bp) of cDNA encodes a putative pre-enzyme of 673 amino acid residues and presents, based on the AChE crystal structure of D. melanogaster (Harel et al., Reference Harel, Kryger, Rosenberry, Mallender, Lewis, Fletcher, Guss, Silman and Sussman2000), all the common features of AChE, including: (i) the conserved catalytic triad of the active site S235, G364, H477; (ii) the oxyanion hole-forming residues G148, G149, A236; (iii) the anionic binding site W83; (iv) six cysteine residues putatively involving intramolecular disulfide bonds C66–C93, C289–C304, C439–C557; (v) a C-terminal cysteine residue forming intermolecular disulfide bond linking the dimer of catalytic subunit C574 (Bourguet et al., Reference Bourguet, Raymond, Fournier, Malcom, Toutant and Arpagaus1996); and (vi) 13 conserved aromatic amino acid residues lining the catalytic gorge W83, W99, W144, F150, Y160, W268, W318, F327, Y367, F368, Y371, H462, W469. Another conserved feature of the B. oleae sequence is the flanking consensus sequence of the active site serine ‘FGESAG’ that is conserved in all cholinesterases (Hall & Spierer, Reference Hall and Spierer1986; Schumacher et al., Reference Schumacher, Camp, Maulet, Newton, MacPhee-Quigley, Taylor, Friedmann and Taylor1986; Lockridge et al., Reference Lockridge, Adkins and La Du1987; Soreq et al., Reference Soreq, Ben-Aziz, Prody, Seidman, Gnatt, Neville, Lieman-Hurwitz, Lev-Lehman, Ginzberg, Lipidot-Lifson and Zakut1990; Legay et al., Reference Legay, Bon and Massoulié1993; Arpagaus et al., Reference Arpagaus, Richier, Berge and Toutant1992).
Additional characteristics of B. oleae AChE were identified via bioinformatic analysis. The calculated molecular mass and isoelectric point of the precursor AChE is 74,605.43 kDa and 5.97, respectively; whereas, the values of mature enzyme are 69,038.99 kDa and 5.71. Furthermore, inspection of the hydropathy profile of B. oleae AChE, as shown in fig. 2, revealed three basic traits of the protein: an N-terminal hydrophobic signal peptide, a hydrophilic peptide and a C-terminal hydrophobic signal peptide. Figure 3 depicts the important features of the protein.
Hydropathy graph of B. oleae AChE. Hydropathy graph of B. oleae AChE was plotted according to Kyte & Doolittle (Reference Kyte and Doolittle1982). Positive and negative values of the y-axis indicate the hydrophobicity and hydrophilicity of the protein, respectively. The N-terminal signal peptide, the hydrophilic peptide and the C-terminal peptide are indicated by white color.

Schematic diagram of B. oleae's AChE, showing features of the protein.

N-terminal signal peptide
The putative signal peptide domain of the insect AChE protein is highly divergent. In Drosophila AChE, the signal peptide consists of the first 38 amino acid residues and the mature protein starts from V39, as has been shown by protein sequencing (Haas et al., Reference Haas, Marshall and Rosenberry1988). By alignment of Bo AChE and Dm AChE, the predicted cleavage site between the signal sequence and the mature protein is predicted between G55 and V56, a point where the Bo AChE sequence starts being highly homologous to that of Drosophila. Subsequent analysis with signal P (3.0) (Nielsen et al., Reference Nielsen, Engelbrecht, Brunak and von Heijne1997) illustrated a unique cleavage site between G55 and V56, confirming that the putative precursor enzyme consists of a mature enzyme of 618 amino acids and a signal of 55 amino acid residues targeting the protein for secretion pathway.
Hydrophilic peptide
The endoproteolytic cleavage of the 75 kDa precursor protein into two non-covalently linked polypeptides takes place in the hydrophilic region (Mutero & Fournier, Reference Mutero and Fournier1992). In Drosophila AChE, this site is located between R148 and P180. By alignment, the corresponding region in the B. oleae AChE peptide sequence is located between R165 and P195, an equally hydrophilic area that exhibits almost complete amino acid identity with Drosophila's.
C-terminal signal peptide
The predominant form of AChE in insects is a globular amphiphilic dimer attached to the membrane via a GPI anchor (Toutant, Reference Toutant1989). The C-terminal peptide enriched by hydrophobic residues is cleaved and substituted by a covalent linkage of glycosylphosphatidylinositol (GPI) anchor. The C-terminal peptide is of highest divergence region between Drosophila and other insect AChEs. The suspected presence of a GPI-anchor addition signal was investigated using the program big-Pi predictor (Eisenhaber et al., Reference Eisenhaber, Bork and Eisenhaber1999). No potential GPI modification site was identified, although the highest scoring residue was Q642 (−34.93). However, a recent study demonstrated that the C-terminal peptide of B. oleae AChE is, indeed, cleaved and substituted by a GPI anchor (Kakani et al., Reference Kakani, Bon, Massoulié and Mathiopoulos2011).
Post-translational modification sites
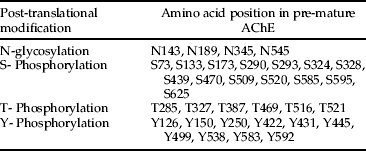
Since AChE is directed in the secretion pathway and ER-imported proteins are in contact with the N-glycosylation machinery, the presence of potential N-glycosylation sites (N-x-S/T) was analyzed using NetNClyc 1.0 (Gupta et al., in preparation). The NetNClyc analysis of B. oleae AChE sequence revealed four potential sites, N88, N134, N290 and N490, which are located in hydrophilic regions of the protein and are equivalent to N-glycosylation sites of Drosophila (four out five). Furthermore, the sequence of B. oleae AChE contains multiple phosphorylation sites, many of which are common in Drosophila AChE. The NetPhos 2.0 (Blom et al., Reference Blom, Gammeltoft and Brunak1999) predicted 31 potential phosphorylation sites, 15 serine, 6 threonine and 10 tyrosine residues. Table 4 presents all the post-translational sites.
Predicted potential post-translation modifications sites of B. oleae ace.
Codon usage
The genetic code is redundant; and, as a consequence, genes and species may exhibit particular preferences in codon usage. Generally, pattern of codon usage is similar among closely related species but differs significantly among distantly related organisms. Codon usage pattern for B. oleae AChE sequence was examined via GCUA 2.0 software (Fuhrmann et al., Reference Fuhrmann, Hausherr, Ferbitz, Schödl, Heitzer and Hegemann2004) compared to codon usage table of B. oleae, as well as to AChE of invertebrate and vertebrate species. As shown in fig. 4A, the calculated frequencies of each codon of AChE are in agreement with the preferred codon of B. oleae for each amino acid. In addition, fig. 4B illustrated that the frequencies of each AChE codon are similar among closely related species, such as B. oleae, B. dorsalis and C. capitata, and differs significantly among distantly related organisms, such as B. oleae and H. sapiens, possibly indicating a closer functional similarity of the enzyme in more closely related species.
Bactrocera oleae's AChE codon usage comparisons. (A) Codon usage of B. oleae AChE compared to the codon usage table of B. oleae genome by GCUA (Fuhrmann et al., Reference Fuhrmann, Hausherr, Ferbitz, Schödl, Heitzer and Hegemann2004). Codon frequencies of the B. oleae were retrieved from Codon Usage Database (http://www.kazusa.or.jp/codon/). The x-axis presents the amino acid and the corresponding codons, whereas the y-axis presents the relative adaptiveness of each codon. The basic principle for deriving relative adaptiveness values from codon usage frequency values is as follows: for each amino acid, the codon with the highest frequency value is set to 100% relative adaptiveness; all other codons for the same amino acid are scaled accordingly. Light and dark green columns (printed version: black and white, respectively) correspond to the ace gene and the entire (known) transcriptome of the olive fly, respectively. (B) Codon usage of B. oleae AChE compared to AChE of other organisms (vertebrate and invertebrate) by GCUA 2.0 (Fuhrmann et al., Reference Fuhrmann, Hausherr, Ferbitz, Schödl, Heitzer and Hegemann2004). Codon frequencies of the compared organisms were retrieved after their ace GCUA analysis (data not shown). The x-axis presents the amino acid and the corresponding codons, whereas the y-axis presents the relative adaptiveness of each codon. Green column, Β. oleae; yellow column, Β. dorsalis; orange column, C. capitata; light blue column, Η. sapiens; dark purple column, Μ. musculus (printed version: black column, Β. oleae; dot-patterned column; Β. dorsalis; grey column, C. capitata; diamond-patterned column, Η. sapiens; white column: Μ. musculus).

Discussion
Cholinesterases have been proved to be most fascinating research topics and still raise a number of fundamental questions in enzymology and cell biology. Insect AChEs have been of particular interest because of their critical role in cholinergic neurotransmission and singularly of their implication in insecticide resistance, as they are targets of OP and CB pesticides. In the present study, we report the genomic organization and molecular properties of B. oleae ace in an effort to expand our knowledge on insect AChEs.
The genomic organization of the B. oleae ace locus was determined by screening a genomic lambda library and different PCR approaches (long and inverse). We determined that the olive fly acetylcholinesterase gene expands for at least 75 kb in division 34 on the chromosome arm IIL. The genomic organization of the ace locus in B. oleae consists of ten exons and nine introns. There is a considerable conservation among most exons of Diptera AChEs but extensive divergence in intron structure, although intron-exon boundaries are identical to the Dm ace gene (Fournier et al., Reference Fournier, Karch, Bride, Hall, Berge and Spierer1989; Hall & Malcolm, Reference Hall and Malcolm1991; Mori et al., Reference Mori, Lobo, deBruyn and Severson2007). We were not able to clarify the exact length of introns 1 and 5, most likely due to the fact that their sizes were beyond the limits of either the insert size of the lambda vector or the long PCR. Introns 1 and 5 are the largest introns in D. melanogaster with 11,648 bp and 5019 bp, respectively (Fournier et al., Reference Fournier, Karch, Bride, Hall, Berge and Spierer1989). Intron 1 is also the largest in A. aegypti with a length of 114,350 bp of the 138,970 bp ace genome region (Mori et al., Reference Mori, Lobo, deBruyn and Severson2007). Intron 1 is located in 5΄ UTR, and 5΄-ward introns are known to be larger than introns between coding exons, because of the possibility of their general use as hosts for regulatory elements (Duret, Reference Duret2001; Pesole et al., Reference Pesole, Mignone, Gissi, Grillo, Licciulli and Liuni2001; Hong et al., Reference Hong, Scofield and Lynch2006). Hong et al. (Reference Hong, Scofield and Lynch2006) showed that D. melanogaster presents a greater proportion of introns in the 5΄ UTR and fewer overall introns per transcript; approximately 33% of D. melanogaster's intronic bp within 3424 transcripts is found within 5΄ UTR. Accordingly, intron 1 might also be the largest in the B. oleae ace gene. If this claim is, indeed, right, then intron 1 would be over the 14,000 bp of intron 7; and, consequently, it is reasonable not to be intact within a single bacteriophage.
With the exception of intron 3, the Bo ace gene contains introns larger than those of D. melanogaster. A characteristic example is intron 8: in D. melanogaster it is only 118 bp; while in the olive fly, it has been determined to be approximately 8000 bp. According to Bartolomé et al. (Reference Bartolomé, Maside and Charlesworth2002) and Maxwell & Fournier (Reference Maxwell and Fournier1995), intron size is possibly influenced by the insertion of transposable elements or the presence of RNA genes. The nBlast search of Bo ace introns lends support to these claims. Due to the presence of large introns, the B. oleae ace genomic sequence is at least 2.5-fold larger than the Dm ace that is contained within 34 kb of DNA. The difference in intron length undoubtedly reflects overall genome differences in genome organization among species, as the size of the Dm genome is ∼1.4 × 10⁸ bp (Adams et al., Reference Adams, Celniker, Holt, Evans and Gocayne2000), whereas the Bo size is ∼3.22 × 10⁸ bp (Tsoumani & Mathiopoulos, Reference Tsoumani and Mathiopoulos2011). This picture has emerged also from A. aegypti; its ace gene is contained within a 138,970 bp of DNA and its genome size is ∼8.1 × 10⁸ bp (Warren & Crampton, Reference Warren and Crampton1991; Mori et al., Reference Mori, Lobo, deBruyn and Severson2007).
The full-length precursor mRNA B. oleae ace is comprised of a 2022 bp open reading frame that encodes the 673 amino acid protein (Vontas et al., Reference Vontas, Hejazi, Hawkes, Cosmidis, Loukas, Janes and Hemingway2002). We identified approximately 1200 bp upstream from start codon (5′ UTR), but we were not able to obtain the transcription initiation site. The amino acid sequence of B. oleae acetylcholinesterase has a high degree of homology with other insects’ sequences available. The Bo AChE exhibits all the common structural and functional features of the protein. The hydropathy profile showed two hydrophobic and one hydrophilic region, supporting the notion that Bo AChE is a secretory protein, undergoes proteolytic cleavage and is attached to the membrane. The N-terminus peptide that is required for transport into the ER and is concomitantly cleaved off leaving the mature protein was confirmed bioinformatically, whereas the hydrophilic region was confirmed by alignment. The signal peptide is 55 amino acids long and contains 23% serine, in contrast to 38 amino acid signal peptide with 13% serine of Drosophila. The N-signal peptides of L. cuprina, M. domestica and H. irritans are 74, 80 and 91 amino acids long and contain 36%, 66% and 60% serine, respectively (Temeyer & Chen, Reference Temeyer and Chen2007). There is a likely relationship between the length of the signal peptide and its serine content. However, the functional or structural role of this relationship, if any, has not yet been determined. The very serine-rich signal peptides (homopolymer stretches of serines) that have been found in M. domestica and H. irritans are hypothesized to be involved in protein folding, recruitment of folding chaperones or targeting the nascent protein for membrane attachment (Temeyer & Chen, Reference Temeyer and Chen2007). The hydrophilic region appears to be unique to insect acetylcholinesterases and has no equivalent in either nematode or vertebrate enzymes (Massouliè et al., Reference Massoulié, Pezzementi, Bon, Krejci and Vallette1993; Combes et al., Reference Combes, Fedon, Toutant and Arpagaus2001), supporting the hypothesis that proteolytic cleavage of the AChE precursor protein could be a common characteristic of the ace gene, at least in Diptera. The C-terminal hydrophobic region of the protein, encoded from last exon, governs its eventual cellular localization. It is known that the proper function of AChE does not only require an efficient catalytic activity but also a precise localization of the enzyme (Massouliè et al., Reference Massoulié, Pezzementi, Bon, Krejci and Vallette1993). The predominant form of B. oleae is an amphiphilic dimer, while C-terminus hydrophobic region is cleaved and substituted by a GPI anchor (Kakani et al., Reference Kakani, Bon, Massoulié and Mathiopoulos2011). Although both the Drosophila and the housefly enzymes (and generally insects AChEs) also have a glycophospholipid anchor at the C terminus (Fournier et al., Reference Fournier, Bergé, Cardoso de Almeida and Bordier1988; Haas et al., Reference Haas, Marshall and Rosenberry1988), the exon that determines this mode of attachment is extensively divergent.
Bioinformatic analysis of post-translational modifications suggests that B. oleae sequence has four potential Asn-linked carbohydrate chains. Human BuChE has nine sites, while Torpedo has four, but only two are common with human BuChE and none of these sites exactly correspond to a glycosylation site in Drosophila AChE (MacPhee-Quigley et al., Reference MacPhee-Quigley, Taylor and Taylor1985; Lockridge et al., Reference Lockridge, Adkins and La Du1987; Fournier et al., Reference Fournier, Karch, Bride, Hall, Berge and Spierer1989; Sussman et al., Reference Sussman, Harel, Frolow, Oefner, Goldman, Toker and Silman1991). Although the number and location of glycosylation sites are not well conserved throughout the cholinesterase family, B. oleae and D. melanogaster present exactly the same glycosylation sites, as well as most of the phosphorylation sites. Furthermore, B. oleae AChE presents three disulfide bonds (Vontas et al., Reference Vontas, Hejazi, Hawkes, Cosmidis, Loukas, Janes and Hemingway2002) that are in the same locations as in Drosophila. Last but not least, comparison of ace codon frequencies across different genomes indicated that there is a tightly conserved choice of optimal codon correlated with evolutionary distance. Tsoumani & Mathiopoulos (Reference Tsoumani and Mathiopoulos2011) have recently demonstrated that there is a divergence of codon usage and choice of optimal codons as the evolutionary distance between B. oleae and the examined organisms increased.
It is well established that correct folding of the AChE enzyme is essential for obtaining a functionally active protein (Massoulié et al., Reference Massoulié, Pezzementi, Bon, Krejci and Vallette1993). Albeit with differences, the olive fly's AChE possesses characteristic structural features that other insect enzymes (and beyond) also possess (e.g. disulfide bonds, post-translational sites, etc.). This structural similarity would suggest a corresponding folding similarity of the mature enzyme. In addition, the fact that B. oleae's AChE codon usage is more similar in closely related species may indicate a closer functional similarity of the enzyme in phylogenetically related species. Such structural and functional similarity among closely related AChE enzymes may implicate similarities in insecticide resistance mechanisms. In fact, several insecticide resistance mutations that have been isolated in different insect genera were shown to alter corresponding amino acids (Fournier, Reference Fournier2005). For example, the I214 V substitution in B. dorsalis (Hsu et al., Reference Hsu, Hymer, Wu and Feng2006) is identical to the I214 V in B. oleae (Vontas et al., Reference Vontas, Hejazi, Hawkes, Cosmidis, Loukas, Janes and Hemingway2002) and equivalent to the I199 V in Drosophila (Mutero et al., Reference Mutero, Pralavorio, Bride and Fournier1994). Most of them lie in the catalytic gorge of the enzyme. The mutated amino acids are usually larger, thus hindering the entrance of the insecticide in the gorge. However, there have also been a few ‘unique’ mutations that have been isolated in certain species. A characteristic example is the Δ3Q mutation of the olive fly that lies in the C-terminal domain of AChE, well outside its catalytic gorge (Kakani et al., Reference Kakani, Ioannides, Margaritopoulos, Seraphides, Skouras, Tsitsipis and Mathiopoulos2008), pointing at an entirely different mechanism of resistance (Kakani et al., Reference Kakani, Bon, Massoulié and Mathiopoulos2011). Δ3Q mutation results in improved GPI-anchoring of AChE and, therefore, an increased number of GPI-anchored molecules in the synaptic cleft, which may reduce the sensitivity to insecticides. Do other insects possess such resistance mechanisms? Given the structural and functional similarity of the enzyme, there is no reason to think that such a mechanism is unique to the olive fly. In Bactrocera dorsalis, a C-terminal mutation (Q643R) has been isolated from OP resistant flies (Hsu et al., Reference Hsu, Hymer, Wu and Feng2006). Q643 is one of the three glutamines that is absent in B. oleae's Δ3Q, supporting the notion that this area contributes to the development of resistance. However, its role has not been elucidated yet. Be that as it may, only further detailed and careful investigation of the target genes of insecticides can disclose the intricate details of resistance.
Acknowledgements
This research was partially supported by a Research Potential Support Program of the General Secretariat of Research and Technology of the Ministry of Development, Greece and the two postgraduate programs of the Department of Biochemistry and Biotechnology of the University of Thessaly (‘Biotechnology - Nutrition and Environment’ and ‘Molecular Biology and Genetics applications’).
Supplementary material
The online figure can be viewed at http://journals.cambridge.org/ber.



