


Introduction
Evidence-based conservation planning can be hindered by a lack of robust data on key ecological parameters, including species distributions and environmental requirements (Christie et al. Reference Christie, Amano, Martin, Petrovan, Shackelford and Simmons2021). Such data-gaps may constitute a particular problem for tropical island birds, which have experienced extensive extinctions and exhibit high current-day risk (Spatz et al. Reference Spatz, Zilliacus, Holmes, Butchart, Genovesi and Ceballos2017; Steadman Reference Steadman2006a), but are often the focus of limited conservation research (de Lima et al. Reference de Lima, Bird and Barlow2011). Worryingly, island taxa often represent global conservation priorities on the basis of evolutionary history, reflecting their geographical isolation and adaptation to novel environments (Jetz et al. Reference Jetz, Thomas, Joy, Redding, Hartmann and Mooers2014).
It is therefore important to assess the information-content of alternative data types with relevance for establishing management baselines. One such data source is the historical record, which has the potential to provide unique insights into past species distributions and ecosystem composition, dynamics and drivers of declines, and vulnerability and resilience to environmental change (McClenachan et al. Reference McClenachan, Ferretti and Baum2012; Turvey and Saupe Reference Turvey and Saupe2019). For example, historical data can be used to generate predictive species distribution models (SDMs) for threatened taxa, based upon the statistical relationship between occurrence records and environmental variables (Elith et al. Reference Elith, Phillips, Hastie, Dudík, Chee and Yates2011). Historical baselines are particularly important for generating SDMs for species that now survive only as tiny remnant populations, because understanding the ecological parameters associated with past distributions can indicate whether known populations persist in optimal environments or ecologically marginal refugia, and can identify priority areas to search for possible undetected populations (Lees et al. Reference Lees, Devenish, Areta, de Araújo, Keller and Phalan2021; Lentini et al. Reference Lentini, Stirnemann, Stojanovic, Worthy and Stein2018). However, historical archives are limited and incomplete, for example in terms of resolution and accuracy of past records, due to huge variation in rigour, standardisation and scope of pre-modern recording effort (Newbold Reference Newbold2010). For example, historical data typically represent presence-only data, with reliable absences difficult to determine due to non-systematic recording effort (Graham et al. Reference Graham, Ferrier, Huettman, Moritz and Peterson2004). The usefulness of historical data to establish conservation baselines, provide predictive insights, and resolve questions for particular threatened species is therefore uncertain.
The Manumea or Tooth-billed Pigeon Didunculus strigirostris is an evolutionarily distinct species endemic to the Samoan archipelago. It is historically recorded from the islands of Savai’i (1,820 km2), Upolu (1,110 km2), Nu’utele (1.2 km2), and Nu’ulua (0.2 km2) in the Independent State of Samoa (Collar Reference Collar2015), and is also known from a prehistoric archaeological assemblage on Ofu Island, American Samoa (Weisler et al. Reference Weisler, Lambrides, Quintus, Clark and Worthy2016). It is the only living representative of the genus Didunculus following prehistoric extinction of the Tongan species D. placopedetes (Steadman Reference Steadman2006b) and an unnamed species from Vanuatu (Worthy et al. Reference Worthy, Hawkins, Bedford and Spriggs2015). Although historical abundance is uncertain, the Manumea is thought to have declined by over 90% since the 1980s due to invasive rats and cats, hunting, and habitat loss from human activities and cyclones; it is listed as Critically Endangered by the International Union for Conservation of Nature (IUCN), with only a tiny remnant population likely to survive (Beichle Reference Beichle1987; BirdLife International 2024; Collar Reference Collar2015; Serra Reference Serra2017; Serra et al. Reference Serra, Sherley, Failagi, Foliga, Uili and Enoka2018). A series of recovery actions has been proposed within two consecutive recovery plans, including habitat conservation and management, reduction of hunting, invasive species eradication, establishment of translocated populations and/or an ex situ breeding programme, and increasing public awareness and local conservation capacity (BirdLife International 2024; MNRE 2006; MNRE and SCS 2020).
A first step for practical implementation of field-based conservation actions is to locate any surviving populations or individuals. Several “Manumea Key Rainforest Areas” (MKRAs) have been identified based upon locations of relatively recent sightings or field call detections, including the Falealupo and Central Savai’i Key Biodiversity Areas (KBAs) and the Tafua and Salelologa rainforest on Savai’i, and the Apia catchments and Uafato-Tiavea KBAs on Upolu (MNRE and SCS 2020) (Figure 1A). However, recent records generally derive from opportunistic encounters or one-off surveys of specific sites, making it unclear whether MKRAs represent optimal regions to locate surviving birds.
(A) Map of Samoa, showing the four islands on which Manumea are recorded and locations of Manumea Key Rainforest Areas: 1. Falealupo KBA; 2. Central Savai’i KBA; 3. Tafua and Salelologa rainforest; 4. Apia catchments KBA; 5. Uafato-Tiavea KBA. (B) Distribution of reported acoustic records. (C), Distribution of pre-2000 sightings or historical specimen collection localities. (D) Distribution of post-2000 sightings. KBA = Key Biodiversity Area.

Incomplete knowledge of Manumea ecology also hinders assessing the distribution of suitable habitat. Past observations indicate that Manumea occur in both primary and secondary tropical forest across a relatively wide elevational range, and are closely associated with Dysoxylum trees for feeding, especially D. maota and D. samoense (Beichle Reference Beichle1982, Reference Beichle1987; Collar Reference Collar2015; DuPont Reference duPont1972). Samoa’s three native Dysoxylum species have distinct elevational ranges, with the two preferred food species more widely distributed in lower elevations and replaced by the little-used D. huntii at higher elevations (Whistler Reference Whistler1978, Reference Whistler1980, Reference Whistler1992). However, it is unclear whether Manumea are therefore ecologically excluded from Samoa’s extensive upland areas above 1,000 m elevation (Collar Reference Collar2015); this region includes much of the largest MKRA, the Central Savai’i KBA (MNRE and SCS 2020). Acoustic surveys have also been used in recent efforts to detect Manumea, with the species’ inferred occurrence in some localities based upon interpretation of acoustic data (Baumann and Beichle Reference Baumann and Beichle2020; Serra et al. Reference Serra, Wood, Faiilagi, Foliga, Uili and Enoka2021). However, the Manumea’s call is similar to that of the more common sympatric Pacific Imperial-Pigeon Ducula pacifica and is hard to differentiate in the field even by knowledgeable local hunters, leading to suggestions that at least some purported acoustic records may be misidentifications (Atherton and Jefferies Reference Atherton and Jefferies2012; Baumann and Beichle Reference Baumann and Beichle2020; Pratt and Mittermeier Reference Pratt and Mittermeier2016; Serra et al. Reference Serra, Sherley, Failagi, Foliga, Uili and Enoka2018).
Numerous historical Manumea records are available from field observations and specimen-collecting trips from the nineteenth century onwards (Beichle Reference Beichle1982; Collar Reference Collar2015), but have not been investigated within a quantitative spatial framework to understand the species’ ecology and distribution. To strengthen the Manumea conservation evidence-base, we used historical and modern records to generate a series of SDMs to predict areas of suitable habitat across Samoa. Our findings provide a new baseline to support conservation planning, identify environmental variables that influence Manumea distribution, and assess previous assumptions about its ecology and the potential accuracy of acoustic records reported for the species.
Methods
Presence data
Manumea records were obtained by conducting a thorough survey of the published literature, unpublished grey literature (e.g. conservation plans, survey reports), museum accession records, and online birding trip reports (ebird.org). Museum specimens were identified through the literature, the Global Biodiversity Information Facility (gbif.org), and requests through the Natural Sciences Collections Association (NatSCA) network, with associated locality data accessed from online museum databases and email requests to curators. Presence records were divided into visual/physical observations and recent acoustic-only detections for analysis.
Many locality records lacked coordinate data, so coordinates for these records were calculated by georeferencing locality descriptions using Google Earth (earth.google.com), using consistent rules to reduce spatial bias (Supplementary material Appendix S1). Reported localities that were too vague or general (e.g. “Samoa”, “Savai’i”) were excluded. If multiple records were reported within the same protected area or KBA without further spatial information, records were spaced evenly across the area.
Environmental and land cover variables
Nineteen bioclimatic variables were obtained from WorldClim v.2.1 (worldclim.org) at 30 arc-second resolution. Collinearity and associated potential for model overfitting were minimised by excluding variables displaying high correlation (r >0.8; Elith et al. Reference Elith, Graham, Anderson, Dudík, Ferrier and Guisan2006), preferentially removing variables that showed collinearity with >1 other variable, and leaving seven independent variables for inclusion. Digital elevation data were obtained from CGIAR-CSI GeoPortal v.4 (Jarvis et al. Reference Jarvis, Reuter, Nelson and Guevara2008) at 90-m resolution. A separate slope raster was generated from the elevation data with raster analysis slope tool GDAL v.3.3.0, using default parameters (Lundbäck et al. Reference Lundbäck, Persson, Häggström and Nordfjell2021). A surface soil classification layer was obtained from PacGeo (2017) at 9 arc-second resolution, classified following Allen and Wald (Reference Allen and Wald2009), with high values representing hard rock and low values representing soft soils (Castellaro et al. Reference Castellaro, Mulargia and Rossi2008). Four land cover layers (forest, thicket, surface soil, cropland) dating from March 2015 (1 × 1 cells, scale 1:50,000) were obtained from GEOINT (2015).
Species distribution modelling
Maximum entropy modelling was conducted in MaxEnt v.3.4.4 (Phillips et al. Reference Phillips, Dudík and Schapire2016). This approach can use presence-only data and has superior accuracy compared with other SDM methods when data sets contain <100 unique values, and is the primary method for modelling habitat suitability for species with limited occurrence data (van Proosdij et al. Reference van Proosdij, Sosef, Wieringa and Raes2016; Wisz et al. Reference Wisz, Hijmans, Li, Peterson, Graham and Guisan2008). Analyses were conducted in R v.1.4.1106 (R Core Team 2020).
To reduce potential for spatial autocorrelation and accommodate possible minor inaccuracies in estimating locations from historical descriptions, data were analysed at the pixel resolution of a proxy for Manumea home range. No direct estimates are available for Manumea home range or local/seasonal movements, and home range inference from closely related taxa is not possible because the species is phylogenetically distant from other extant pigeons (Jetz et al. Reference Jetz, Thomas, Joy, Redding, Hartmann and Mooers2014). As home range data are largely unavailable for other tropical Pacific pigeons, an estimate of 4 km2 (2 × 2 km grid cell) was used from the New Zealand Kererū Hemiphaga novaeseelandiae, another large-bodied Pacific pigeon (Baranyovits Reference Baranyovits2017). Presence records were spatially thinned in QGIS v.3.20.0 (QGIS Development Team 2021) using the “random selection within subsets” tool to randomly select one record within each pixel; this method has little effect on model performance (Verbruggen et al. Reference Verbruggen, Tyberghein, Belton, Mineur, Jueterbock and Hoarau2013). Home range diameter (2.257 km) was not used, as distance-based thinning can discard important data from regions with densely concentrated records (Verbruggen et al. Reference Verbruggen, Tyberghein, Belton, Mineur, Jueterbock and Hoarau2013). Environmental layers were resampled to this pixel size in QGIS using median resampling, to allow inclusion of records from coastal regions that are excluded using nearest-neighbour resampling.
Coastal pixels that contain <100% land had reduced likelihood of containing Manumea records, and were effectively sampled with lower effort than non-coastal pixels. A bias file was incorporated that specified the reduced survey effort (due to reduced land availability) within each coastal pixel, expressed as the proportion of the pixel containing land.
Four SDMs were generated to investigate whether different subsets of locality data provided differing habitat suitability predictions, and to enable comparison between data types: (1) “visual reduced”, fitted with all spatially resolved visual/physical presence records (historical and recent) and with environmental layers only (bioclimatic, elevation, slope, soil layers); (2) “visual combined”, fitted with visual/physical presence records from 2000 onwards and with both environmental and modern land cover layers; (3) “acoustic reduced”, fitted with acoustic presence records and environmental layers; (4) “acoustic combined”, fitted with acoustic presence records and with both environmental and modern land cover layers. All acoustic records are recent, so a model containing only recent visual data (visual combined model) was therefore included to allow comparison; these models were fitted with land cover layers as well as environmental layers, as they can be assessed against modern land cover conditions. Conversely, the visual reduced model contained all visual/physical Manumea presence records, which included both historical and recent records and so cannot be assessed against modern land cover conditions; the acoustic reduced model was therefore also included to allow comparison with the visual reduced model and investigate the effect of reduced explanatory variables on model performance. An alternate version of the visual reduced model was also generated using only records where accurate Manumea identification was supported by museum specimens, observations in peer-reviewed scientific papers, or eBird reports by experienced birders.
Two assessments of model fitness were investigated: the area under the receiver operating characteristic curve (AUC) (Fielding and Bell Reference Fielding and Bell1997), and the True Skill Statistic (TSS) (Allouche et al. Reference Allouche, Tsoar and Kadmon2006), with the 10th percentile presence threshold used as the TSS threshold suitability value (Escalante et al. Reference Escalante, Rodríguez-Tapia, Linaje, Illoldi-Rangel and González-López2013). Variables with lowest percentage contribution were removed in a stepwise fashion until the greatest TSS and AUC values were achieved. The best-performing model was selected from the final variable set, and 20 bootstrap replications were run with random seed.
To fit models and evaluate model predictions in the thinned variable set after exclusion of low-contributing variables, 80% of presence records were allocated as training data and 20% as test data (Merow et al. Reference Merow, Smith and Silander2013). Use of 20% as test data was selected because it provided the highest training AUC with only a small reduction in TSS compared with alternative 85:15% or 90:10% data-splits (after exclusion of low-contributing variables: (1) 80:20%, training and test AUC = 0.681 and 0.529, TSS = 0.155; (2) 85:15%, training and test AUC = 0.650 and 0.688, TSS = 0.185; (3) 90:10%, training and test AUC = 0.669 and 0.649, TSS = 0.185).
Projections used to represent final model outputs were based upon average maps generated from 10 replicates, which were then used to generate average training AUC values. This approach was followed to reduce bias that would result from selecting only the best map projections for each model. Thresholds for occupancy likelihood in each model output were calculated from the sum of maximum training sensitivity and specificity (Liu et al. Reference Liu, White and Newell2013), with cumulative thresholds chosen from the first replication of each output.
Spatial autocorrelation in final thinned model residuals was assessed using Moran’s I statistic with the R-package spdep (Bivand et al. Reference Bivand, Altman, Anselin, Assunção, Berke and Blanchet2023). As residuals showed autocorrelation (Moran I statistic standard deviate = -0.00769, P = 0.038), overfitting was addressed by running models twice, using differing regularisation multiplier values of 1 (default) and 2 (Radosavljevic and Anderson Reference Radosavljevic and Anderson2014). Performance of different model outputs was assessed by comparing mean AUCtraining and TSS values from best-performing models.
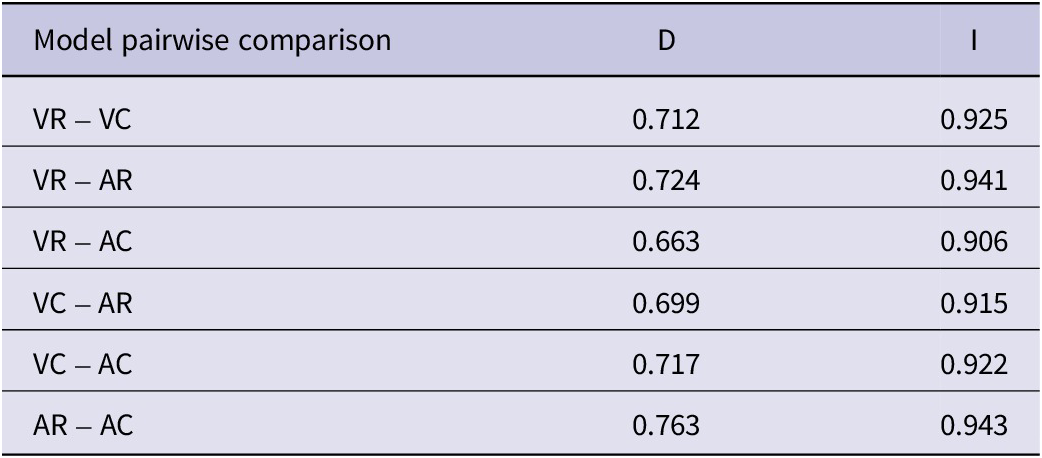
Between-model differences in habitat suitability projections were evaluated through pairwise comparisons in ENMTools (Warren et al. Reference Warren, Glor and Turelli2010), using two similarity measures: Schoener’s index (D; Schoener Reference Schoener1970) and Hellinger distance (I; Warren et al. Reference Warren, Glor and Turelli2008). Both metrics range from 0 (poor similarity) to 1 (high similarity) (Warren et al. Reference Warren, Glor and Turelli2010).
Results
Our initial data set contained 282 Manumea presence records (143 museum records, 139 literature records) from 1872 to 2018. After excluding records without precise locality details, we retained 131 records (28 museum records, 103 literature records) from 1924 to 2018. The final data set included 98 physical/visual-only records, 31 acoustic-only records, and two combined visual+acoustic records (Figure 1B–D, Appendix S2). After data-thinning, the visual reduced model included 74 records (Savai’i: 31, Upolu: 42, Nu’utele: 1), the visual combined model included 62 records (Savai’i: 22, Upolu: 39, Nu’utele: 1), and the acoustic models included 28 records (Savai’i: 18, Upolu: 7, Nu’utele: 3).
Using the default regularisation multiplier value, our four main models all had average (>0.7), good (>0.8) or excellent (>0.9) AUC values, but lower TSS values (<0.45). The acoustic combined model had the highest model fitness after removing seven variables (mean AUCtraining = 0.910, TSS = 0.442). Similar model fitness was shown by the acoustic reduced model after removing five variables (mean AUCtraining = 0.832, TSS = 0.359), and the visual reduced model after removing four variables (mean AUCtraining = 0.881, TSS = 0.354). The visual combined model had the lowest model fitness after removing four variables (mean AUCtraining = 0.718, TSS = 0.193). Variable contribution that explained >70% of variation differed across the four final models, with different variables associated with probability of Manumea presence (visual combined: BIO12, BIO17, slope, elevation; visual reduced: forest, slope, elevation, soil hardness, BIO12; acoustic combined: forest, BIO2, soil hardness, cropland; acoustic reduced: soil hardness, BIO12, BIO17, BIO2). Elevation explained ≥10% of variation in three of the four final models (visual combined, visual reduced, acoustic reduced). Probability of Manumea presence had ≥0.5 probability close to sea level in both visual models and declined in probability with increasing elevation, dropping to almost 0 probability around 1,000 m a.s.l. in the visual combined model, but with a second peak of almost 0.5 probability at 1,770 m a.s.l. in the visual reduced model. Conversely, probability of presence had a fairly constant relationship with elevation (<0.5 probability) across Samoa’s elevational profile in the acoustic reduced model, with slight probability peaks at lowest and highest elevations (Table 1, Appendix S3).
Percentage contribution of variables to final models. Variables removed from final models indicated by dashes. Positive correlations shown in bold, negative correlations shown in italics. VR = visual reduced model; VC = visual combined model; AR = acoustic reduced model; AC = acoustic combined model

The two visual models predict similar areas of habitat suitability on Upolu, with much of the island’s raised and forested east–west axis (including the Apia catchments and Uafato-Tiavea KBAs) identified as having high habitat suitability, as well as several small low-elevation regions along the southern coast. These models predict little suitable habitat in Savai’i, with only the Falealupo KBA, the Tafua and Salelologa rainforest, and other small discrete northern and southern low-elevation coastal areas identified as suitable by the visual combined model, and far fewer areas identified by the visual reduced model. The two acoustic models similarly predict that parts of the central axis of Upolu represent suitable habitat, but also predict higher habitat suitability for the northern low-elevation areas of Upolu, and some additional northern and western low-elevation coastal regions of Savai’i. The acoustic reduced model also predicts that a large area of the Central Savai’i KBA, including the highest-elevation central region of this island, represents good-quality habitat; the acoustic combined model predicts some good-quality habitat in this region, although across a smaller area. All models predict high suitability for Nu’utele (Figure 2). Spatial congruence was highest between both acoustic models, and lowest between the visual reduced and acoustic combined models (Table 2, Figure 3).
Manumea species distribution models: (A) visual reduced model (threshold: 37.894); (B) visual combined model (threshold: 53.459); (C) acoustic reduced model (threshold: 48.671); (D) acoustic combined model (threshold: 34.258). See main text for method used to determine occupancy likelihood thresholds.

Pairwise comparisons of models compared using Schoener’s index (D) and Hellinger distance (I). VR = visual reduced model; VC = visual combined model; AR = acoustic reduced model; AC = acoustic combined model
Pairwise comparisons between models: (A) visual reduced–visual combined; (B) visual combined–acoustic combined; (C) visual reduced–acoustic combined; (D) visual combined–acoustic reduced; (E) visual reduced–acoustic reduced; (F) acoustic reduced–acoustic combined.

The best-performing alternate visual reduced model based upon better-confirmed records included only 25 records after data-thinning (Savai’i: 9, Upolu: 15, Nu’utele: 1), and performed less well than the full visual reduced model (mean AUCtraining = 0.786, TSS = 0.302). This model mainly predicted low-elevation coastal areas as having high habitat suitability, along with central Upolu (Appendix S4). Models generated with the increased regularisation multiplier (value = 2) also performed less well, with lower AUC values that were only average (>0.7) or good (>0.8), and lower (<0.4) TSS values. The acoustic combined model had highest fitness after removing eight variables (mean AUCtraining = 0.823, TSS = 0.377), closely followed by the visual combined model after removing eight variables (mean AUCtraining = 0.810, TSS = 0.221). The two reduced models showed lower fitness (acoustic reduced: mean AUCtraining = 0.765, TSS = 0.153; visual reduced: mean AUCtraining = 0.726, TSS = 0.122). Final model outputs contained differing variables that together explained >70% of variation (acoustic combined: BIO6, BIO17, slope, cropland, soil surface, woodland; acoustic reduced: BIO2, BIO6, BIO17, slope, soil hardness; visual combined: BIO6, BIO17, slope, elevation, cropland, woodland; visual reduced: BIO12, BIO14, BIO17, slope, soil hardness). Slope and BIO17 were retained in all four final models, explaining ≥8% and ≥7% of variation respectively, whereas elevation remained in only one of the final models (visual combined), explaining >19% of variation (Appendix S5).
Discussion
In this study, we explored the potential for pre-modern records of the Critically Endangered Manumea to provide new insights into the ecology and possible current distribution of this extremely threatened bird, and compare spatial and habitat predictions and information-content of different available record types. As is unfortunately the case with many long-term baselines for threatened species (Newbold Reference Newbold2010), many older records lack sufficiently detailed or precise locality information and could not be incorporated into SDMs. We had to exclude 116 of 136 available museum records and could only utilise records from four out of 27 museums that contained Manumea specimens (Appendix S2), and an alternate visual reduced model that only used better-supported data was limited to 25 records and had lower support. Similar data limitations may also exist with museum specimens for other insular taxa, for which older accession records may only report their island of origin rather than specific geographical information needed for environmental analysis (Collar et al. Reference Collar, Fisher and Feare2004). However, we were still able to utilise spatially well-resolved records spanning much of the twentieth century, representing a unique data source that can test and challenge assumptions about Manumea ecology and distribution, and with important implications for conservation.
MaxEnt performed relatively well in predicting habitat suitability for all models based on AUC values (all >0.7), but the relative contributions made by different explanatory variables varied between models. Here we only discuss outputs from models generated with the default regularisation multiplier value, as these models performed better than those generated using a higher value, although we note the additional differences in explanatory variable contribution between these model sets.
Forest cover provided a high percentage contribution (>30%) in models within which recent land cover data could be included (visual combined and acoustic combined), as expected for a species known to be associated with forest, with this strong relationship thus reducing the relative contribution made by other variables. Correlation with cropland and surface soil (inverse relationships in response curves) provided a further >20% percentage contribution in the acoustic combined model and >10% in the visual combined model, giving additional support for the importance of forest cover in predicting Manumea distribution compared with other variables. The higher contribution of bioclimatic variables within both reduced models, notably annual precipitation and precipitation of the driest quarter, also likely represents a proxy for forest cover, since these variables are associated with regulating tropical rainforest distribution (Corlett and Primack Reference Corlett and Primack2011).
A positive relationship with increasing soil hardness provided a high percentage contribution (33.4%) within the acoustic reduced model. Soil conditions might represent a further proxy for forest cover, explaining the high contribution of the variable to this reduced model where land cover is not included. Alternatively, this correlation might indicate a more specific Manumea habitat preference. Harder soils within tropical forests can be associated with higher-elevation sloped regions (Hattori et al. Reference Hattori, Sabang, Tanaka, Kendawang, Ninomiya and Sakurai2005). Conversely, a negative relationship is seen between elevation and likelihood of occurrence in both visual models, consistent with the suggestion that Manumea are less likely to occur at higher elevations where preferred Dysoxylum food species are replaced by D. huntii. However, soil hardness, elevation and slope provide relatively low percentage contributions in most models (<15%), indicating they are generally poor predictors of Manumea distribution, and thus not excluding the possibility that Manumea might occur at high elevations across Savai’i and Upolu. Indeed, elevation remained in only one of the final models generated with the higher regularisation multiplier value, although slope was retained in all of these models.
Our SDMs predict different spatial patterns of habitat suitability across Samoa, with practical implications for understanding Manumea ecology and where to focus spatial search effort for surviving individuals. Threatened species often become restricted to ecologically marginal high-elevation refugia as populations decline (Fisher Reference Fisher2011; Turvey et al. Reference Turvey, Crees and Di Fonzo2015), raising the possibility that models which only include recent Manumea records might show more restricted niche predictions compared with models also containing older records. Indeed, Steadman (Reference Steadman2006b) suggested that Manumea survived on Samoa but died out on Tonga because Savai’i and Upolu are larger, higher and steeper islands. However, this possibility is contradicted by the relatively high spatial congruence between our visual reduced model (historical and recent visual records) and our visual combined model (recent-only visual records), and the negative correlation and low percentage contribution of elevation across our models, providing little evidence for elevational change in Manumea records over the past century. If Manumea were already rare by the nineteenth century, as suggested by several contemporary observers (Collar Reference Collar2015; Layard Reference Layard1876; Ramsay Reference Ramsay1864; Stair Reference Stair1897), it is possible that niche contraction caused by anthropogenic pressures might have already occurred before the period represented by our historical data set. However, although there has not been extensive recent search effort in remote high-elevation landscapes, some of the few recent verified Manumea sightings are from very low elevations (MNRE and SCS 2020), and these areas are highlighted as suitable in the alternate visual reduced model based only upon better-supported records. A similar pattern of minimal range change as populations decline toward extinction is also observed in some other extremely rare species, possibly associated with across-landscape movements tracking spatially fluctuating resource availability (Turvey et al. Reference Turvey, Barrett, Hart, Collen, Hao and Zhang2010). If Manumea do persist across broadly the same environmental range, this might be associated with unpredictable fruiting periodicity and spatiotemporal resource patchiness in Dysoxylum (e.g. mast fruiting), with birds potentially exhibiting nomadic behaviour in following food resources. This spatial behaviour is seen widely in nectarivorous and frugivorous tropical Pacific birds (Brown and Hopkins Reference Brown and Hopkins1996; Smetzer et al. Reference Smetzer, Paxton and Paxton2021).
Conversely, our visual and acoustic models exhibit reduced congruence in pairwise comparisons, with distinct spatial differences in predicted habitat suitability across Samoa. This variation might reflect differences in the distribution of valid Manumea source data used for each pair of models. Non-congruent model predictions can result from spatial unevenness and bias between data sets, typically when data represent opportunistic detections rather than systematic region-wide survey effort. This can lead to variation in statistical associations between records from different landscapes and locally specific environmental parameters (Turvey et al. Reference Turvey, Kennerley, Hudson, Nuñez-Miño and Young2020). For example, visual records may be spatially skewed toward sites where observations can be made across wide areas (e.g. forest sites with viewing platforms). Conversely, predicted habitat suitability at higher elevations of central Savai’i shown by the acoustic models likely reflects the recent focus of acoustic survey effort and associated clustering of acoustic detections within this region (MNRE and SCS 2020). In contrast, a three-week survey of this region in 2012 produced only one uncorroborated visual record (Atherton and Jefferies Reference Atherton and Jefferies2012). However, this partial mismatch between predictions from visual versus acoustic models is also consistent with the suggestion that at least some acoustic records might not actually represent Manumea calls, and we cannot discount this concerning possibility. Indeed, the Pacific Imperial-Pigeon is distributed widely across upland regions of Savai’i (Atherton and Jefferies Reference Atherton and Jefferies2012; Reed Reference Reed1980), consistent with the suggestion that this species is an alternative candidate for this region’s acoustic records. Further investigation of all purported acoustic records using spectrographic analysis is therefore essential before using them for further planning (Baumann and Beichle Reference Baumann and Beichle2020; Serra et al. Reference Serra, Wood, Faiilagi, Foliga, Uili and Enoka2021).
Given these considerations about model congruence and potential data accuracy, we suggest that initial field-based searches for Manumea should target areas that represent high habitat suitability across all models. This approach would prioritise surveys across the forested central axis of Upolu (also highlighted by the alternate visual reduced model), and including the Uafato-Tiavea KBA to the east, which together constitute the largest continuous or semi-continuous region of predicted suitable habitat in all models. We also recommend surveys in discrete low-elevation coastal forest regions identified as suitable habitat. These regions include the Falealupo KBA and the Tafua and Salelologa rainforest on Savai’i, and Nu’utele island, which may all represent more accessible survey sites compared with the high-elevation interior of both main islands. We do not exclude the importance of also surveying the Central Savai’i KBA, but varying SDM evidence for extensive suitable habitat in this remote region suggests that limited conservation resources should possibly be prioritised elsewhere to begin with. We note that these areas of high predicted habitat suitability derived from our models are spatially congruent with some MKRAs that are based upon recent Manumea detections, but also highlight other landscapes not currently prioritised as MKRAs (MNRE and SCS 2020). It is also important to recognise that SDMs are only able to generate predictions about distribution of inferred habitat suitability based upon available environmental parameters (Franklin Reference Franklin2009). This does not necessarily indicate continued survival of target species (Loiselle et al. Reference Loiselle, Howell, Graham, Goerck, Brooks and Smith2003), and it is unfortunately likely that Manumea have been extirpated from most areas of good-quality habitat, reflecting an example of “empty forest” syndrome (Wilkie et al. Reference Wilkie, Bennett, Peres and Cunningham2011).
Due to limited availability of high-resolution environmental layers for Samoa, our spatial analyses could only include a single forest layer for investigating land cover. We encourage additional research into the relationship between Manumea records and variation in forest structure and quality to further determine habitat factors that might regulate the species’ distribution, to help address the recognised need to understand its ecology (MNRE and SCS 2020). In particular, we recommend quantitative mapping of cyclone damage to Samoa’s forests (BirdLife International 2024; Collar Reference Collar2015), and more detailed analysis of Manumea occurrence in relation to different primary/secondary and lowland/upland forest types across Samoa (Whistler Reference Whistler1978, Reference Whistler1980, Reference Whistler1992). Specifically, such analysis should assess Manumea occurrence in relation to the elevational ranges, distributions, and specific ecological requirements of preferred food trees (Dysoxylum maota and D. samoense). Such investigations would provide a better understanding of whether Manumea distribution is regulated by specific local-scale environmental factors that could not be incorporated within our region-wide models. Further insights into Manumea ecological tolerances could also potentially be obtained through assessment of past environmental parameters associated with prehistoric Didunculus remains.
However, the habitat suitability projections established in this study represent a new baseline to support existing conservation planning for Samoa’s national bird. They can contribute toward the priority objectives defined in the 2020–2029 Manumea recovery plan, notably by helping to define proposed MKRA boundaries (objective 2.1), and to understand relevant aspects of Manumea ecology (objective 5.5) (MNRE and SCS 2020). Although the development of effective standardised methods for detecting Manumea in the field is recognised as a top priority, our model outputs can be used to help guide searches for surviving birds once appropriate survey methods are identified, notably through highlighting new landscapes as potential priority areas alongside recognised MKRAs. We hope that our research can thus contribute toward efforts to prevent the possible imminent extinction of this remarkable species. We also recommend further use of ecological data associated with past records to inform decision-making for other poorly known threatened species in urgent need of evidence-based conservation.
Supplementary material
The supplementary material for this article can be found at http://doi.org/10.1017/S0959270924000133.
Acknowledgements
We thank Imperial College London and Research England for financial support. We thank Nigel Collar for access to literature, and Rhian Rowson (Bristol Museum & Art Gallery) and the Natural Sciences Collections Association network for providing information on museum collections.



