

INTRODUCTION
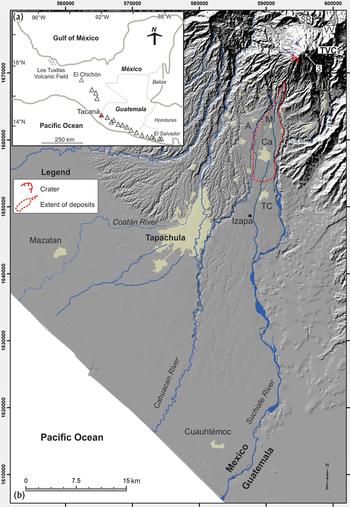
The Tacaná volcano lies in the State of Chiapas in southern Mexico and in the San Marcos Department in Guatemala. Shared by the two countries, the summit delineates the international boundary along with the Suchiate River to the southeast (Figure 1b). The volcano has an elevation of 4,060 m above sea level (hereafter, all elevations are given in meters above sea level) and represents the highest altitude in the State of Chiapas. On the Guatemalan side, Tacaná has a relative elevation of 1,560 m with respect to the San Rafael River and the Vega del Volcán village (Figure 1b). On the Mexican side, the volcano practically rises from the northern outskirts of the modern city of Tapachula, situated at an elevation of 170 m. Tacaná lies at the eastern edge of the Soconusco, a 240-km-long region between the Sierra Madre del Sur and the Pacific coast that stretches from the town of Pijijiapan, Chiapas, to a few kilometers beyond the Mexico-Guatemala border (Voorhies Reference Voorhies and Voorhies1989). The Soconusco is renowned for its annual rainfall (2,320 mm yearly average at Tapachula), one of highest in Central America, and its fertile soils that accommodated the cultivation of maize, cacao, and other agricultural products.
(a) Sketch map showing the location of Tacaná at the Mexico-Guatemala border. (b) Digital elevation model of the Tacaná volcano region. Notice the main drainage system around the volcano and the alluvial/pyroclastic fan where Tapachula and other towns are settled. A, Ahuacatlán; Ca, Cacahoatán; TC, Tuxtla Chico; SR, San Rafael; and VV, Vega del Volcán. Red dashed line indicates the maximum extent of the pyroclastic flow deposits of the San Antonio eruption (30 b.c.–a.d. 80 eruption). Numbers and circles on top of Tacaná correspond to location photographs of Figure 3. Image prepared by Guillermo Cisneros.

Reliance on maize agriculture intensified in the region by 1000 b.c. (Rosenswig et al. Reference Rosenswig, VanDerwarker, Culleton and Kennett2015) and by the Late and Terminal Formative periods (300 b.c.–a.d. 250) salt extraction between the coastal zone and the northeast of the Río Cahuacán increased (Neff Reference Neff2014). Agricultural and economic endeavors are intimated in the imagery on stelae from the site of Izapa, which were carved during the Guillén phase, now placed at 300–100 cal b.c. (Lowe et al. Reference Lowe, Lee and Espinoza1982, Reference Lowe, Ekholm and Clark2013). Several of these Late Formative monuments feature scenes with canoes, maize deities, and rain gods (Guernsey Reference Guernsey2006), and reflect environmental and socioeconomic concerns related to rain, water control, and transportation by canoe (Guernsey Reference Guernsey2018). This fertile zone of Mesoamerica is also subject to a number of natural phenomena including earthquakes, floods, landslides, and volcanic eruptions, which continue to pose a serious risk to modern cities and small villages (Macías et al. Reference Macías, Arce, García-Palomo, Mora, Layer and Espíndola2010, Reference Macías, Arce, Layer, Saucedo, Mora, Scholamacchia and Macías2015).
During the past 20 years, the Soconusco was severely impacted by two hydrometeorological events, Tropical Storm Earl in 1998 and Hurricane Stan in 2005 (Caballero et al. Reference Caballero, Macías, Palomo, Saucedo, Borselli, Sarocchi and Sánchez-Núñez2006; Gutierrez Reference Gutierrez and Lesure2011; Murcia and Macías Reference Murcia and Macías2009). These extreme events elicited enough water to exceed monthly to yearly records in a few days as recorded at Motozintla (Caballero et al. Reference Caballero, Macías, Palomo, Saucedo, Borselli, Sarocchi and Sánchez-Núñez2006) and Coatán (Murcia and Macías Reference Murcia and Macías2009). The excessive amount of water forced into the rivers eroded their channels and exposed a record of past events in Motozintla (Sánchez-Núñez et al. Reference Sánchez Núñez, Macías, Zamorano, Saucedo, Hernández and Novelo2012, Reference Sánchez Núñez, Macías, Saucedo, Zamorano, Novelo, Mendoza and Hernández2015) and Tapachula (Murcia and Macías Reference Murcia and Macías2009). These findings confirm that the region of Soconusco and the northern Motozintla basin have been continually, and catastrophically, affected by floods. Voorhies and Kennett (Reference Voorhies and Kennett1995), who walked the rivers between Pijijiapan and Mazatán, reported evidence of sites covered with alluvium, some of which was likely due to past flood events. Another documented flood along the Coatán River was described at Cantón Corralito in the Mazatán area (Clark Reference Clark1994; Gutierrez Reference Gutierrez and Lesure2011).
Hurricane Stan destroyed approximately 2,000 houses across 10 neighborhoods (with another 12 neighborhoods also flooded) and affected approximately 100,000 people (Murcia and Macías Reference Murcia and Macías2009). This event left Tapachula isolated for weeks and unable to communicate with central Mexico and Central America. The erosion of the Coatán riverbanks, however, exposed excellent outcrops of past floods induced by rain (Murcia and Macías Reference Murcia and Macías2009) or thicker lahar deposits associated with eruptions of Tacaná (Macías Reference Macías2007; Murcia and Macías Reference Murcia and Macías2014). The studies conducted following this event concluded that the city of Tapachula, the main economic center of the Soconusco region, was founded on top of old lahar deposits from the volcano. This fact dovetails nicely with the name for the city of Tapachula, founded in 1486, which in Náhuatl means “flooded earth” (tapachol). The city's name suggests that inhabitants in the region were well aware of rain, floods, and the volcanic eruptions of Tacaná.
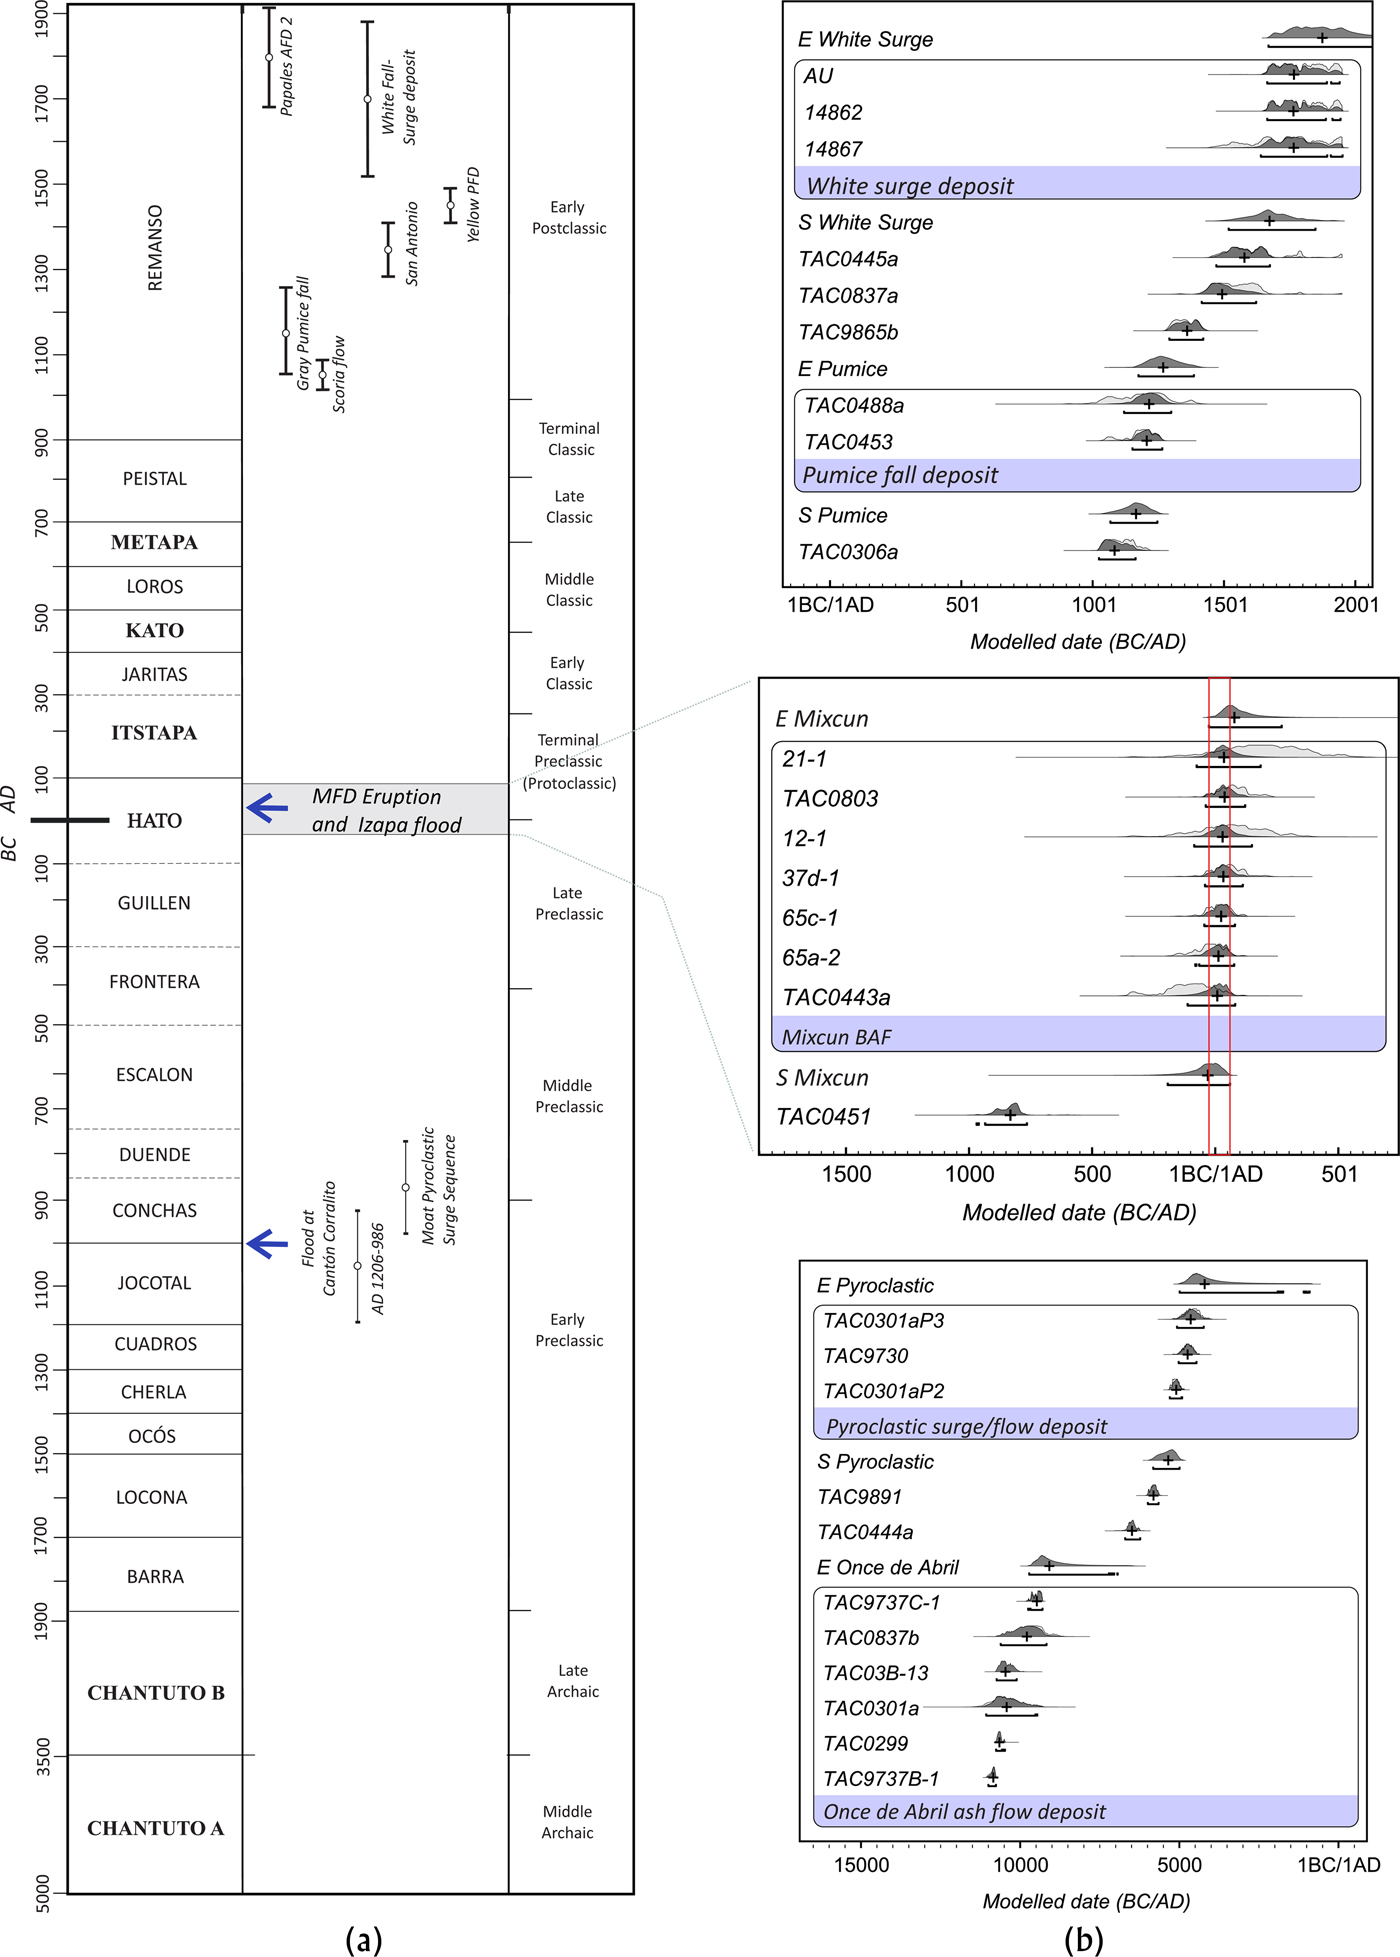
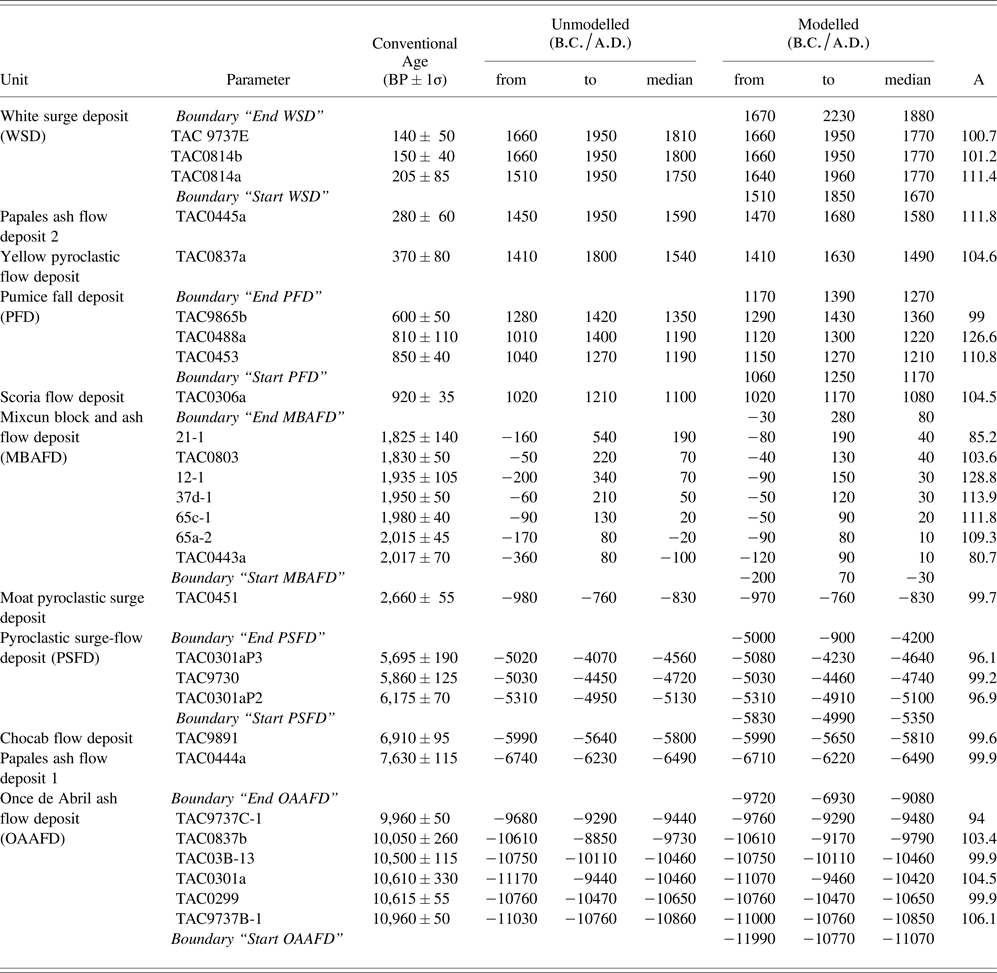
All of this evidence indicates that the chronic flooding of the Coatán, Cahuacán, Izapa, and Suchiate rivers is caused not only by hydrometeorological events, but also, at key moments throughout history, by volcanic eruptions of Tacaná (Macías et al. Reference Macías, Arce, Layer, Saucedo, Mora, Scholamacchia and Macías2015). Based on the eruptive history of Tacaná, Macías et al. (Reference Macías, Arce, Layer, Saucedo, Mora, Scholamacchia and Macías2015) have described at least 11 eruptions that have occurred during the past 10,000 years (Figure 2; Table 1) with a Volcanic Explosivity Index between 2 and 3 (Newhall and Self Reference Newhall and Self1982). Thus, inhabitants of the Soconusco, from all ceramic-using Prehispanic periods, likely were accustomed to eruptions of the volcano and the resultant lahars. These eruptions occurred at the time that the Archaic period Chantuto people established themselves in the Soconusco region as coastal collectors (Voorhies Reference Voorhies2004). Some of these eruptions coincided with significant early social transformations in the Soconusco, when the population was changing from low-level producers (3500 b.c.) to agriculturalists (500 b.c.; Lesure Reference Lesure and Lesure2011).
(a) Table showing the main eruptions of the Tacaná Volcanic Complex and their correlation with the chronology periods of Chiapanecan Soconuco (Lesure Reference Lesure and Lesure2011) and Izapa (Rosenswig et al. Reference Rosenswig, Mendelsohn, Antonelli, Lieske and Cortés2014). (b) Diagrams of modeled calibrated ages of Tacaná eruptions calibrated by using the online version of Oxcal 4.2 (Ramsey Reference Ramsey2009) with the IntCal_13 calibration curve (Reimer et al. Reference Reimer, Bard, Bayliss, Beck, Blackwell, Ramsey, Buck, Cheng, Edwards, Friedrich, Grootes, Guilderson, Haflidason, Hajdas, Hatté, Heaton, Hoffmann, Hogg, Hughen, Kaiser, Kromer, Manning, Niu, Reimer, Richards, Scott, Southon, Staff, Turney and van der Plicht2013). Calibration graphs were prepared by Laura Beramendi, with final edits by Macías.
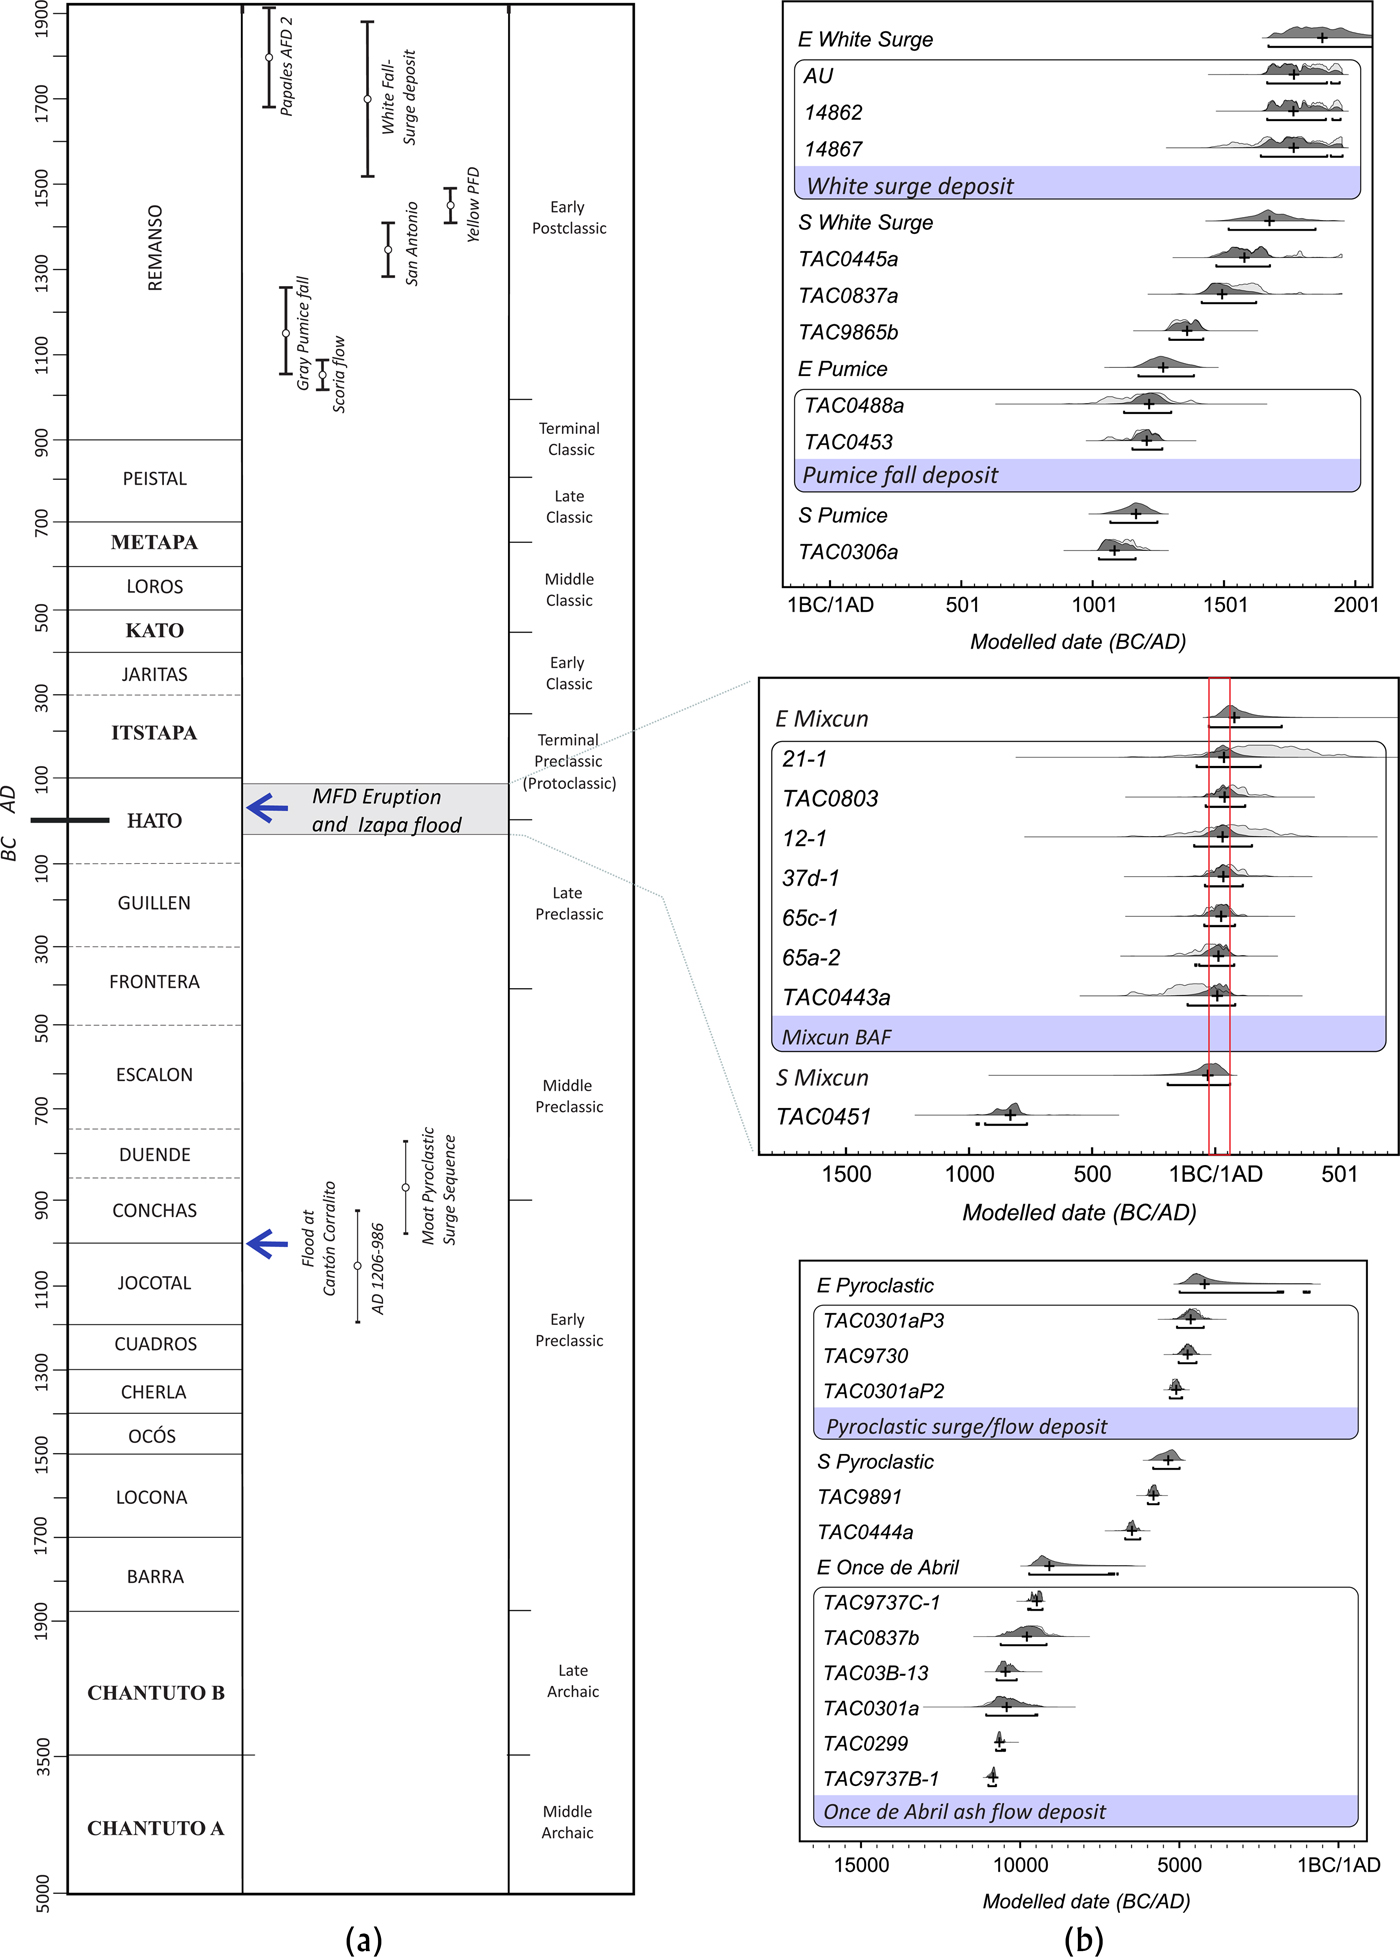
Radiocarbon ages of the Tacaná Volcanic Complex compiled by Macías et al. (Reference Macías, Arce, Layer, Saucedo, Mora, Scholamacchia and Macías2015) were calibrated using the online version of Oxcal 4.2 (Bronk Ramsey Reference Ramsey2009) with the IntCal_13 calibration curve (Reimer et al. Reference Reimer, Bard, Bayliss, Beck, Blackwell, Ramsey, Buck, Cheng, Edwards, Friedrich, Grootes, Guilderson, Haflidason, Hajdas, Hatté, Heaton, Hoffmann, Hogg, Hughen, Kaiser, Kromer, Manning, Niu, Reimer, Richards, Scott, Southon, Staff, Turney and van der Plicht2013). Samples were arranged in a sequence model, with those related to the same event grouped as a Phase with boundaries. Calibrated ages are reported as the 95.4% (2σ) posterior probability density intervals, with the corresponding median in b.c./a.d. The modeled ages suggest that the Mixcun eruption occurred between 30 b.c.–a.d. 80, which coincides with the Hato phase of the Izapa chronology. A = agreement index. Negative numbers in columns indicate dates Before Christ.

Knowledge and memories of this volatile hydrometeorological and volcanic history may be encoded in the very site organization of Izapa, whose main axis is oriented to the Tacaná volcano (Lowe et al. Reference Lowe, Lee and Espinoza1982). Occupation began at the site during the Early Formative period, with significant monumental construction beginning in the Middle Formative period, when the core of Mound 30a was built (Rosenswig et al. Reference Rosenswig, Mendelsohn, Antonelli, Lieske and Cortés2014). The San Antonio eruption that occurred between 30 b.c.–a.d. 80 (Figure 2b; Table 1) must have had a profound effect on the evolution of the site and the region, because it flooded Izapa at a moment when the site had become the most important polity in the Soconusco (Rosenswig et al. Reference Rosenswig, Brendan, Douglas, Rosemary, Rebecca and Yahaira2018).
The volcanic activity of Tacaná during the last 10,000 years is, as even this brief introduction demonstrates, a critical piece of the larger social and natural history of Izapa and the greater Soconusco region. In this contribution, we present a summary of the volcanic activity of Tacaná during the last 10,000 years and a description of the 30 b.c.–a.d. 80 eruption. Our data were employed to simulate pyroclastic flows and the subsequent lahars created by this eruption of Tacaná using numerical models. The deposits described by Macías et al. (Reference Macías, Espíndola, Garcia-Palomo, Scott, Hughes and Mora2000) and the simulations presented here are in good agreement and point to a direct correlation between the catastrophic volcanic and flooding events and the major social transitions that transpired at Izapa during the Late Formative period.
THE HYDROLOGIC NETWORK AROUND TACANÁ
Tacaná stands in high relief with respect to the elevations of the surrounding terrain (García-Palomo et al. Reference García-Palomo, Macías, Arce, Mora, Hughes, Saucedo, Espíndola, Escobar, Layer, Rose, Bluth, Carr, Ewert, Patino and Vallance2006). The main rivers that drain the volcano are the Coatán and Suchiate, the latter marking the international border between Mexico and Guatemala; both flow towards the Pacific Ocean (Figure 1b). The Coatán River is born in Guatemala, close to the Tajumulco volcano. It drains approximately 29 kilometers through Guatemala and approximately another 65 kilometers through Mexico prior to emptying into the Pacific Ocean. Along its path, the Coatán captures several tributaries and provides water to the town of Tapachula in Chiapas. Beyond Tapachula, the Coatán turns to the west prior to flowing southwards towards Mazatán and to the Pacific. The Suchiate River is also born in Guatemala and drains to the southeastern flanks of Tacaná, capturing several tributaries (e.g., the Izapa River) and draining cities such as Ciudad Hidalgo in México and Coatepeque in Guatemala. The Coatán and Suchiate rivers frame a large alluvial fan and smaller fans, on top of which were founded the city of Tapachula (Macías et al. Reference Macías, Espíndola, Garcia-Palomo, Scott, Hughes and Mora2000; Murcia and Macías Reference Murcia and Macías2009). Smaller rivers, such as the Cahuacán and Izapa, erode and drain their waters on top of these alluvial fans. Both Izapa and the site of Cuauhtémoc (Rosenswig Reference Rosenswig2009; Rosenswig et al. Reference Rosenswig, Mendelsohn, Antonelli, Lieske and Cortés2014) were established between the Cahuacán and Suchiate rivers on these same alluvial fans.
VOLCANIC ACTIVITY OF TACANÁ
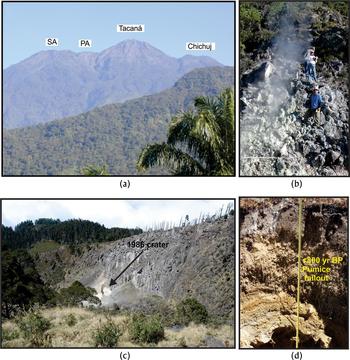
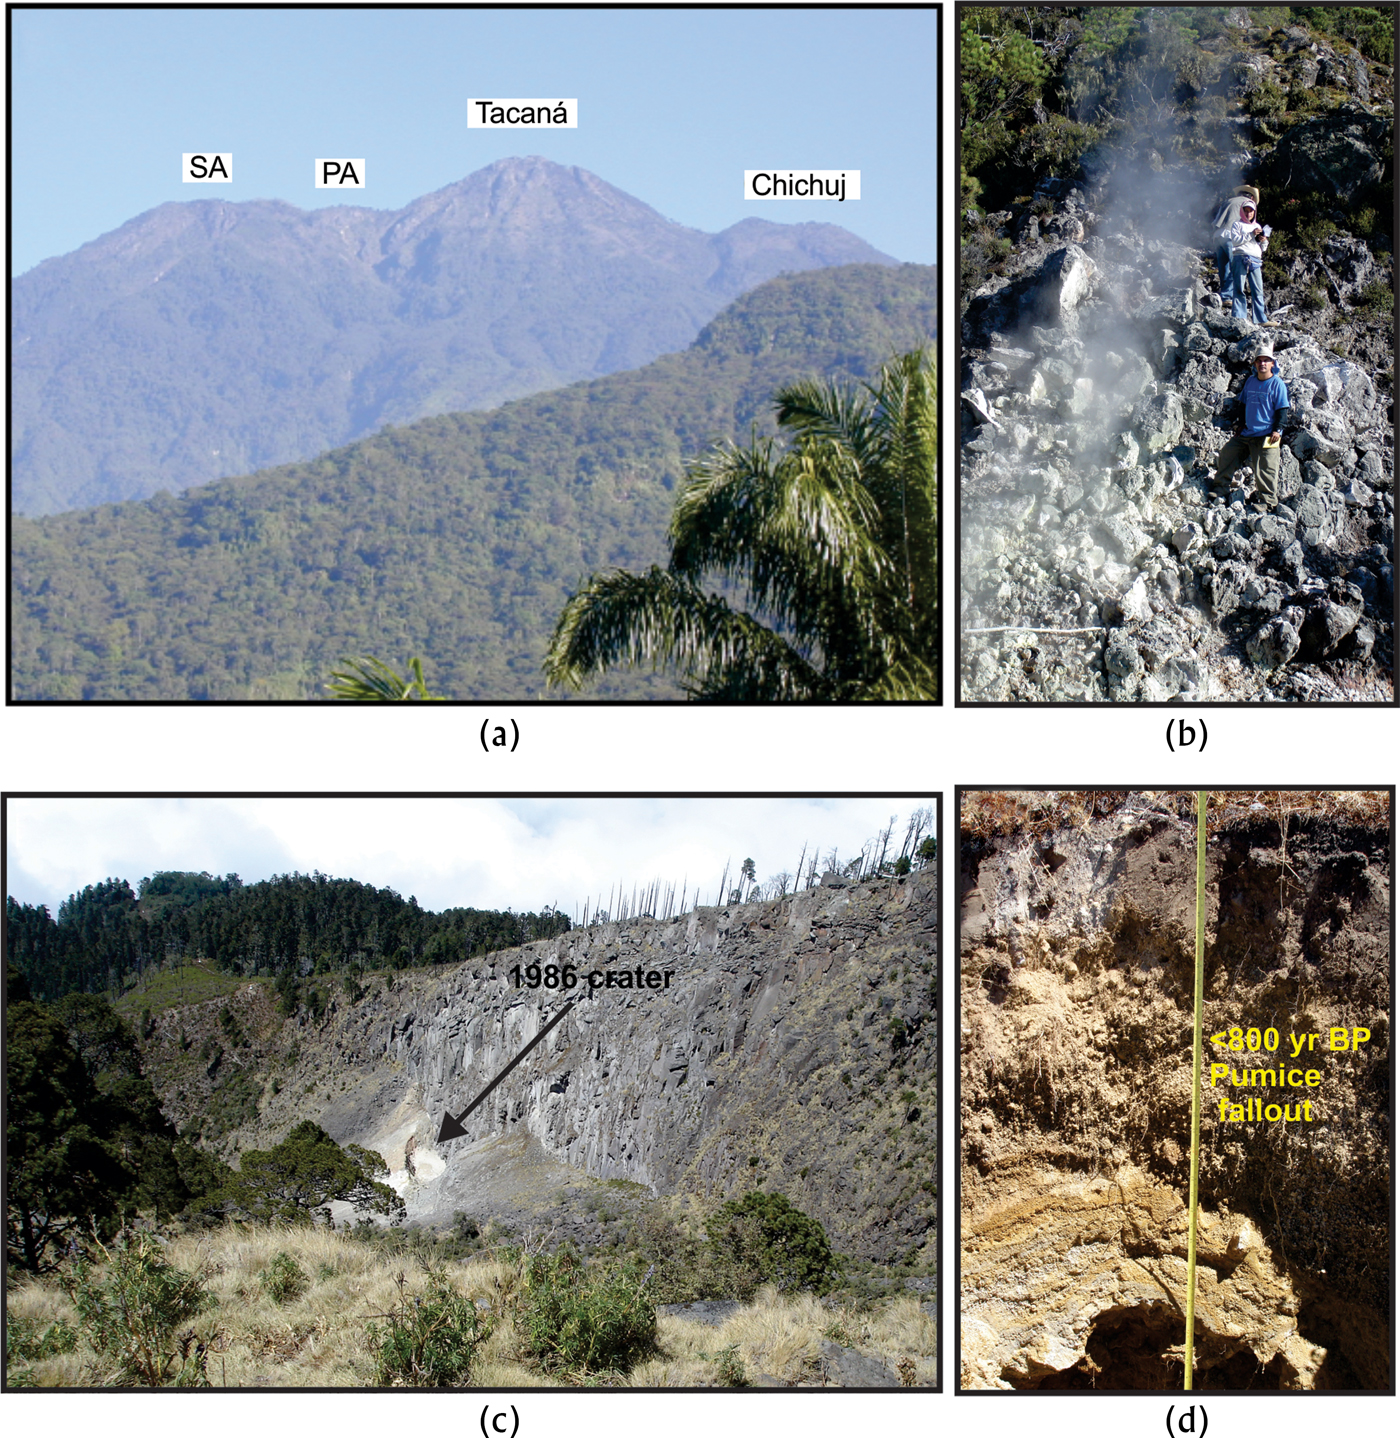
The Tacaná Volcanic Complex consists of four northeast-trending volcanic edifices including, from oldest to youngest: Chichuj (3,800 m), Tacaná (4,060 m), Las Ardillas dome (3,782 m), and San Antonio (3,700 m; Figure 3a). The last three eruptions have occurred near the summit of Tacaná in 1881, 1949, and 1986 (Macías et al. Reference Macías, Arce, Layer, Saucedo, Mora, Scholamacchia and Macías2015). The 1986 phreatic explosion took place on the northern slope of the volcano (Figure 3b). This very fact indicates that this volcanic complex should be considered active and dangerous.
(a) Panoramic view from the southeast of the Tacaná Volcanic Complex. PA, Plan de las Ardillas Dome; SA, San Antonio Volcano. (b) Panoramic view to the northwest of the 1986 explosion crater. It is about 20 × 15 m in diameter (point 1 in Figure 1b) Photograph by Macías. (c) Photograph showing the fumarolic zone at San Antonio Volcano and the hydrothermal alteration (point 2 in Figure 1b). (d) Outcrop of the a.d. 1150–1270 pumice fall deposit (point 3 in Figure 1b). The deposit consists of continuous ash layers at the bottom overlaid by a lapilli-size layer with pumice fragments, totaling 40 cm in thickness. (a–c) Photographs by Arce.
The beginning of the formation of complex started around 225,000 years ago with the emission of lavas and the construction of Chichuj volcano. This volcanic activity formed a main cone and a lava dome on top followed by the lateral collapse of the volcano towards the west. At around 50,000 years ago, a new volcano, Tacaná, began to rise to the west of Chichuj through the emission of lava flows that promoted its growth and the formation of the semi-conical summit that we see today (Figure 3a; Macías Reference Macías2007; Macías et al. Reference Macías, Arce, Layer, Saucedo, Mora, Scholamacchia and Macías2015). At around 20,000 years ago, another volcano, San Antonio, began to emerge southwest of Tacaná, formed by the emission of lava flows and a summit dome. The construction of San Antonio did not stop Tacanás activity, however, which persists today. San Antonio was partially destroyed by a lateral eruption (30 b.c.–a.d. 80) that left a horseshoe-shaped crater that was afterwards filled by lava flows and a dome. Today, fumaroles and intense hydrothermal alteration persist on its northern flank (Figure 3c). Finally, another eruption emitted a lava dome of unknown age between Tacaná and San Antonio called Ardillas.
ERUPTIONS WITNESSED BY SOCONUSCO VILLAGERS
The earliest documented sites in the Soconusco date back to 3600 and 3100 cal b.c. (Voorhies Reference Voorhies2004). Therefore, we present a summary of the eruptions that have occurred since this time within the Tacaná Volcanic Complex (Table 1). By the period of these early settlements, Chichuj was already extinct and therefore only eruptions of Tacaná and San Antonio are considered. Even with Chichuj set aside, the complex presented at least 11 eruptions that left trackable deposits radiocarbon dated within the period under consideration. This record does not include milder lava flow eruptions that formed the main cones of these volcanoes.
Six documented, small scale, eruptions with Volcanic Explosivity Index (VEI) = 2 (Newhall and Self, Reference Newhall and Self1982) have affected the upper and southern flanks of the volcano up to elevations of 2,200 m. These eruptions produced pyroclastic surges that filled the Tacaná summit crater (970–760 b.c.), a scoria flow deposit emplaced towards the west of the volcano (a.d. 1020–1170), a pumice fallout and pyroclastic surge deposits (a.d. 1150–1270), pyroclastic flows (a.d. 1410–1630), pyroclastic surge deposits (a.d. 1470–1680), and a white pyroclastic surge deposit (a.d. 1660–1950; Table 1). In particular, the a.d. 1150–1270 pumice fallout seems to be the largest within this group of recent eruptions. It surely developed a sustained pyroclastic column, probably higher than 12 kilometers and visible from several kilometers away, which dispersed pumice and ash for several kilometers around the volcano and left a roughly 40-centimeter-thick layer of pumice fallout 1 km from Tacana's summit (Figure 3d). In comparison, the last three eruptions that were historically documented in 1881, 1949, and 1986 have not left any trace of materials ejected. Therefore, if small eruptions are not considered (like those historically recorded), major Holocene eruptions of Tacaná have occurred every 900 years.
The San Antonio Eruption (30 b.c.–a.d. 80)
Prior to this eruption, the San Antonio Volcano consisted of a stacked succession of andesitic lavas and a summit dome (Macías et al. Reference Macías, Espíndola, Garcia-Palomo, Scott, Hughes and Mora2000; Mora et al. Reference Mora, Macías, García-Palomo, Espíndola, Manetti and Vaselli2004). The eruption started with phreatic-phreatomagmatic explosions that generated pyroclastic density currents around the summit area. These explosions destabilized the volcanic edifice, triggering a Pelean-style eruption that destroyed a 30° sector of the south-southwest flank of the edifice and the summit andesitic dome leaving a horseshoe-shaped crater (Figure 1b). Collapse of the dome generated a series of andesitic block-and-ash flows (BAF) that traveled at least 14 kilometers away from their source. The BAF deposits underlie the actual limits of the Mixcun, Ahuacatlán, Once de Abril, and Cacahoatán villages (Figure 1b). The BAF covered at least 25 square kilometers, with a total volume of about 0.12 km3, for an estimated VEI = 3. This eruption was bigger in magnitude than some modern examples, like the 2010 Merapi eruption (Java, Indonesia), which produced BAF with runouts of 15 km from the vent. The total volume for this Merapi eruption was 0.04 km3 (Bignami et al. Reference Bignami, Joel, Marco, Marco, Fabrizia, Sri, Dewi Sri and Surono2013), covered an area of 22.3 km2, and resulted in hundreds of fatalities (Charbonnier et al. Reference Charbonnier, Germa, Connor, Gertisser, Preece, Komorowski, Lavigne, Dixon and Connor2013), even though it was one order of magnitude lower than the 30 b.c.–a.d. 80 San Antonio eruption.
The pyroclastic flows filled the ravines with deposits more than 10 meters thick, although deposits on the main fan were less than one meter thick. The main pyroclastic flows did not impact the site of Izapa (Figure 1b; Macías et al. Reference Macías, Arce, García-Palomo, Mora, Layer and Espíndola2010), located approximately seven kilometers further south (Rosenswig et al. Reference Rosenswig, Brendan, Douglas, Rosemary, Rebecca and Yahaira2018). The accompanying dilute clouds of the pyroclastic flows must have dispersed ash in the environment, however, blanketing the region. The BAF deposits clogged the hydrological network upstream, including the Cahuacán, Izapa, and Mixcun perennial rivers. The damming of these rivers due to the emplacement of loose debris is a common process in volcanic terrains. In fact, during the 1982 eruption of El Chichón, pyroclastic flows dammed the river for almost two months after which the impounded water overtopped the obstruction, breaching the pyroclastic dam and producing a huge hot lahar that reached up to the Grijalva River (Macías et al. Reference Macías, Capra, Scott, Espíndola, Palomo and Costa2004). This same process likely occurred days or weeks after the eruption of San Antonio volcano, and included large amounts of rainwater poured in the area and the discharge of these perennial rivers. As confirmed by the exposure in the northeastern outskirts of Tapachula and the eastern outskirts of Izapa, posteruptive lahars (debris flows and hyperconcentrated flows) were derived from the primary pyroclastic flow deposits (Macías et al. Reference Macías, Espíndola, Garcia-Palomo, Scott, Hughes and Mora2000). Main lahars moved along the Cahuacán River reaching the present outskirts of Tapachula several kilometers downstream. Lahars also followed the Izapa and Mixcun rivers to then enter into the Suchiate River, where they traveled several kilometers downstream. Macías et al. (Reference Macías, Espíndola, Garcia-Palomo, Scott, Hughes and Mora2000) suggested that the halt in construction at Izapa during the Hato phase was due to flooding by these lahars, which partly destroyed the environs of the site and undoubtedly severed it from communication with the larger region.
MODELING OF THE ERUPTION AND FLOOD EVENTS
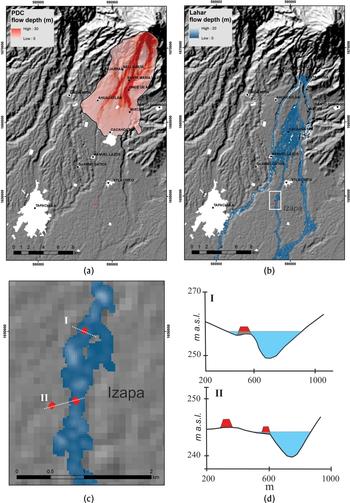
In order to understand if and how these pyroclastic flows and lahars affected the Izapa area at the end of the Late Formative period, we performed computer simulations to reproduce these events by using the volcanological information coupled with numerical models. Pyroclastic flows from the San Antonio dome collapse were simulated using Titan-2d code 2.0.1. (Patra et al. Reference Patra, Bauer, Nichita, Pitman, Sheridan, Bursik, Rupp, Webb, Stinton, Namikawa and Renschle2005), a program developed for simulating dry granular avalanches over a digital elevation model (DEM) assuming a continuum, deformable volume, parcels of which are driven downslope by gravity. The main input parameters for running simulations are: (1) the volume of the collapsed mass, (2) the basal friction angle, and (3) the internal frictional angle. The collapsed dome was reconstructed in the scarp on the upper portion of San Antonio volcano with a total volume of 0.12 km3 that corresponds with the volume calculated for the Mixcun deposit (Macías et al. Reference Macías, Espíndola, Garcia-Palomo, Scott, Hughes and Mora2000). The internal friction angle was set at 30°, being a common value used for dry granular materials (i.e., Capra et al. Reference Capra, Norini, Groppelli, Macías and Arce2008; Charbonnier and Gertisser Reference Charbonnier and Gertisser2009; Macías et al. Reference Macías, Capra, Arce, Espíndola, García-Palomo and Sheridan2008; Rupp et al. Reference Rupp, Bursik, Namikawa, Webb, Patra, Saucedo, Macías and Renschler2006; Sheridan et al. Reference Sheridan, Stinton, Patra, Pitman, Bauer and Nichita2005; Sulpizio et al. Reference Sulpizio, Capra, Sarocchi, Saucedo, Gavilanes and Varley2010; Yu et al. Reference Yu, Dalbey, Webb, Bursik, Patra, Pitman and Nichita2009). The basal friction angle was assessed on the basis of the observed maximum runout of the Mixcun deposit, and the best fit was obtained with angles variable between 8° and 10°. It is worth mentioning that simulations were performed on the actual topography that includes the Mixcun deposit itself. Despite this approximation, the simulated maximum runout and flow thickness are in agreement with the observed deposit. The simulated flow reached a maximum distance of 15 km towards the south-southwest, forming a fan of 8 km in width and a thickness of 15 m close to Mixcun village, and up to 30 meters along the two main rivers that flank the inundated area (Figure 4a).
(a) Area covered by the simulation of the Titan-3d computer code for the 30 b.c.–a.d. 80 eruption of the San Antonio Volcano. The simulation was routed over a digital elevation model of 30 m-pixels in horizontal resolution obtained from NASA Shuttle Radar Topography Mission data (SRTM, 1 arc-second). (b) Inundation zones resulted from the Flow-2d computer simulation for the lahars generated after the 30 b.c.–a.d. 80 eruption. (c) Close-up of the inundated area at Izapa Archaeological zone by lahars simulated in Figure 4b. I and II are profiles interpreted in Figure 4d. (d) Inundation profiles at Izapa zone resulting from the lahar simulation. Images prepared by Capra.

Lahar inundation limits were obtained with the Flow-2d code (O'Brien et al. Reference O'Brien, Julien and Fullerton1993), a numerical model commonly used to simulate debris flow on active volcanoes (i.e., Caballero and Capra Reference Caballero and Capra2014; Worni et al. Reference Worni, Huggel, Stoffel and Pulgarin2012). The average flow volume is estimated here based on the volume of the BAF deposits that filled the Cahuacán, Izapa, and Mixcun rivers. This estimation is based on the actual morphology of these channels and the observed maximum thickness of 10 m of the BAF deposits along these ravines (Macías et al. Reference Macías, Espíndola, Garcia-Palomo, Scott, Hughes and Mora2000). This sediment volume (2 × 10⁶ m3) was then bulked with the same volume of water to get a sediment-water mixture in the limit of the hyperconcentrated/debris flow range (i.e., Vallance Reference Vallance, Jakob and Hungr2005). Rheological parameters used for simulations were assumed as proposed by Caballero et al. (Reference Caballero, Capra, Vazquez, Riley, Webley and Thompson2016). Based on these estimated parameters, flows were simulated along the main channels that dissect the pyroclastic fan (Figure 4b), where superficial erosion and head cutting probably removed the material as the impounded water reached the top of the obstruction. Simulated lahars reached a maximum distance of approximately 30 kilometers, with a maximum flow thickness of up to 20 meters in the deepest portion of the Cahuacán and Suchiate rivers. Several minor channels drain from the pyroclastic fan, including the Izapa River that forms the eastern boundary of the main ceremonial precinct of Izapa (but see Rosenswig et al. Reference Rosenswig, López-Torrijos, Antonelli and Mendelsohn2013:1503 for discussion of architectural construction to the east of the River Izapa), which was also part of the larger Izapa polity. Here, the simulated flow reaches a maximum thickness of up to 6 meters, which clearly would have been able to inundate the ceremonial center (Figure 4c).
INTERPRETATION OF THE SIMULATIONS AND RELATED HAZARDS
Early occupation of Izapa occurred by sometime around 1500 b.c. (Lowe et al. Reference Lowe, Lee and Espinoza1982; Rosenswig et al. Reference Rosenswig, López-Torrijos, Antonelli and Mendelsohn2013:1502) and Izapa had begun to coalesce into a major cultural and political center by the Middle Formative Escalón and Frontera phases (750–300 b.c.). The Late Formative Guillén phase, which is now placed between 300–100 b.c., is when the many architectural mounds at Izapa reached their largest areal distribution; it was also the period during which the majority of Izapa's monuments were likely produced (Lowe et al. Reference Lowe, Lee and Espinoza1982, Reference Lowe, Ekholm and Clark2013; Rosenswig et al. Reference Rosenswig, Mendelsohn, Antonelli, Lieske and Cortés2014, Reference Rosenswig, Brendan, Douglas, Rosemary, Rebecca and Yahaira2018). Lowe et al. (Reference Lowe, Lee and Espinoza1982) concluded that, during the Hato phase, Izapa halted its constructional growth and that this cessation of construction activity in the ceremonial center coincided with its partial abandonment. As Rosenswig et al. (Reference Rosenswig, Brendan, Douglas, Rosemary, Rebecca and Yahaira2018) clarify, however, certain limited yet impressive modifications to the ceremonial center, especially to the northern side of the Mound 30 platform, continued during the Terminal Formative period Itstapa phase (Figure 2a). These alterations of the Middle and Late Formative center were linked to a refocusing of construction activity to the Group F area north of the ceremonial center (Rosenswig and Mendelsohn Reference Rosenswig and Mendelsohn2016).
The reconstruction of the eruptive scenario shows that the modern towns of Once de Abril, Ahuacatlán, Santa María, Mixcun, and Cacahoatán sit over the remains of these BAF deposits as previously described (Macías et al. Reference Macías, Espíndola, Garcia-Palomo, Scott, Hughes and Mora2000). As shown in Figure 4a, the thickest deposits (in red) filled the Cahuacán and Mixcun ravines. According to the simulations, Izapa was not directly impacted by these pyroclastic flows because the main center was located 7 km to the south (Rosenswig et al. Reference Rosenswig, Brendan, Douglas, Rosemary, Rebecca and Yahaira2018), although fine ash derived from the upwelling dilute clouds from the main pyroclastic flows could certainly have reached the Izapa settlement. Smaller hamlets and cultivated lands, uphill from Izapa, must have been buried by pyroclastic flows from this eruption. As observed in the simulations, pyroclastic flows not only filled major ravines (in red in Figure 4a), but clogged the Cahuacán, Izapa, and Mixcun drainages. People from Izapa surely saw the eruption, suffered its effects, and likely found it terribly frightening.
The damming of rivers usually does not last longer than a few days to typically less than one year. Schuster et al. (Reference Schuster, Costa and Schuster1986) showed that the duration of natural dams depended on the volume of the dam, the type of material, and the inflow rate, and that 90% of these dams failed during the first year. As the water reaches the crest of the obstruction, overflowing induces erosion and head cutting with the formation of catastrophic lahars like those produced after the May 8, 1980 eruption of Mount St. Helens in the United States (Glicken Reference Glicken1986; Schuster et al. Reference Schuster, Costa and Schuster1986). By analogy, the damming of the Cahuacán, Izapa, and Mixcun rivers could have lasted days to weeks prior to the resultant breakout into catastrophic lahars. Strikingly, the simulation shows that massive flooding occurred downstream from the Once de Abril village, covering a vast terrain today occupied by the towns of Ahuacatlán, Manuel Lazos, and the outskirts of Tuxtla Chico. Thick deposits of lahars found west of Ahuacatlán confirm the simulation results. Therefore, it seems likely that post eruptive lahars moved along the Cahuacán River up to the present eastern outskirts of Tapachula, where thick deposits were recorded (Macías et al. Reference Macías, Espíndola, Garcia-Palomo, Scott, Hughes and Mora2000). The deposits around Tapachula also indicate that lahars must have reached further downstream, and likely descended along the Mixcun River prior to being captured by the Suchiate River, along which they probably diluted and vanished rapidly. Surprisingly, but most significantly for the purposes of this paper, the simulation also shows that lahars moved along the Izapa River, directly impacting Izapa with a 6-m wave of water and mud, as shown in the profile across the river (Figure 4d). If we consider that the flood had a 50 percent concentration of sediment with respect to the water (debris flow; Vallance Reference Vallance, Jakob and Hungr2005), then the deposit remaining after the passage of the lahar could have had a maximum thickness of 3 m. Such a deposit must have left the Izapa mounds surrounded by, and protruding from, a muddy landscape. Typically, the time that elapses between eruption and the generation of related lahars is short, and therefore they were probably still hot, like the approximately 90 °C lahar produced one month after the 1982 eruption of El Chichón volcano (Macías et al. Reference Macías, Capra, Scott, Espíndola, Palomo and Costa2004).
Excavations carried out at Izapa in 2012 by Rosenswig et al. (Reference Rosenswig, Mendelsohn, Antonelli, Lieske and Cortés2014, Reference Rosenswig, Brendan, Douglas, Rosemary, Rebecca and Yahaira2018) brought to light a new stratigraphy for the Mound 30 platform (Suboperation 11a). The authors documented a clear stratigraphic break recorded by three distinct episodes of white matrix deposition bracketing thin dark levels (Rosenswing et al. Reference Rosenswig, Brendan, Douglas, Rosemary, Rebecca and Yahaira2018). These layers were interpreted by the authors as “an initial construction and at least two subsequent resurfacing or maintenance episodes.” The upper dark brown level above contained Terminal Formative (Itstapa phase) ceramic sherds from fill recovered above floor levels 7 and 8, while levels 21 and 22 contained Middle Formative (mostly Escalón phase, with some Duende) sherds. The mud deposit of the San Antonio lahar, which occurred between 30 b.c.–a.d. 80 during the Hato phase, is located somewhere between these Middle and Terminal Formative layers. We suggest that the grey layers documented by Rosenswig et al. (Reference Rosenswig, Brendan, Douglas, Rosemary, Rebecca and Yahaira2018) in Mound 30 may be volcanic material related to the flood event. A careful analysis of this material may be needed. The location of the Mound 30 platform, just west of the Izapa River, suggests that it was surely affected by the eruption and its resultant flooding. Monuments at the site may also make reference to hydrometeorological events related to the chronic volatility of Tacaná. Guernsey (Reference Guernsey2018) noted that a number of stelae at Izapa make reference to the site's watery environment, while others express a deep concern with water control. Guernsey argued that rulers at Izapa couched these concerns with water management through mythological references to rain and agricultural deities, and in recognition of the fact that the high annual precipitation of this region was both a boon to agricultural activity and a threat in the form of seasonal inundations.
Such events, of course, were not unique to the environs of Tapachula. A similar flood of larger proportions occurred after the a.d. 822–823 eruption of Popocatepetl in central Mexico that buried the Preclassic household site of Tetimpa (Plunket and Uruñuela Reference Plunket and Uruñuela1999; Siebe et al. Reference Siebe, Abrams, Macías and Obenholzner1996). The volcano produced pyroclastic flows and fallouts that entirely covered the landscape, including the glaciers atop the Iztaccíhuatl volcano. Syn- and posteruptive lahars flooded the pre-Hispanic cities of Cholula, Cacaxtla, and Xochitecatl, causing their abandonment (Siebe et al. Reference Siebe, Abrams, Macías and Obenholzner1996). This event, in fact, marks the boundary between the Classic and Postclassic periods in Mesoamerica.
Flooding in the Soconusco region is neither uncommon nor new. As noted previously, an ancient flood event was documented at the site of Cantón Corralito (Mazatán), situated along the Coatán River in Chiapas, which was occupied during the Early Formative Barra, Locona, Ocós, and Cherla phases and rose to power as the largest site in the region by the Cuadros phase (1300–1200 b.c.) (Cheetham Reference Cheetham2006). By the end of the Cuadros phase, Cantón Corralito was destroyed by a flood of the Coatán River that left behind a coarse red bed of sand 1–2.5 m thick (Pérez-Suárez and Lesure Reference Pérez-Suárez and Lesure1998). This episode was interpreted by Gutierrez (Reference Gutierrez and Lesure2011) as either a flood event, caused by deforestation that was followed by intense rains in the region (as was the case with Hurricane Stan in 2005), or as a flood event associated with posteruptive lahars derived from an explosive eruption of Tacaná that occurred around 1206–986 b.c. (Mora et al. Reference Mora, Macías, García-Palomo, Espíndola, Manetti and Vaselli2004).
CONCLUSIONS
This paper has presented a summary of the eruptive activity of Tacaná during the past 3,500 years. At least 11 eruptions have occurred at Tacaná, all of which likely produced syn- and post-eruptive floods. We suggest that the San Antonio eruption that occurred 30 b.c.–a.d. 80 (corresponding to the Hato phase), and the resulting post-eruptive floods, were connected to the abandonment of the Terminal Formative ceremonial center of Izapa and the shift of occupation and the majority of construction activity to Group F to the north. The results of simulations of this eruption confirm that Izapa was not directly impacted by hot pyroclastic flows, but it was flooded by post eruptive hot lahars that moved along the Cahuacán, Mixcun-Suchiate, and Izapa rivers. Lahars likely flooded Izapa with a 6-m-deep wave of muddy water, which destroyed crops and avulsed the rivers, which had long been used as important systems for trade and communication (Guernsey Reference Guernsey2016; Lowe et al. Reference Lowe, Lee and Espinoza1982:57; Navarrete Reference Navarrete, Lee and Navarrete1978:80–81; Voorhies and Kennett Reference Voorhies and Kennett1995). Following this catastrophic event, Izapa must have resembled a landscape of mounds surrounded by a sea of mud, with households and cultivated lands severely damaged. Such rapid and catastrophic floods may also have led to the demise of Izapás population. The eruption and ensuing floods marked the end of the epoch of splendor at Izapa during the Guillén phase, and resulted in its partial abandonment during the Hato phase, or a period corresponding to between 100 b.c. and a.d. 100.
RESUMEN
Durante el formativo tardío (30 a.C.–80 d.C.) Izapa fue inundada por lahares asociados a una erupción del Volcán San Antonio (parte del Complejo Volcánico Tacaná). Las simulaciones computarizadas indican que los flujos piroclásticos calientes no impactaron directamente a Izapa pero rellenaron y bloquearon los ríos Cahuacan y Mixcun. El material volcánico caliente sin consolidar se saturó con agua superficial o de lluvia y fue removilizado repentinamente de forma catastrófica como una mezcla de agua y lodo (inundación) y probablemente caliente. Los lahares bajaron por los ríos Cahuacan, Mixcun-Suchiate e Izapa. En el Río Izapa el espesor de la ola de lodo tuvo una altura mínima de seis metros. La inundación seguramente destruyó cultivos y construcciones dejando a la ciudad parcialmente destruida con sus montículos por encima de un lodazal y posiblemente con la pérdida de vidas. Las inundaciones afectaron los ríos aguas abajo azolvándolos causando serios daños en su transporte y comercio con la costa.
ACKNOWLEDGMENTS
We appreciate the technical support of Guillermo Cisneros and the help of L. Beramendi. This work was supported by CONACYT project 522 “Problemas Nacionales” to J.L. Macías. We appreciate the constructive comments of J. Guernsay, R. Rosenswig, and P. Sheets that improved the ideas and the archaeological chronology resumed in this manuscript.