Introduction
Livestock local breeds represent unique animal genetic resources. Their preservation and development are important to respond to major challenges such as consumer demand, climate change and production systems evolution. Assessing the risk status of livestock breeds is a key part of country-based early warning and response systems and should be performed before the implementation of any conservation actions or programs, in situ, ex situ or both. This recommendation is one part of the first strategic priority in the Global Plan of Action for Animal Genetic Resources (Interlaken International Technical Conference, FAO, 2007). The European Union provides support for endangered breeds, which is proffered based on a threshold number of breeding females established at the national level (CE Regulation Nr 1974/2006). The Food and Agriculture Organization (FAO) also classifies breeds as endangered mainly based on the number of breeding females (Loftus and Scherf, Reference Loftus and Scherf1993; Scherf, Reference Scherf2000). However, breeds are disappearing not only because of demographic factors, but also because of genetic and socio-economic factors (Audiot, Reference Audiot1995; FAO, 2004); indeed, the sustainability of conservation programs depends on multiple issues (Lauvie et al., Reference Lauvie, Audiot, Couix, Casabianca, Brives and Verrier2011). As a consequence, several researchers have suggested using more elaborate risk assessment methods. For instance, Gandini et al. (Reference Gandini, Ollivier, Danell, Distl, Geogoudis, Groeneveld, Martyniuk, Van Arendonk and Woolliams2004) have proposed utilizing a method that combines demographic and genetic criteria (population growth rate based on the number of breeding females, and effective population size based on the numbers of breeding males and females), while Alderson (Reference Alderson2003, Reference Alderson2010) has recommended identifying at-risk breeds using numerical scarcity, geographical concentration, genetic erosion (effective population size) and introgression rate. The present study presents a new risk assessment method that incorporates six indicators of demographic, genetic and socio-economic status. This method was checked on 178 French breeds belonging to ten domesticated species. The results are discussed in the context of breed conservation.
Materials and methods
General principle of the method
A multi-indicator approach was chosen that attempted to reconcile methodological simplicity with the need to account for the multiple factors that place breeds at risk. Indicators had to fulfill three conditions. First, they had to be unambiguously tied to breed risk status (i.e. they could not simultaneously represent a risk and contribute to conservation efforts). Second, they should show on what factors breeders could act to improve the status of a given breed. Finally, the information used to calculate them had to be fairly accurate and easy to collect.
Six indicators meeting these requirements were used to assess breed status. They were the following: (i) the current number of breeding females; (ii) the change in the number of breeding females over the last 5 years (mammals) or generations (poultry); (iii) the percentage of cross-breeding; (iv) effective population size; (v) breeder organization and technical support; and (vi) socio-economic context. The first two indicators reflect breed demography, the third and fourth reflect breed genetics and the last two reflect social and economic conditions. In contrast to the suggestion made by Alderson (Reference Alderson2010), geographical concentration was not included because it was considered to be too ambiguous. For instance, if a breed is concentrated within a very small area (e.g., on farms in close proximity to each other), there is an increased risk in case of epidemics; however, exchanges among breeders are facilitated, potentially enhancing breed management and thus conservation.
In order to make the indicators comparable, observed scores were converted to fit a six-point scale, which ranged from 0 (no risk) to 5 (maximum risk). The conversion method used for each indicator is described in detail below (see section Converting indicator scores to fit a six-point scale).
Breeds under study
This multi-indicator approach was used to assess the risk status of 178 French “local breeds” belonging to ten domesticated species: horses, donkeys, cattle, sheep, goats, pigs, chickens, turkeys, geese and Pekin ducks. Here, the term “local breed” is defined as per French regulations (Code Rural, Article D-653-9) as “a breed mainly linked to a specific territory by its origins, its location, or its use”, where “territory” means a small subsection of the country. Within this general definition, local breeds of mammals and poultry are defined differently.
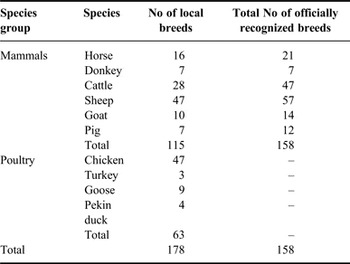
Mammalian breeds are officially recognized by the government, namely the French Ministry of Agriculture. For each species, the list of officially recognized breeds and the sublist of local breeds therein are defined by the government. In this study, all the officially recognized French local breeds belonging to six domesticated mammal species were assessed (Table 1). This amounted to a total of 114 breeds (i.e. about three-fourth of the 158 recognized breeds belonging to these species). In France, sheep is the only domesticated mammal whose stock is primarily composed of local breeds. In other species, local breeds are in the minority (1–30 percent depending on the species; results not shown here).
Number of breeds studied categorized by species group and species.

Note that, in France, no poultry breed is officially recognized (the recognition process is underway).
For poultry, because of the way in which breeding is carried out, the concept of the breed differs. Partly for this reason, French poultry breeds are, as yet, not officially recognized. However, they do exist and are referred to as “breeds” by breeders. The French Ministry of Agriculture is working to institute a poultry-breed recognition process. All French poultry breeds are local (as per the above definition), tend to be rare and are kept by both fancy breeders and farmers wanting to develop an original and/or high-quality line of poultry production. Consequently, in this study, local poultry breeds were the breeds for which the information required for the recognition process has been well established. In total, 63 local poultry breeds, mainly chicken breeds, were examined (Table 1).
Data collection and analysis
Three main sources of information were used: (i) available zootechnical databases; (ii) interviews or written exchanges with the staff of breeders’ associations; and (iii) surveys by experts from technical or research institutes. For mammals, national public databases were used. For poultry, private databases were used and may have differed somewhat in their content across breeds. In all cases, when information on a given breed was inconsistent, it was cross-validated.
For each breed, the converted scores for the six indicators were plotted using a radar chart. An overall score (X) was calculated by taking the simple mean of the six separate indicator scores (X i ):
 $$X = \displaystyle{1 \over 6}\mathop \sum \limits_{i = 1}^6 X_i $$
In theory, it would have been possible to weight the indicator scores differently. However, because there is currently no reason for granting more weight to one indicator vs another, the simple mean was used instead. Basic statistics (i.e. mean, variance and Pearson correlation coefficients) were obtained, and a principal component analysis using the different breeds’ indicator scores was performed.
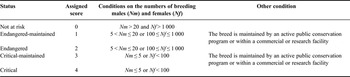
The method was adapted to provide us with a non-or-all status of the breeds, i.e. “Endangered” vs “Not endangered”, required to apply a public policy to support rare breeds. In addition, the FAO system for risk assessment (Loftus and Scherf, Reference Loftus and Scherf1993) was applied to all breeds under study. To allow the comparison with the proposed method, a score was allocated to each of the possible status in the FAO system, the highest score meaning the higher risk (Table 2). Note that, by nature, the status “extinct” also considered by FAO did not apply to our set of breeds. Also note that the FAO system is based on thresholds on the number of breeding females (Nf) and the number of breeding males (Nm) that do not depend on the species. The distribution of our overall scores and the status “Endangered” vs “Not engendered” deduced from our method were analysed according to the status in the FAO system.
Basic principles of the FAO system to assess the risk status of livestock breeds and arbitrary scores assigned to the different status.

When the number of breeding females is close to one of the two thresholds (100 or 1 000), other indicators such as the evolution of the actual population size or the proportion of cross-breeding may also be taken into account. From Loftus and Scherf, Reference Loftus and Scherf1993.
Converting indicator scores to fit a six-point scale
Number of breeding females
The basic principle is to define thresholds of number of breeding females that depend on the capacity to increase a breed actual population size, according to the preproduction abilities of the species. The lower this capacity, the higher is the risk for the breed to be lost. In other words, for a given number of breeding females, breeds from species with a small capacity (e.g. horse) are considered to be more endangered than breeds from species with a higher capacity (e.g. chicken).
Capacity to maintain population size is quantified by calculating the minimum time required to double a breed's actual population size. The term “minimum” means that we consider the most favourable conditions from a demographical point of view. Then, we assume that all suckled (mammals) or live-born (poultry) young females are kept for breeding (no selection of replacement females). However, to be realistic, we admit that a given proportion of old females are voluntary culled, for health or fertility problems, for instance.
Assuming a sex ratio equal to half, the number of young females available in any given year (Yf t ) is equal to:
 $$Yf_t = \displaystyle{1 \over 2}N \times Nf_t $$
where Nf t is the number of breeding females in year t and N is the number of suckled or live-born offspring (mammals and poultry, respectively) per female per year.
After culling, the remaining number of old females (Of t ) is equal to:
 $$Of_t = (1 - R)Nf_t $$
where R is the annual proportion of old females culled after breeding. Both N and R are assumed to be constant over time.
Under the hypothesis of no selection of replacement females, after a number of years, the equation describing the change in the number of breeding females from one year to the next is as follows:
 $$Nf_{t + 1} = \left( {1 - R + \displaystyle{1 \over 2}N} \right)Nf_t $$
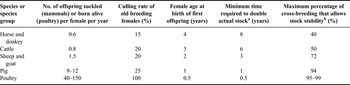
However, this equation may be not valid during the first few years because young females are not immediately available for breeding. Indeed, for species whose age of females at birth of their first offspring is higher than one year, extra females kept in year t do not have time to be bred and give offspring in year t + 1. Then, this equation was considered immediately valid for poultry and pig but was applied with a delay of 2, 3 or 4 years, for small ruminants, cattle and equids, respectively. Finally, the minimum time required to double a species’ population size, hereafter referred as “doubling time” (DT), and the parameters used to calculate this time, are provided in Table 3. Clearly, DT is longest for equines and shortest for poultry, with all the other species falling in-between.
Means of the demographic and reproduction parameters used in this study for different species or species groups.

It should be noted that the local and rather unspecialized breeds examined in this study have a lower productivity and a higher age at first birth of offspring than do mainstream breeds. Note also that a large variability in the productivity was observed between pig breeds or poultry species, this variability being much lower in ruminants and equids breeds.
a Assuming that all young females are kept for breeding (no selection of replacement females).
b Above this percentage, the annual number of young purebred females is lower than the annual number of old females culled after breeding.
Capacity to increase the actual population size decreases as DT increases. As a consequence, breed risk thresholds were initially assumed to be proportional to DT. Following a consensus reached by the scientific community and policy makers, it was decided that a cattle breed is considered to be endangered when its number of cows falls below 7 500 (FAO, 2004; European Regulation CE Nr 1974/2006; Alderson, Reference Alderson2003, Reference Alderson2010). This value and the associated value of DT in cattle (equal to 6, see Table 3), were used as reference points for proportionally. Then, for a given species, the value of the threshold (T Nf ) was first computed by applying a simple cross-multiplication:
 $$T_{Nf} = 7\,500 \times \displaystyle{{{\rm DT}} \over 6}$$
At this step, thresholds ranged from 10 000 females for equines to 625 females for poultry.
Three adjustments were made to these initial values to obtain the final values. First, in France, sheep and goats are raised in large to very large flocks and losing a single flock may have strong negative consequences. For this reason, the thresholds for these species were increased. Second, the pyramidal breeding system used in poultry and pigs, even for local breeds, was considered to provide a degree of security. Consequently, thresholds for these species were slightly decreased. Third, all values were rounded for the sake of ease in communication. The result was that the risk threshold was set at 10 000 breeding females for horses and donkeys, 7 500 for cattle, 6 000 for sheep and goats, 1 000 for pigs and 500 for poultry.
By convention, the above thresholds were considered to correspond to the upper limit for a score of 3. The thresholds for the other scores were also defined by convention, with values that remained realistic: (i) the upper limit for a score of 5 (maximum risk) was the rounded threshold used by some authors when describing a breed's status as critical (FAO, 2004; Alderson, Reference Alderson2010); (ii) the lower limit for a score of 0 (no risk) was 10 times the risk threshold; and (iii) the thresholds for the other scores were intermediate between these upper and lower values and were defined in a multiplicative way. The grid used to convert the observed actual population sizes into scores is provided in Table 4.
Grid for converting the observed number of breeding females into scores, depending on species or species group.

Scores range from 0 (no risk) to 5 (maximum risk), and the numbers given are the bounds for a particular score. For example, for horse and donkey breeds, a score of 5 is given when the number of females is below 150, a score of 4 when the number of females is between 150 and 1 250, and so on.
Recent evolution of the number of breeding females
Demographic trends were assessed over 5 years in mammals and over five generations in poultry. The trends (T 5) were determined by simply comparing the current number of breeding females (Nf t ) to the number present 5 years or generations before (Nf t−5):
 $$T_5 = \displaystyle{{Nf_t - Nf_{t - 5}} \over {Nf_{t - 5}}} $$
Breeds with stable or increasing population sizes were considered to be at no risk at all and were thus allocated a score of 0.
For breeds with decreasing population sizes, scores were assigned using the half-life (HL) concept. By convention, a breed was considered to be at maximum risk (score of 5) when the time required to halve its population size (its HL) was less than 25 years (for mammals) or 25 generations (for poultry). If Nf 0 is the initial number of breeding females and the demographic trend per year or per generation (Ta) is constant over time, then the number of breeding females at time t is:
 $$Nf_t = Nf_0 (1 + Ta)^t $$
A population's HL corresponds to the value of t when Nf t equals to (1/2)Nf 0:
 $$HL = \displaystyle{{\log (1/2)} \over {\log (1 + Ta)}}$$
From this equation, it can be shown that a HL of 25 corresponds to an annual trend (Ta) of −0.027 (decrease of 2.7 percent per year or per generation). This value corresponds to a rate of decline of 12.9 percent over 5 years or generations (T 5). In order to make it easier to fit the values to a scale from 1 to 5 (recalling that the score of 0 was applied only to no-risk breeds), this value was rounded to −12 percent. Subsequently, the score increased by 1 point when the 5-year or five-generation rate decreased by 3 percentage points. The conversion grid, which was the same for all species, is provided in Table 5.
Grid for converting the observed change in the number of breeding females over the last 5 years (mammals) or generations (poultry) into scores.

Scores range from 0 (no risk) to 5 (maximum risk), and the numbers given are the bounds for a particular score; scoring is not species dependent. For example, a score of 0 is given when the trend is positive or null, a score of 1 when the trend is between −3 and 0% and so on.
Percentage of cross-breeding
In this study, “cross-breeding” refers to the practice of cross-breeding (e.g. for commercial purposes) plus any other reasons for which offspring were excluded from the breed's stud book (e.g. unknown parentage). A direct consequence of cross-breeding is that fewer young animals are potentially available to replace old breeding animals that have been culled. Using the same notation system as above, if C is the proportion of offspring born from cross-breeding or excluded from the stud book for other reasons, then the number of young purebred females available for breeding (Yf) is described by the equation:
 $$Yf = \displaystyle{1 \over 2}N(1 - C) \times Nf$$
A null value of C means that a breed is not at risk and, therefore, corresponds to a score of 0.
At the other extreme, a score of 5 (maximum risk) was allocated when C was high enough that breeding animals could no longer be replaced (i.e. the number of young purebred females was lower than the number of culled old females). If C max is the maximum value of C allowing replacement, then C max is first determined by solving the following equation:
 $$\displaystyle{1 \over 2}N(1 - C) \times Nf_t = \; (1 - R) \times Nf$$
where R is the rate at which old females are culled (see section Number of breeding females). Then, C max can be defined in the following way:
 $$C_{{\rm max}} = 1 - \displaystyle{{2R} \over N}$$
This maximal value of cross-breeding was calculated using the same parameters employed to calculate the number of breeding females. The species-specific values of C max are provided in Table 2 (last column). Indeed, because of their high level of fecundity, poultry and pigs have a very high rate of cross-breeding that allows replacement; in contrast, cross-breeding has to be restricted in low-fecundity species such as equines or cattle.
Having defined the thresholds for the scores of 0 and 5, the thresholds for the intermediate scores were then spaced at equal distances between these lower and upper values (Table 6). Note that, for simplicity's sake, the thresholds used to allocate a score of 5 were rounded for pigs and poultry.
Grid for converting the observed percentage of cross-breeding into scores, according to species or species group.

Scores range from 0 (no risk) to 5 (maximum risk), and the numbers given are the bounds for a particular score. For example, for all species, a score of 0 is given when the percentage of cross-breeding is 0 (no cross-breeding at all); for horse and donkey breeds, a score of 1 is given when the percentage of cross-breeding is between 0 and 10% and so on.
Effective population size
Effective population size (Ne) is a parameter of paramount importance when monitoring both domesticated and wild animal populations. For instance, it allows changes in genetic variability within populations to be predicted (Wright, Reference Wright1931). Because the availability of molecular data was very heterogeneous across local breeds, effective population sizes were estimated using exclusively genealogical data, by applying the procedure implemented by the French National Observatory of Genetic Variability of Ruminant and Equine Breeds (Danchin-Burge et al., Reference Danchin-Burge, Verrier, Laloë, Saintilan and Leroy2014).
For each breed, the sample population comprised animals born over the last 4 or 5 years or generations, depending on demographics (overlapping vs separate generations) and the amount of data available. In equines, a large number of both male and female young are registered yearly therefore the sample population comprised both males and females. In other species, only a few males are registered yearly and consequently the sample populations comprised females only. As recommended by Leroy et al. (Reference Leroy, Mary-Huard, Verrier, Danvy, Charvolin and Danchin-Burge2013), the method used to estimate Ne depended on pedigree depth as assessed by the equivalent number of known generations (EqG) (Boichard Maignel and Verrier Reference Boichard, Maignel and Verrier1997). This parameter is estimated by counting the number of known ancestors of each animal and can be interpreted as follows: pedigree depth is equivalent to the depth in a population where all ancestors are known over a number of generations equal to EqG.
If pedigree depth was sufficiently great (EqG ≥ 2.5), then the rate of kinship within the population (ΔΦ) was estimated as per Cervantes et al. (Reference Cervantes, Goyache, Molina, Valera and Gutiérrez2011). Ne was then estimated using the following classic equation (Wright, Reference Wright1931):
 $$Ne = \displaystyle{1 \over {2\it \Delta \Phi}} $$
If pedigree depth was shallow (EqG <2.5), then Ne was estimated as follows:
 $$\displaystyle{1 \over {Ne}} = \displaystyle{1 \over {4Nm}} + \displaystyle{1 \over {4Nf}}$$
where Nm and Nf are the numbers of male and female breeding animals, respectively.
There are many possible ways of converting effective population size into an indicator of breed risk status (e.g. Frankham, Bradshow and Brook Reference Frankham, Bradshow and Brook2014). As in the case of the change in the number of breeding females, the time required for a given decrease in genetic variability was used. Because genetic variability changes asymptotically over time under pure drift, it is not useful to estimate its HL because it refers to a far too distant time point. For instance, when the effective size of a population is 40, the HL of its genetic variability is 55 generations (i.e. about five centuries of equine selection). We therefore used nine-tenth-of-life (NTL), i.e. the time required for genetic variability to decrease by 10percent under drift. The expected proportion of heterozygotes at an anonymous locus (He) was used as an estimate of genetic variability. According to Wright (Reference Wright1931), under pure drift, the value of this parameter at generation t (He t ) can be predicted if effective population size (Ne) is known:
 $$He_t = He_0 \left( {1 - \displaystyle{1 \over {2Ne}}} \right)^t $$
where He 0 is the initial value of He. By definition NTL of He corresponds to the value of t when He t is equal to 0.9 He 0. Consequently,
 $$NTL = \displaystyle{{\log \left( {0.9} \right)} \over {\log \left( {1 - \{ 1/2Ne\} } \right)}}$$
By convention, we decided to allocate a score of 5 (maximum risk) to NTL values of less than ten generations. The threshold associated with this value was equal to 47.7, which was rounded down to 45. Also by convention, we decided to allocate a score of 0 (no risk) to NTL values of greater than 50 generations. The threshold associated with this value was equal to 237.5, which was rounded up to 245. These two extreme rounded values served as bounds to establish the thresholds for the intermediate scores: the score increased by 1 point when the estimated value of Ne decreased by 50 (Table 7).
Grid for converting estimated effective size into scores.

Scores range from 0 (no risk) to 5 (maximum risk), and the numbers given are the bounds for a particular score; scoring is not species dependent. For example, a score of 5 is given when effective population size is lower than 45, a score of 4 when it is between 45 and 95 and so on.
Breeder organization and technical support
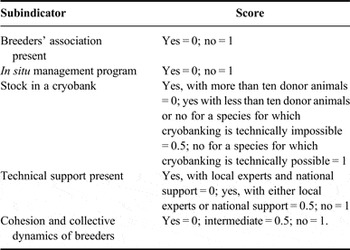
This indicator clearly differs from the previously described indicators; the information required to define it was largely qualitative. The approach was to identify five different subindicators that described the degree to which breed management is organized and that express whether breeders benefit from support for the development of technical programs (Table 8). Subindicator scores were defined via risk presence vs absence: a score of 1 was allocated to situations in which breeds were most at risk, whereas a score of 0 was allocated to situations favouring good breed management. Note that, for some subindicators, it was possible to allocate intermediate scores (i.e. a score of 0.5). The total score for this indicator was the sum of the five subindicator scores.
Subindicators used to assess breeder organization and technical support.

The total score for the indicator is the sum of the scores of the five subindicators and thus ranges from 0 (no risk) to 5 (maximum risk).
Socio-economic context
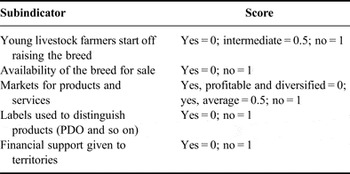
The approach was the same as for the previous indicator. Five different subindicators were defined, which were used to characterize the social and economic contexts farmers have to deal with (Table 9). As above, a score of 1 was allocated to situations in which breed value and development were adversely affected, whereas a score of 0 was allocated to situations in which breed value and development were most enhanced. Some subindicators could have intermediate scores. The total score for this indicator was the sum of the five subindicator scores.
Subindicators used to describe the socio-economic context.

The total score for the indicator is the sum of the scores for the five subindicators and thus ranges from 0 (no risk) to 5 (maximum risk).
Results
Examples of breed characterization
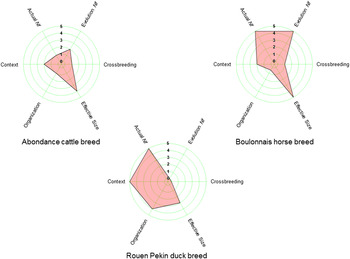
To illustrate the application of the risk assessment method, Figure 1 shows the radar charts obtained for three French local breeds: the Abondance cattle breed, the Boulonnais horse breed and the Rouen Pekin duck breed. These three breeds are in different situations.
Example radar charts for three French local breeds. For each indicator, scores range from 0 (no risk) to 5 (maximum risk). Actual Nf = number of breeding females; evolution Nf = evolution of the number of breeding females during the last 5 years or generations; cross-breeding = percentage of crossbreeding; effective size = effective population size (Ne); organization = breeder organization and technical support; context = socio-economic context.

The Abondance breed is a robust dairy cattle breed found in the northern French Alps, cows being moved between higher-elevation summer pastures and lower-elevation winter farms. The way the different scores were obtained can be described as follows:
-
(i) According to the national database for cattle breeding, 48 876 breeding females were present in 2013, which corresponds to a score of 1 (see Table 4).
-
(ii) According to the same database, there were 50 885 breeding females in 2008. Then, the evolution of Nf between 2013 and 2008 was equal to −3.9 percent, which corresponds to a score of 2 (see Table 5).
-
(iii) According to both Institut de l'Elevage (national technical institute for ruminants) and the Abondance breeders association, usually, about 10 percent of cows do not reproduce within the breed. This is mainly due to the practice of cross-breeding with bulls from beef breeds and, to a lower extent, to the lack of pedigree information of some female heifers because of the extensive farming system. Then, the score for the rate of “cross-breeding” was equal to 1 (see Table 6).
-
(iv) Based on the rate of kinship (pedigree depth was considered as being great enough), the effective size (Ne) of the breed was found to be equal to 51, which corresponds to a score of 4 (see Table 7).
-
(v) Dealing with organization and technical support (see Table 8), there is a well-established breeders’ association (subscore = 0, i.e. no risk). A breeding company manages a breeding program that performed progeny testing of young AI bulls up until 2014 and that is now performing genomic selection (subscore = 0). In the national cryobank (http://www.cryobanque.org), there are 8 600 doses of semen originating from 66 different bulls (subscore = 0). Technical support is active, both at the national and local levels (subscore = 0). For a long time, there were controversies between breeders about the introgression of Red Holstein genes and, more generally, about the definition of breeding goals, with a clear opposition between breeders promoting a “true” mountain farming system and breeders from piedmont areas (Lambert-Derkimba, Lauvie and Verrier Reference Lambert-Derkimba, Lauvie and Verrier2013) (subscore = 1). Finally, the score for “Organization” was equal to 1.
-
(vi) Dealing with the socio-economic context (see Table 9), according to the breeders’ association, it is difficult for young farmers to start mainly because the access to land is highly competitive (subscore = 1, i.e. risk), and a few breeding females are available for sale (subscore = 1). The breed is mainly used to produce milk to make cheeses with a good diversity of products and high price paid to farmers for milk (Lambert-Derkimba, Lauvie and Verrier Reference Lambert-Derkimba, Lauvie and Verrier2013) and also provides with services in the management of Mountain landscapes (Verrier et al., Reference Verrier, Tixier-Boichard, Bernigaud and Naves2005) (subscore = 0). In the area, there are four cheeses with a protected designation of origin (PDO) and a very short list of breeds allowed to produce milk for these cheeses, and it is estimated that 40 percent of the milk produced by all the Abondance cows is used for these PDO cheeses (Lambert-Derkimba, Casabianca and Verrier Reference Lambert-Derkimba, Casabianca and Verrier2006) (subscore = 0). The breeders’ association benefits from both local and national subsidies (subscore = 0). Finally, the score for “Context” was equal to 2.
Finally, the overall score for the Abondance breed was found to be equal to 1.83, signifying that this breed is facing a limited risk of extinction. The radar chart (Figure 1) provides with a valuable complementary information, clearly showing that the main concern about this breed is its low effective population size (note that such low values are commonly observed in dairy cattle populations subject to selection, e.g. Danchin-Burge et al., Reference Danchin-Burge, Leroy, Moureaux and Verrier2012).
The other two breeds in Figure 1 are the draught horse Boulonnais breed and the local Rouen duck breed. Their overall scores were 3.08 and 2.83, respectively, meaning that these breeds are more endangered than the Abondance cattle breed. The Boulonnais breed received a high score because it received the maximum score for three indicators, namely the number of breeding females (in 2013, Nf = 483), the recent evolution of this number (T 5 = −22.3 percent) and the effective population size (on the basis of the rate of kinship, Ne = 40). In the case of the Rouen breed, the highest scores were found for the economic context (the breed is facing major economic difficulties), the number of breeding females (in 2013, Nf = 100) and the effective population size (based on the numbers of breeding parents only, Ne = 53).
Score distribution and correlations between indicators
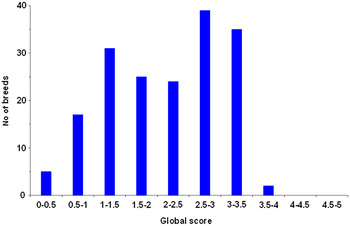
The distribution of the overall scores (i.e. the simple means of the scores for the six indicators) for the 178 breeds examined is depicted in Figure 2. It is bimodal, with one peak between 1 and 1.5 and a second peak between 2.5 and 3.0. The distribution was skewed to the left (less risk): the lowest value was 0, for the Mouton Charollais sheep breed, and the highest value was 3.92, for the Bourbonnais donkey breed. The overall mean was 2.15 and the standard deviation was 0.90.
Distribution of overall risk assessment scores for the 178 local breeds examined. Scores range from 0 (no risk) to 5 (maximum risk).

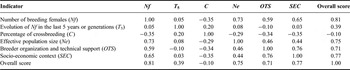
Certain indicators were correlated (Table 10). The largest positive correlations, ranging from +0.44 to +0.77, involved four indicators, namely the number of breeding females (Nf), the effective population size (Ne), the breeder organization and technical support (OTS) and the socio-economic context (SEC). The evolution of the number of breeding females (T 5) was more or less uncorrelated with the other indicators, whereas the percentage of cross-breeding was negatively correlated with the other indicators (−0.10 to −0.35). As a consequence, the overall score mainly depended on Nf, Ne, OTS and SEC, with correlations ranging from +0.71 to +0.81.
Pairwise correlations between the six indicators and the overall score on the 178 local breeds under study (based on the information collected in 2014).

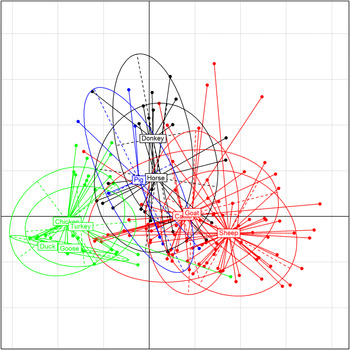
Differences in score distributions among species or groups of species are depicted in Figure 3. Clearly, poultry are distinct. First, the breeds belonging to the four poultry species form a cluster that is narrower than those formed by breeds of other species. This distribution pattern is probably a consequence of the fact that only poultry breeds undergoing official recognition were included in this study, and such breeds share many common characteristics. For instance, their actual population sizes are generally small, they experience no cross-breeding, they have an established breeders’ association, the organisation of breeding is more or less pyramidal and they benefit from a technical support by the French federation of poultry breeding companies. Second, on the graph, there was minimal overlap among the poultry breeds and breeds belonging to other groups of species, mainly because the poultry breeds generally had smaller actual population sizes (results not shown).
Principal component analysis of the scores of the 178 breeds examined (on the basis of the six separate indicator scores plus the overall score). Breeds were grouped by species clusters: black = equines (horse and donkey), red = ruminants (cattle, sheep and goat), blue = pig, green = poultry (chicken, turkey, goose and Pekin duck).

Applying the multi-indicator method to help France implement European regulations aimed at saving endangered breeds
When applying the EU Council Regulation on support for rural development (RDR2), member countries can give subsidies to farmers who raise local breeds in danger of extinction (the agroenvironment measure). Among other rules, over the period from 2014 to 2020, each breed's number of breeding females and risk status must be assessed by a scientific institution. In France, the national research institute for agricultural research, namely INRA, coordinates such efforts, with the help of technical institutes and breeders’ associations.
The multi-indicator method presented in this study was adopted. The purpose was to define clear and simple rules that could reveal whether or not breeds (and thus breeders) were eligible for subsidies under the agroenvironment measure. The multi-indicator method described above was adapted as follows:
-
(i) Species-specific thresholds for eligibility were defined based on numbers of breeding females (primary indicator).
-
(ii) The other five indicators were used to characterize other aspects of breed condition. Conditions were considered as being adverse if the mean of the five scores was greater than 2.5 or if two of the five scores were equal to or greater than 4.
-
(iii) If conditions were considered as being not adverse, the eligibility thresholds were the upper bounds associated with a score of 3 in the category “number of breeding females” (e.g. 10 000 mares, 7 500 cows, etc.; see Table 3). If conditions were considered adverse, threshold values were augmented by 20 percent.
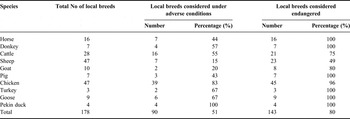
Table 11 shows the results of applying this method to the 178 local breeds analysed in this study. Overall, about half the breeds under study were considered as being under adverse conditions (based on 5 indicators, actual number of females excluded). Overall too, the proportion of breeds considered endangered (based on the six indicators) is much higher (80 percent). This result shows that a number of breeds are endangered even if their conditions are not adverse, only because of their small actual population size. On the opposite, some breeds have a large actual population size but their conditions are considered adverse (results not shown here). Then, the value of the five other indicators is to provide us with a complementary view of the status of a given breed and to highlight the cases of breeds that could be endangered in the future due to current adverse conditions.
Total number of French local breeds (according to French regulations) and the number of French local breeds considered to be endangered according to the proposed method (based on information collected in 2014).

The different species showed different pictures. In the case of pigs, equines and poultry, all breeds or almost all breeds (96 percent of chickens) were considered endangered. For these species too, the proportion of breeds under adverse conditions was found to be the highest. These findings highlight that it is difficult to maintain local breeds of these species under current conditions in Europe. In contrast, only 50 percent of sheep breeds were found to be at risk. This result does not mean that sheep farmers find themselves in a better situation. It is a consequence of the fact that France's sheep stock mainly comprises local breeds, including many breeds with large to very large actual population sizes.
Comparison of the proposed method with the risk assessment system by FAO
Table 12 shows the distribution of the 178 breeds under study in the categories defined by the FAO system (see Table 2) and a comparison with the status of endangerment as assessed with our method (see above). All breeds are in three FAO categories only, i.e. no breed was considered as being “Endangered” or “Critical”. This result is due to the nature of our set of breeds. For mammalian species, only the officially recognized breeds were considered. All these breeds have a breeders’ association and they are all managed within the framework of a selection program or a conservation program, conservation activities being coordinated at the national level species by species. Then, even if these breeds are considered as being “Endangered” or “Critical” because of their numbers of breeding animals, they are all considered as being “Maintained” according to the FAO criteria (see Table 2). For poultry, only the breeds for which a process of official recognition is ongoing were considered. All these poultry breeds have a breeder association (if not, the recognition process could not be started) and they all benefit of the technical support of the French federation of poultry breeding companies. Then, here again, all these breeds were considered as being “Maintained”.
Joint distribution of 178 French local breeds in the risk status defined by FAO (see Table 2) and in the status according to the proposed method.

Results obtained with both systems were consistent for the worst situations (Table 12): all breeds considered as being “Critical maintained” and all breeds but one considered as being “Endangered maintained”, according to the FAO system, were considered as being “Endangered” when using our method. The only exception was the case of a chicken breed, namely the Noirans-Marans breed, with a number of breeding females (Nf = 753) being below the FAO's endangerment threshold (1 000) but above that of our method (500). Conversely 53 percent (39/73) of the breeds considered as being “Not at risk” according to the FAO system, were considered as being “Endangered” according to our method: these 39 breeds belong to the sheep (19), cattle (10), horse (6) and goat (4) species (results not shown). These discrepancies were mainly due to differences in threshold for the number of breeding females (Nf). In the FAO system, thresholds are the same for all domesticated species, whereas, in our method, thresholds are species-dependent: for ruminants and equids species, our endangerment threshold is higher than that of the FAO system, whereas it is lower for poultry.
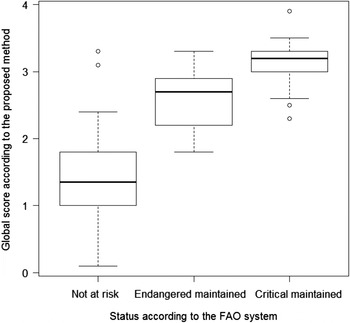
Figure 4 shows the distribution of the overall scores obtained with our method according to the status defined with the FAO system. Clearly, the higher the degree of threat according to FAO, the higher the median (wide horizontal line) and the lower the main range of variation (distance between the two whiskers) of the overall scores according to our method. The first result (median) illustrates some consistency between both methods. To be precise (results not shown), the Pearson correlation between the arbitrary scores assigned to the different FAO status (Not at risk = 0, Endangered maintained = 1, and so on, see Table 2) and our overall scores was found to be equal to +0.76 for all breeds from all species, ranging from +0.36 (goat) to +1.00 (duck). The second result (range of variation) illustrates the discrepancies evoked above: category “Not at risk” showed the wider range of variation because it comprised breeds considered as being “Not endangered” according to our method, and then with a low overall score, as well as breeds considered as being “Endangered” according to our method, and then with a high overall score.
Boxplot of the global (overall) scores obtained with our method (ranging continuously from 0 to 5) according to the status of the breeds defined with the FAO risk assessment system (three categories represented only).

Discussion and conclusions
The aim of the method proposed here is to account for the various factors that place a given breed at risk of extinction. Some of the indicators employed, such as the current number of breeding females or its change over a 5-year period, are similar or equivalent to criteria used in other risk assessment methods (FAO, 2004; Gandini et al., Reference Gandini, Ollivier, Danell, Distl, Geogoudis, Groeneveld, Martyniuk, Van Arendonk and Woolliams2004). However, in contrast to other methods, which estimate effective population size (N e ) based on the number of breeding males and females, the method described here used pedigree information, because it can account for unbalanced progeny sizes and historical bottlenecks (Leroy et al., Reference Leroy, Mary-Huard, Verrier, Danvy, Charvolin and Danchin-Burge2013). Among the 178 breeds studied, 99 (56 percent) had enough pedigree information (EqG >2.5) to allow N e to be estimated from the increase of kinship. It should be noted that, based on Leroy et al. (Reference Leroy, Mary-Huard, Verrier, Danvy, Charvolin and Danchin-Burge2013), the effective population sizes of the other breeds were probably overestimated.
Three indicators in the method proposed here, namely the percentage of cross-breeding, breeder organization and technical support and socio-economic context, have yet to be included in other methods, despite their very real impact on breed sustainability. In the case of the latter two indicators, many subindicators may be difficult to assess accurately and may require the opinions of experts. Some indicators included in other methods were not used here, either because they have an ambiguous relationship with risk status (as in the case of geographical concentration [Alderson, Reference Alderson2010], as discussed above) or because they were considered to have negligible effects on local-level risk status. For instance, except in a few controversial cases (e.g. Lauvie et al., Reference Lauvie, Danchin-Burge, Audiot, Brives, Casabianca and Verrier2008), introgression rate is not currently considered to represent a threat for French local breeds. However, it should be noted that the cross-breeding practices examined here (i.e. production of cross-bred animals that will never breed) differ from introgression (i.e. production of cross-bred animals that will be the parents of future young).
Nevertheless, the multi-indicator method described in this study is probably more comprehensive than any other previously proposed methods (Gandini et al., Reference Gandini, Ollivier, Danell, Distl, Geogoudis, Groeneveld, Martyniuk, Van Arendonk and Woolliams2004; FAO, Reference Pilling and Scherf2010; Alderson, Reference Alderson2010). To use a larger number of indicators and to average six different scores led to a more continuous view of the degree of risk. More specifically, we showed that our method and the FAO system were consistent for the breeds considered as being in the worst situations. However, because of using species-dependent thresholds for the number of breeding females and considering several other indicators, our method can lead to consider as being endangered for some breeds that are considered as being not at risk by FAO, as it was definitively the case for the set of breeds under study.
The information required to define the indicators is rather simple to obtain, and indicator values are easily calculated. Finally, the fact that the method uses a combination of several indicators should minimize the risk that its purpose will be subverted: the more indicators used to assess breed risk status, the harder will it be for breeders to voluntary maintain indicator values at levels that unlock subsidies.
As previously stated, the indicators and thresholds chosen in this study correspond to circumstances in France. While this method may be well suited to other European countries as well, it may not function adequately in countries where conditions are substantially different. For instance, in the second State of the World's Animal Genetic Resources for Food and Agriculture report (FAO, 2015), indiscriminate cross-breeding (i.e. introgression) was identified as the primary cause of genetic erosion in animal genetic resources in African countries, while it plays only a secondary role in Europe and the Caucasus. Similarly, the indicators or subindicators used should depend on the availability of the information required to calculate them. Risk assessment methods must therefore be adapted to local conditions and take into account specific threats, available information and potential incentives.
Finally, any method used must be able to evolve in response to feedback, technological advances (e.g. the use of genomic information) and changes in national and European legislation, which could either modify risk thresholds or prompt a change in indicators.
Acknowledgements
This study was funded by the French Ministry of Agriculture. The authors thank the staff of breeders associations for the access to very useful data. Useful comments and suggestions by Denis Milan, head of the Animal Genetics Division of INRA, and by the steering committee appointed by the Ministry of Agriculture are acknowledged. Authors also thank Jessica Pearce-Duvet for linguistic revision.