Introduction
Metallic glasses (MGs) are promising structural materials due to their attractive properties, such as high yield strength, large elastic limit, and excellent wear resistance [Reference Ashby and Greer1, Reference Tian, Cheng, Shan, Li, Wang, Han, Sun and Ma2, Reference Greer and Ma3, Reference Wang4]. Unlike dislocation-mediated plasticity of crystalline materials, plastic deformation of MGs is accommodated by shear banding, but subsequent rapid propagation of shear bands and strain localization lead to limited plasticity at room temperature [Reference Schuh, Hufnagel and Ramamurty5, Reference Greer, Cheng and Ma6, Reference Zhang, Eckert and Schultz7]. Successful control of shear banding could enhance the plasticity of MGs [Reference Das, Tang, Kim, Theissmann, Baier, Wang and Eckert8, Reference Liu, Wang, Wang, Pan and Wang9, Reference Chen, Inoue, Zhang and Sakurai10]. At atomic scale, free volume model [Reference Spaepen11] and shear transformation zone (STZ) model [Reference Argon12, Reference Johnson and Samwer13, Reference Bouchbinder, Langer and Procaccia14] can be used to explain the deformation of MGs. Both models show that shear banding leads to softening due to shear dilation or structural disorder. Without barriers like nanocrystals or interfaces, shear bands cannot be diverted or arrested, but intermittent shear banding process is still observed in the form of pop-in events under nanoindentation [Reference Schuh, Nieh and Kawamura15, Reference Schuh, Lund and Nieh16, Reference Greer, Castellero, Madge, Walker and Wilde17] and serrated flows on the stress–strain curves under compression [Reference Wang, Fujita, Zeng, Nishiyama, Inoue and Chen18, Reference Qiao, Zhang and Liaw19, Reference Ke, Sun, Liu and Yang20, Reference Ye, Lu, Yang and Liaw21, Reference Wang, Chan, Xia, Yu, Shen and Wang22]. Serrated flows reveal the dynamic properties of shear bands, and the underlying physics and mechanisms of serrated flows have been a subject of significant interest. Cheng et al. [Reference Cheng, Han, Li and Ma23] demonstrated that shear banding can be “cold” in a stop-and-go manner (serrated) or “hot” in a catastrophic manner (non-serrated) affected by the heat generated in shear bands. Sun et al. [Reference Sun, Yu, Jiao, Bai, Zhao and Wang24] showed that serrated flows with a power law distribution can be observed in ductile MGs and explained by the stick-slip model. The origin of serrated flows can be well explained by combining atomistic cooperative shearing model of STZs and macroscopic stick-slip model [Reference Sun, Pauly, Hu, Wang, Kühn and Eckert25]. Maaß and Löffler [Reference Maaß and Löffler26] showed dynamic behaviors of shear bands associated with serrated flows: first, shear bands are initiated due to stress-induced structural dilatation similar to supercooled liquid regime; next, shear bands propagate via a symmetric acceleration and deceleration process related to thermally activated atomistic relaxation process; and afterwards, broken atomic bonds (during initiation stage) reform and shear bands are then arrested.
Extrinsically, the transition from serrated to non-serrated flows occurs with the increase in sample size and strain rate and with the decrease in machine compliance and testing temperature; intrinsically, serrated flows are also affected by elastic modulus and glass transition temperature [Reference Cheng, Han, Li and Ma23, Reference Sun, Yu, Jiao, Bai, Zhao and Wang24, Reference Sun, Pauly, Hu, Wang, Kühn and Eckert25, Reference Maaß and Löffler26, Reference Han, Wu, Li, Wei and Gao27, Reference Dubach, Dalla Torre and Löffler28]. Compared with catastrophic and nonstop propagation of few dominant shear bands in MGs, serrated flows are often desirable indicators of improved plasticity, since the stop-and-go cycle of a stable shear band potentially allows formation and interaction of multiple shear bands to accommodate larger plastic strain [Reference Cheng, Han, Li and Ma23]. Furthermore, it is beneficial to reduce the amplitude of stress-drops induced during serrated flows and increase the frequency of serrations on the stress–strain plots.
Plasticity and toughness of MGs can be enhanced by optimizing composition and processing conditions [Reference Sun and Wang29, Reference Gu, Poon, Shiflet and Lewandowski30, Reference Zhu, Ma and Xu31, Reference Murali and Ramamurty32] and introducing crystalline phases to form bulk MG composites [Reference Choi-Yim and Johnson33, Reference Eckert, Das, Pauly and Duhamel34, Reference Szuecs, Kim and Johnson35, Reference Chen, Cheng and Liu36, Reference Wu, Zhou, Song, Wang, Zhang, Ma, Wang and Lu37, Reference Fan, Ott and Hufnagel38, Reference Hofmann, Suh, Wiest, Duan, Lind, Demetriou and Johnson39] or crystalline/amorphous (C/A) nanolaminates [Reference Knorr, Cordero, Lilleodden and Volkert40, Reference Zhang, Liu, Chen, Chen, Liu, Zhang and Sun41, Reference Huang, Pei, Chang, Lee and Huang42, Reference Chu, Jang, Huang, Chou, Yang, Ye, Wang, Lee, Liu and Liaw43, Reference Nieh and Wadsworth44, Reference Wang, Li, Hamza and Barbee45, Reference Liu, Du, Lin, Pei and Huang46, Reference Zhang, Liu, Lei, Niu and Sun47, Reference Fan, Li, Yang, Wang, Li, Xue, Wang, Lou and Zhang48]. C/A interfaces greatly affect the plasticity transfer and co-deformation between crystalline and amorphous phases [Reference Wang, Hamza and Barbee49, Reference Guo, Jägle, Choi, Yao, Kostka, Schneider and Raabe50, Reference Fan, Xue, Wang, Yu, Wang and Zhang51, Reference Wang, Zhou, Shao and Misra52, Reference Fan, Liu, Xue, Rahimi, Bahr, Wang and Zhang53]. Besides, cyclic pre-deformations on MGs even in elastic regime can alter the local STZ operations and thus affect the mechanical behaviors of MGs [Reference Packard, Homer, Al-Aqeeli and Schuh54, Reference Packard, Witmer and Schuh55, Reference Ye, Lu, Liu, Wang and Yang56, Reference Tong, Iwashita, Dmowski, Bei, Yokoyama and Egami57]. The effects of constituents (compositions), pre-deformation, and layer interfaces on serrated flow, however, are not well understood. A thorough investigation of their correlations is beneficial for connecting the atomic-scale deformations with macroscopic shear banding processes, understanding serrated flows, and improving plasticity of MGs.
In this study, we performed systematic micropillar compression tests at room temperature on amorphous-CuNb (referred to as a-CuNb hereafter), amorphous-CuZr (a-CuZr), and Cu/amorphous-CuNb (Cu/a-CuNb) multilayers. Our results show that the elastic pre-deformation (tapping) prominently alleviates serrated flows in a-CuNb, but its influence on shear serrations in a-CuZr is quite different. Meanwhile layer interfaces also play an important role in suppressing serrated flows in Cu/a-CuNb multilayers. The influences of pre-deformation and layer interfaces on shear serrations are discussed.
Results
Compression tests without pre-deformation (untapped pillars)
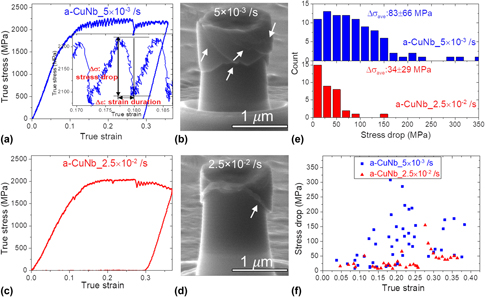
A summary of modulus, hardness, flow stress, diameter, aspect ratio, and system stiffness of all the tested specimens is shown in Supplementary material Table I. The specimens with nearly the same aspect ratios were tested using the same instrument (to ensure identical machine stiffness) at the same temperature to distinguish the effect of extrinsic and intrinsic properties on serrated flows. Figure 1 compares the a-CuNb pillars tested at strain rates of 5 × 10⁻³ s−1 and 2.5 × 10⁻² s−1 without pre-deformation (untapped). Serrated flow is more pronounced at 5 × 10⁻³ s−1 [Fig. 1(a)] than higher strain rate, 2.5 × 10⁻² s−1 [Fig. 1(c)], in terms of both amplitude and frequency of stress-drops. All the untapped a-CuNb pillars tested at various strain rates show obvious shear bands [Figs. 1(b) and 1(d)]. The method for determination of stress-drop and strain duration is shown in the inset in Fig. 1(a), same as what has been used in literature [Reference Ke, Sun, Liu and Yang20, Reference Sun, Yu, Jiao, Bai, Zhao and Wang24]. At 5 × 10⁻³ s−1, the major stress-drop may reach as large as 350 MPa (∼1/6 of the flow stress), corresponding to one major shear band formation as evidenced from in situ compression video. When increasing the strain rate from 5 × 10⁻³ s−1 to 2.5 × 10⁻² s−1, the average stress-drop (Δσave) decreases from 82 ± 66 to 34 ± 29 MPa [Fig. 1(e)]. Figure 1(f) shows the stress-drop as a function of strain for both strain rates.
In situ microcompression tests of a-CuNb pillars without pre-deformation. (a) Representative true stress–strain curve of a-CuNb pillars tested at 5 × 10⁻³ s−1 showing frequent and large stress-drops after yielding. Magnified stress–strain curve shows how stress-drop and strain duration are determined. (b) SEM image of a-CuNb pillar tested at 5 × 10⁻³ s−1 after compression. (c) True stress–strain curve of a-CuNb pillars tested at 2.5 × 10⁻² s−1 showing much less and smaller stress-drops. (d) SEM image of a-CuNb pillar tested at 2.5 × 10⁻² s−1 after compression. (e) Distribution of stress-drops at 5 × 10⁻³ s−1 and 2.5 × 10⁻² s−1. The pillars tested at 2.5 × 10⁻² s−1 exhibit a smaller average stress-drop and a narrower distribution. (f) Comparison of stress-drops at 5 × 10⁻³ s−1 (blue squares) and 2.5 × 10⁻² s−1 (red triangles) with respect to true strain. Shear bands are indicated by the arrows.

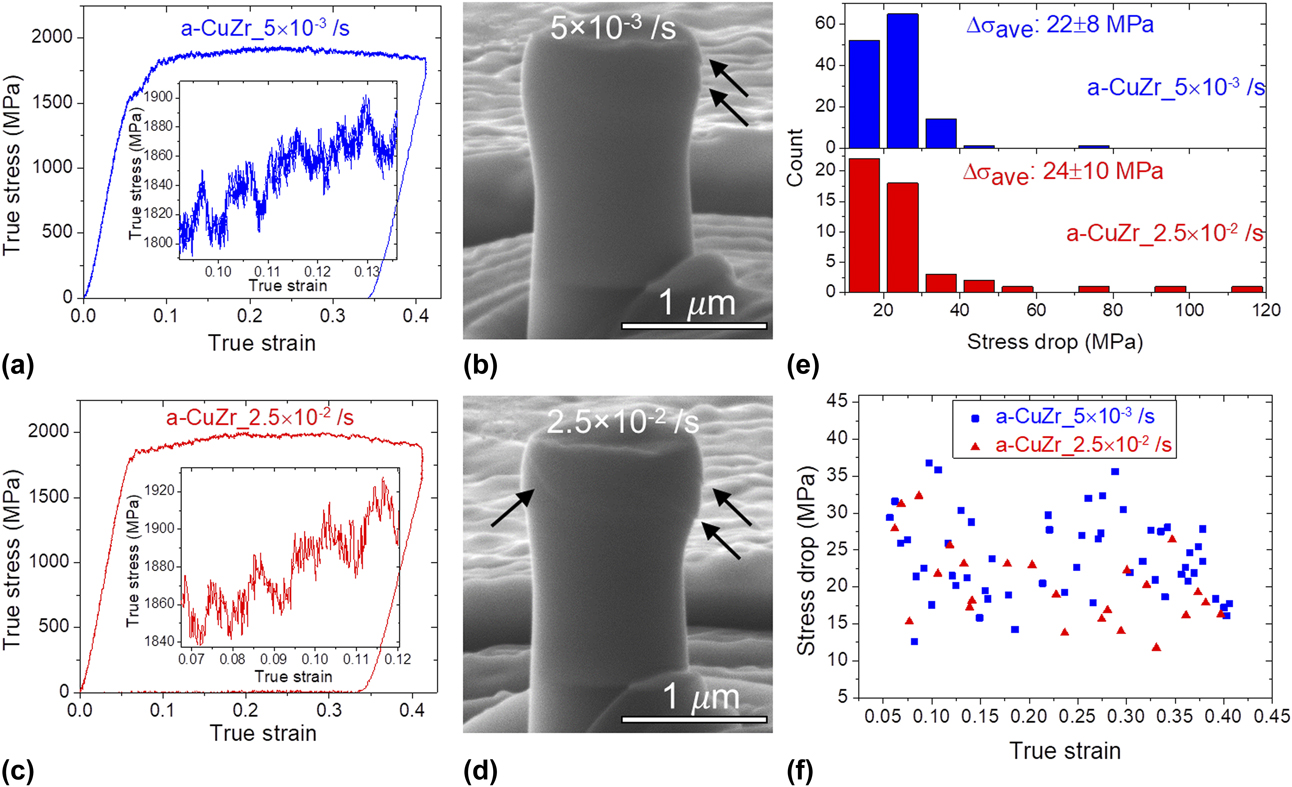
Figure 2 compares the a-CuZr pillars tested at strain rates of 5 × 10⁻³ s−1 and 2.5 × 10⁻² s−1 without pre-deformation. The amplitude of serrations is similar for both strain rates but lower than that of a-CuNb pillars [Figs. 2(a) and 2(c)]. Statistics from multiple pillars show that Δσave is 22 ± 8 MPa for 5 × 10⁻³ s−1 and 24 ± 10 MPa for 2.5 × 10⁻² s−1 [Fig. 2(e)]. The serrations are much more frequent at low strain rate. During the same strain duration, much more serration events occurred at 5 × 10⁻³ s−1 (blue squares) than at 2.5 × 10⁻² s−1 (red triangles) as shown in Fig. 2(f). Although shear bands can be identified for a-CuZr pillars [Figs. 2(b) and 2(d)], they are not as obvious as in the a-CuNb pillars (Fig. 1). Furthermore, obvious barreling phenomenon was observed for a-CuZr pillars at both strain rates.
In situ microcompression tests of a-CuZr pillars without pre-deformation. Representative true stress–strain curves of a-CuZr pillars tested at (a) 5 × 10⁻³ s−1 and (c) 2.5 × 10⁻² s−1. The insets show magnified view of stress-drops. SEM images of the pillars after compression showing few obscure shear bands indicated by the arrows at (b) 5 × 10⁻³ s−1 and (d) 2.5 × 10⁻² s−1. (e) Distribution of stress-drops at 5 × 10⁻³ s−1 and 2.5 × 10⁻² s−1. (f) Comparison of stress-drops at 5 × 10⁻³ s−1 (blue squares) and 2.5 × 10⁻² s−1 (red triangles) with respect to true strain.

Compression tests after pre-deformation (tapping)
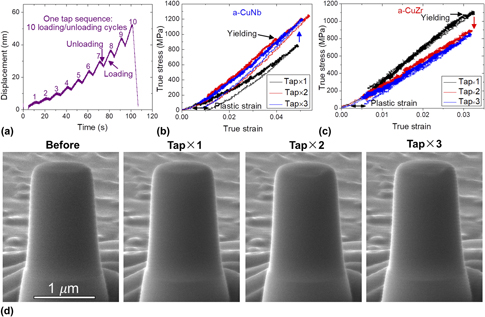
A detailed illustration of pre-deformation is shown in Fig. 3. The pre-deformation consists of multiple tap sequences in this study. One tap sequence contains 10 miniscule loading/unloading cycles with a maximum displacement of ∼50 nm, corresponding to ∼2.5% engineering strain [Fig. 3(a)]. The loading rate is slow and the unloading cycles allow MGs to recover after loading. The maximum tapping strain, ∼2.5%, is chosen to be close to the elastic limit of MGs [Reference Tian, Cheng, Shan, Li, Wang, Han, Sun and Ma2], which allows negligible plastic deformation of the pillars without forming shear bands. With more tapping, higher stress is required to reach similar strain for a-CuNb, an indication of hardening [Fig. 3(b)]. In contrast, smaller stress is required during successive tapping for a-CuZr, indicating softening after tapping [Fig. 3(c)]. The residual plastic strain after unloading due to pre-deformation (one tap sequence) is ∼1% or smaller. In situ SEM snapshots before and after each tapping [Fig. 3(d)] demonstrate no detectable morphological change nor shear band formation (see Supplementary material Video 1).
Demonstration of low-load pre-deformation (mostly elastic tapping) before compression test. (a) Displacement–time curve (load function) for one tapping sequence, including 10 miniscule loading–unloading cycles. The maximum displacement was controlled to be ∼50 nm. True stress–strain curves for three consecutive tapping sequences for (b) a-CuNb and (c) a-CuZr. (d) SEM images from in situ compression test of a-CuNb pillar before and after each tapping sequence showing basically no detectable morphological changes.

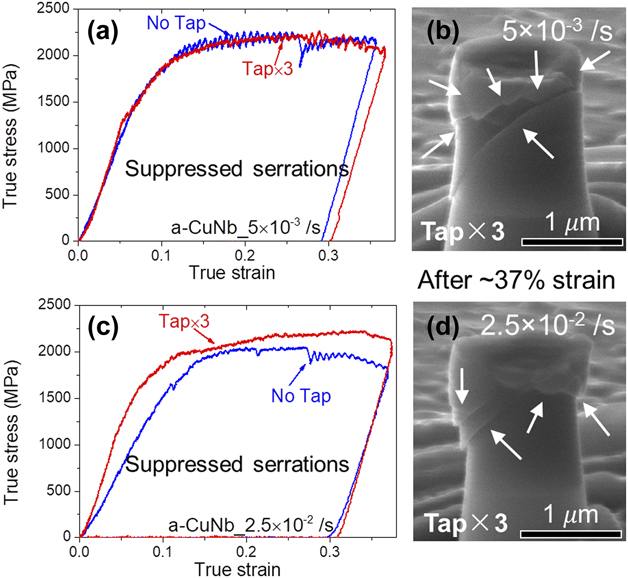
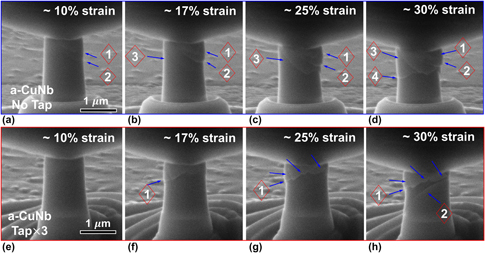
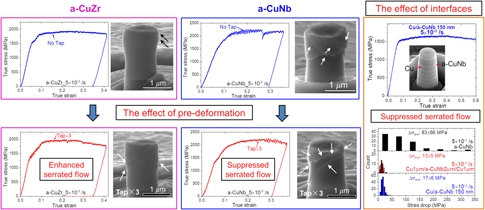
Figure 4 shows the influence of tapping on a-CuNb pillars. True stress–strain curves of untapped and pre-tapped pillars during compression at 5 × 10⁻³ s−1 [Fig. 4(a)] and 2.5 × 10⁻² s−1 [Fig. 4(c)] show that, for both strain rates, tapping effectively decreases the magnitude of stress-drops during shear serrations. Multiple intercepted shear bands can be identified for the pre-tapped pillars compressed to ∼37% true strain at both strain rates: 5 × 10⁻³ s−1 [Fig. 4(b)] and at 2.5 × 10⁻² s−1 [Fig. 4(d)]. The suppressed serrations can be clearly demonstrated by comparing in situ compression video of untapped and pre-tapped a-CuNb pillars (see Supplementary material Video 2). Figure 5 compares the in situ snapshots of untapped and pre-tapped pillars during compression. For both untapped and pre-tapped a-CuNb pillars, shear banding is the dominant deformation mechanism. But for the untapped a-CuNb pillar, isolated parallel shear bands (1, 2, 3) were formed, reached to pillar free surface, and resulted in obvious shear offset and large stress-drop. In contrast, for the pre-tapped a-CuNb pillar, although the first shear band was identified at ∼17% strain [Fig. 5(f)], it did not propagate rapidly. Instead, many secondary minor shear bands (indicated by the arrows) obstructed its propagation and led to a strenuous shear banding path.
The influence of tapping on compression tests of a-CuNb pillars. Comparison of true stress–strain curves of untapped and pre-tapped pillars compressed at (a) 5 × 10⁻³ s−1 and (c) 2.5 × 10⁻² s−1. Stress-drops are significantly reduced for pre-tapped pillars for both strain rates. SEM images of the pre-tapped pillars after compression tests at (b) 5 × 10⁻³ s−1 and (d) 2.5 × 10⁻² s−1 show obvious shear bands indicated by the arrows.

In situ snapshots of untapped and pre-tapped a-CuNb pillars during compression at a strain rate of 5 × 10⁻³ s−1. (a–d) The pillar morphology during compression for untapped a-CuNb pillar at ∼10%, 17%, 25%, and 30% true strain. (e–h) The morphology for pre-tapped a-CuNb pillar at similar strain level.

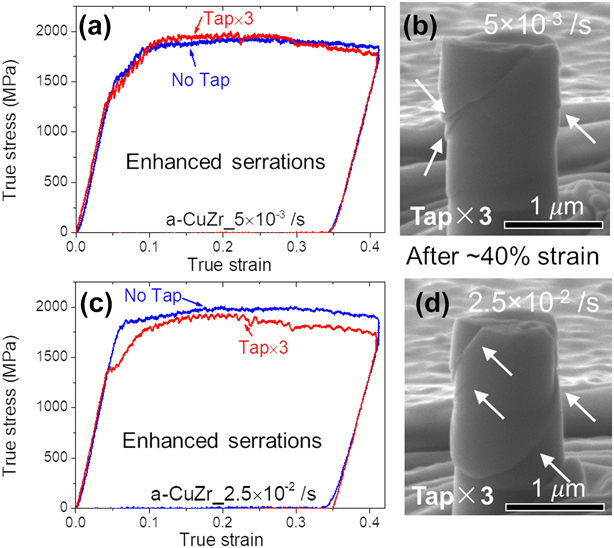
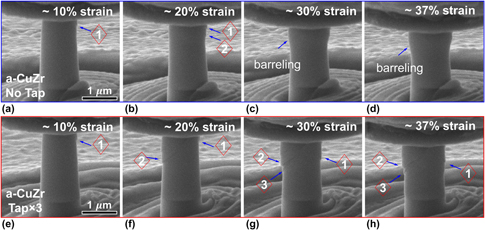
In contrast to a-CuNb, tapping enhances the magnitude of serrations in a-CuZr, as shown in the true stress–strain curves obtained at 5 × 10⁻³ s−1 [Fig. 6(a)] and 2.5 × 10⁻² s−1 [Fig. 6(c)]. The enhanced serrations can be seen by comparing in situ compression video of untapped and pre-tapped a-CuZr pillars (see Supplementary material Video 3). Moreover, clear shear bands can be identified for the pre-tapped a-CuZr pillars after compression tests [Figs. 6(b) and 6(d)], in contrast to the inconspicuous shear bands for untapped ones after compression (Fig. 2). In situ snapshots of untapped and pre-tapped a-CuZr pillars (Fig. 7) show that although shear bands can be identified for the untapped ones, its dominant deformation mode is barreling. But for the pre-tapped a-CuZr pillars, major shear bands were formed and clear shear offsets were observed.
The influence of tapping on compression tests of a-CuZr pillars. Comparison of true stress–strain curves of untapped and pre-tapped pillars compressed at (a) 5 × 10⁻³ s−1 and (c) 2.5 × 10⁻² s−1. Tapping enhanced shear serrations for both strain rates. SEM images of pre-tapped pillars after compression tests at (b) 5 × 10⁻³ s−1 and (d) 2.5 × 10⁻² s−1 show prominent shear bands indicated by the arrows compared with the inconspicuous shear bands in untapped pillars after compression as shown in Fig. 2.

In situ snapshots of untapped and pre-tapped a-CuZr pillars during compression at a strain rate of 5 × 10⁻³ s−1. (a–d) The pillar morphology during compression for untapped a-CuZr pillar at ∼10%, 20%, 30%, and 37% true strain. (e–h) The morphology for pre-tapped a-CuZr pillar at similar strain level.

Compression tests of untapped crystalline/amorphous multilayers
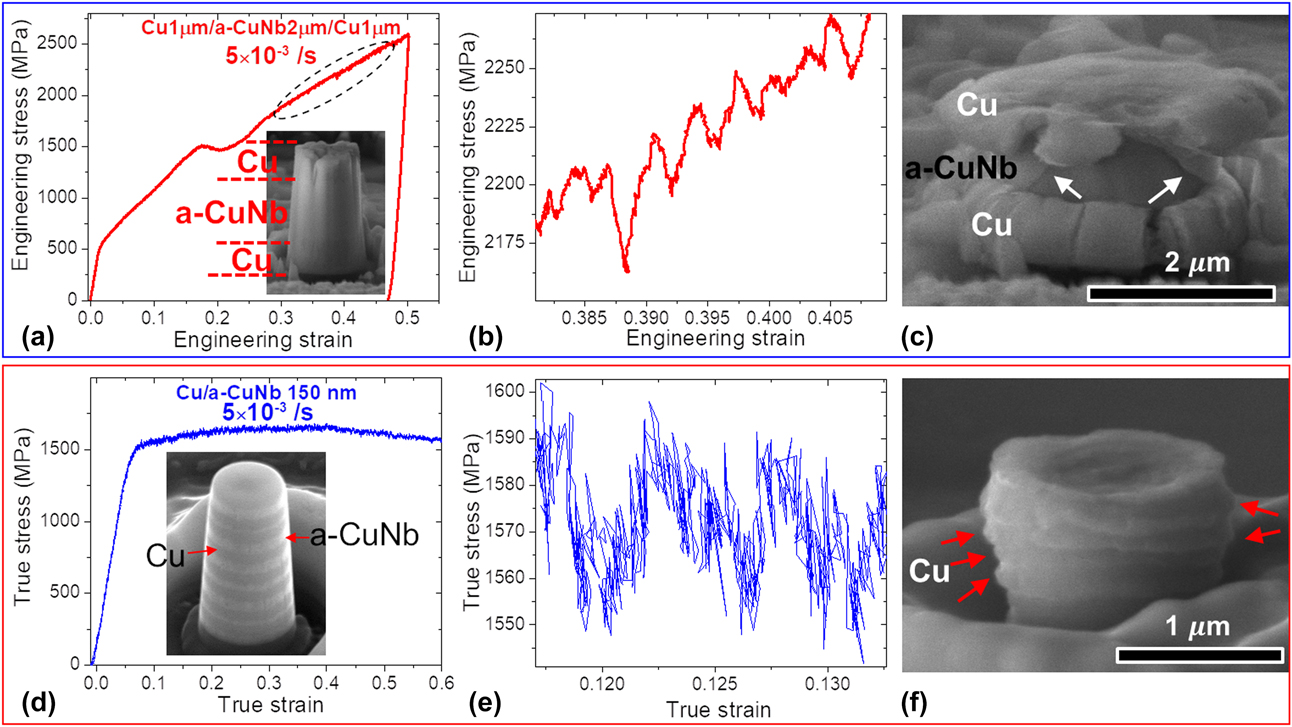
To study the effect of layer interfaces, two multilayers (Cu1 µm/a-CuNb2 µm/Cu1 µm and Cu/a-CuNb 150 nm) were selected for micropillar compression studies at the same strain rate (5 × 10⁻³ s−1) without pre-deformation. Stress–strain curves of Cu1 µm/a-CuNb2 µm/Cu1 µm and Cu/a-CuNb 150 nm are shown in Figs. 8(a) and 8(d), respectively. Since the deformation of Cu1 µm/a-CuNb2 µm/Cu1 µm starts from Cu layers before co-deformation of Cu and a-CuNb, an engineering stress–strain curve is plotted, whereas a true stress–strain curve is shown for the Cu/a-CuNb 150 nm multilayers. Detailed analysis of the engineering stress–strain curve and deformation process can be found in a previous study [Reference Fan, Li, Li, Xue, Wang and Zhang58]. Insets in Figs. 8(a) and 8(d) are the SEM images before compression. The enlarged stress–strain curves in Figs. 8(b) and 8(e) show that the magnitude of stress-drops is much smaller in both multilayers than that of untapped a-CuNb (Fig. 1). For the Cu1 µm/a-CuNb2 µm/Cu1 µm specimen, severe plastic deformation of Cu occurs before the yielding of a-CuNb which deforms subsequently by forming shear bands [Fig. 8(c)]. On the other hand, for Cu/a-CuNb 150 nm multilayers, Cu layers are extruded out as indicated by the arrows, and the multilayers deform with little detectable shear bands up to ∼60% strain [Fig. 8(f)]. In situ compression videos demonstrate serrated flows and deformation behaviors of the multilayers (see Supplementary material Videos 4 and 5).
In situ microcompression tests of Cu1 µm/a-CuNb2 µm/Cu1 µm and Cu/a-CuNb 150 nm pillars tested at 5 × 10⁻³ s−1. (a) Representative engineering stress–strain curve of Cu1 µm/a-CuNb2 µm/Cu1 µm showing relative smooth curve. (b) The enlarged stress–strain curve from (a) showing stress serrations in the range of tens of MPa. (c) SEM image of the deformed Cu1 µm/a-CuNb2 µm/Cu1 µm pillar shows significant plastic deformation of Cu, whereas a-CuNb contains several shear bands as indicated by arrows. (d) The true stress–strain curve of Cu/a-CuNb 150 nm pillar showing insignificant stress serrations. (e) The magnified view from (d) shows small stress-drops. (f) Deformation leads to obvious extrusion of Cu but not apparent shear bands in the Cu/a-CuNb 150 nm multilayers. Insets in (a) and (d) show SEM images of pillars before compression.

Discussion
A-CuNb versus a-CuZr without pre-deformation
Deformation behaviors of a-CuNb and a-CuZr
MGs with different constituent elements exhibit different mechanical behaviors: for example, Pd-, Cu-, and Zr-based MGs are generally more ductile than Mg- or Fe-based MGs [Reference Ke, Sun, Liu and Yang20, Reference Lewandowski, Wang and Greer59, Reference Ye, Lu, Yang and Liaw60]. Previous studies demonstrate good deformability of CuZr-based MGs. Das et al. showed that a-CuZr and a-CuZrAl bulk MGs (BMGs) have impressive work hardening ability due to atomic-scale inhomogeneity [Reference Das, Tang, Kim, Theissmann, Baier, Wang and Eckert8]. Chen et al. demonstrated that nanocrystallization effectively prevents work softening and arrests shear bands, leading to enhanced deformability for a-CuZr [Reference Chen, Inoue, Zhang and Sakurai10]. Liu et al. used in situ nanoindentation to reveal successive nanocrystallization in a-CuZrAl accompanied by load-drops [Reference Liu, Jian, Lee, Wang, Cao, Gutierrez, Wang, Jiang and Zhang61]. Previous study also rendered good plasticity of a-CuNb pillars [Reference Fan, Li, Li, Xue, Wang and Zhang58].
In this study, both a-CuNb and a-CuZr pillars sustain substantial compression strain (more than 40%) before failure. However, morphologies of untapped pillars after compression demonstrate that a-CuNb (Fig. 1) and a-CuZr pillars (Fig. 2) with the same diameter (1 μm) deform differently under the same testing condition. For a-CuNb pillars, plasticity is accommodated by forming shear bands. But for a-CuZr pillars, both barreling and shear banding occur, indicating a combination of homogeneous (barreling) and inhomogeneous deformation (shear banding). The obvious barreling (30% expansion in diameter on the top of a-CuZr pillars) and obscure shear bands suggest that barreling accommodates a large fraction of strain. It has been shown that with the reduction of sample size, the deformation of MGs can change from shear banding to barreling, and at certain length scale, inhomogeneous and homogeneous deformations coexist [Reference Volkert, Donohue and Spaepen62, Reference Jang and Greer63, Reference Jang, Gross and Greer64, Reference Bharathula, Lee, Wright and Flores65, Reference Shan, Li, Cheng, Minor, Syed Asif, Warren and Ma66, Reference Tönnies, Maaß and Volkert67]. The lack of barreling in a-CuNb pillars indicates that a-CuNb may have a smaller critical diameter below which homogeneous deformation occurs. For a-CuZr pillars, this critical diameter could be larger. Moreover, intrinsic material properties modified by compositional and structural difference can affect the deformation behaviors of MGs. Thurnheer et al. [Reference Thurnheer, Maaß, Laws, Pogatscher and Löffler68] showed that a higher percentage of Zr composition in ZrCuAl leads to a greater proportion of stronger Cu–Zr bond over the weaker Cu–Cu bond, and such a bond strength difference results in higher activation barrier for shear band propagation and better deformability. Unlike Cu–Zr that has a negative heat of mixing (−23 kJ/mol), Cu–Nb has a positive heat of mixing (3 kJ/mol) [Reference Takeuchi and Inoue69]. This indicates that the Cu–Nb bond may be weaker than the Cu–Cu bond. Therefore, upon stresses, atoms in a-CuNb may migrate more easily to achieve the stress-induced structural dilation and form shear bands. As a result, more homogenous deformation is achieved for a-CuZr, but inhomogeneous deformation manifested as shear bands occurs for a-CuNb.
Stress-drops during compression tests of a-CuNb and a-CuZr
Stable shear banding with controlled serrated flows is desirable compared with uncontrollable propagation of single dominant shear band. During each serration, MGs first deform elastically until the operations of shear bands accompanied with prominent stress-drops. If existing shear bands could be arrested, next serration events could be triggered. The formation of few but major shear bands may lead to significant stress-drops (softening) and thus catastrophic failure of MGs. Therefore, more frequent and smaller magnitude of stress-drops are often associated with better plasticity in MGs. As shown in Figs. 1 and 2, both a-CuNb and a-CuZr show serrated flows. And substantial plasticity was achieved in both systems.
At higher strain rate, serrated flows are largely suppressed for both a-CuNb and a-CuZr. From 5 × 10⁻³ to 2.5 × 10⁻² s−1, the average stress-drop (Δσave) for a-CuNb decreases from 83 ± 66 to 34 ± 29 MPa and the frequency of serrations also decreases. For a-CuZr, the frequency of stress-drop also clearly decreases at higher strain rate [Fig. 2(f)] but Δσave remains similar for both strain rates [Fig. 2(e)]. The underlying reason for such observation should come from the cut-off stress (10 MPa as explained in experimental section) selected for the statistical measurements. As some of the stress-drops for a-CuZr at 2.5 × 10⁻² s−1 are so small (<10 MPa) that many of the stress-drops could be immersed in the noise and therefore were not counted. The trend that higher strain rate suppresses serrated flows agrees well with previous literature [Reference Qiao, Zhang and Liaw19, Reference Sun, Pauly, Hu, Wang, Kühn and Eckert25, Reference Sun, Pauly, Tan, Stoica, Wang, Kühn and Eckert70, Reference Ma, Kou, Li, Chang and Zhou71]. One interesting phenomenon is that Δσave is much larger for a-CuNb than for a-CuZr. Since both systems have nearly the same testing condition and dimension, this discrepancy should arise from their intrinsically different material properties.
Serrated flows in MGs reveal the dynamic behaviors of shear bands, which can be well-explained by the stick-slip model [Reference Cheng, Han, Li and Ma23, Reference Sun, Pauly, Hu, Wang, Kühn and Eckert25, Reference Sun, Pauly, Tan, Stoica, Wang, Kühn and Eckert70, Reference Klaumünzer, Lazarev, Maaß, Dalla Torre, Vinogradov and Löffler72]. Interactions between the testing device and specimen lead to shear serration and their stiffness can greatly affect serrated flows. The device–specimen system stiffness k can be calculated from k = E/h(1 + S), where S is the ratio of sample stiffness k s to machine stiffness k m (S = πd 2E/4hk m) [Reference Cheng, Han, Li and Ma23, Reference Han, Wu, Li, Wei and Gao27]. The calculated k for a-CuNb is 51 × 106 GPa/m, which is larger than that for a-CuZr, 43 × 106 GPa/m (similar trend stands if one uses k = E(1 + 5d/h) by considering the substrate effect [Reference Ke, Sun, Liu and Yang20, Reference Ye, Lu, Yang and Liaw21, Reference Yang and Liu73]). According to previous studies [Reference Ke, Sun, Liu and Yang20, Reference Sun, Pauly, Hu, Wang, Kühn and Eckert25], the amplitude of stress-drop is closely related to k/k cr: the larger the k/k cr, the smaller the Δσave. Critical stiffness, k cr, is a function of intrinsic properties (flow resistance and energy barrier for STZ activation) and extrinsic properties (loading rate and temperature). Studies have shown that this trend holds for Mg-, Fe-, and Zr-based MGs, but the reverse trend occurs for Cu-based MGs, which matches our result: a-CuZr has smaller k/k cr and smaller Δσave (assuming the same k cr for both systems) [Reference Ke, Sun, Liu and Yang20]. This reverse trend was previously explained by the possible nanocrystallization inside shear bands. However, although testing under same extrinsic conditions ensures the same loading rate and temperature, intrinsic material properties such as flow resistance and energy barrier could differ between a-CuNb and a-CuZr, and be affected by structure/stress history. Therefore, k cr may differ between a-CuNb and a-CuZr. The reason why a-CuNb has a larger Δσave than a-CuZr could lie in the drastic different deformation mode resulting from their different bonding strength. For a-CuNb, shear banding is the primary deformation mechanism and main route to dissipate stored elastic energy. This energy can be estimated by combining stress-drop and strain duration in stress–strain curves. But a-CuZr deforms by homogeneous barreling and shear banding. The substantial barreling could be the dominant way to dissipate stored elastic energy for a-CuZr. Therefore, accommodated strain and dissipated energy via shear banding is minor, so shear serrations should be less severe, leading to smaller stress-drops for a-CuZr. Thus, strain and energy accommodated by shear banding may be directly related to serrated flows in MGs. Therefore, when MGs deform not solely by shear banding (due to mixed deformation modes or existence of secondary phases), extra caution should be applied to interpret serrated flows.
The effect of pre-deformation (tapping) on a-CuNb versus a-CuZr
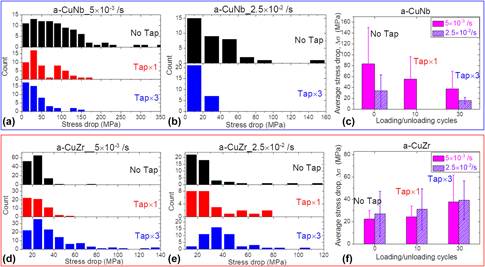
Cyclic dynamic loading tests of micropillars have revealed inelastic deformation of free volume zones in the nominal elastic regime for Zr-based MGs [Reference Ye, Lu, Liu, Wang and Yang56]. Cyclic loading of Fe- and Pd-based MGs under indentation in the elastic regime could lead to hardening [Reference Packard, Homer, Al-Aqeeli and Schuh54, Reference Packard, Witmer and Schuh55]. Liu and Maaß [Reference Liu and Maaß74] showed that elastic deformation can induce heterogeneities, which in turn could lead to rejuvenation or relaxation of MGs. But the effect of pre-deformation in the elastic regime on serrated flows has been rarely studied to date. In our study, before compression, tapping (consisting of 10 cyclic loading/unloading cycles) were performed on micropillars just below/around the elastic limit (∼2.5% strain). As shown in Fig. 3, a small amount of plastic strain was introduced after unloading of each tapping experiment, and no shear bands can be observed after tapping. Tapping drastically changes the serrated flows of a-CuNb and a-CuZr in different ways: tapping suppresses serrations in a-CuNb but enhances serrations in a-CuZr. The trend holds for both strain rates. Moreover, the deformation mode of a-CuZr changed from primarily barreling to shear banding, as evidenced by the apparent shear bands and shear offsets in Fig. 6.
Activities of free volume zones or STZs triggered by cyclic pre-deformation in elastic regime may not be detectable from load–displacement curves in conventional quasi-static tests [Reference Packard, Homer, Al-Aqeeli and Schuh54, Reference Packard, Witmer and Schuh55, Reference Ye, Lu, Liu, Wang and Yang56]. But such localized atomistic activities may affect distribution of free volume zones or coalescence of STZs and therefore tailor serrated flows in shear banding processes. In addition, serrated flows in micropillars may be more sensitive to the localized structural change/inhomogeneity than conventional bulk specimens. Our micropillar compression tests show that effect of pre-deformation (tapping) is readily manifested by the changing amplitude of stress-drop during shear serrations. For a-CuNb, consecutive tapping leads to continuous decrease in stress-drops, as shown in Fig. 9. Two possible mechanisms can lead to the suppression of serrated flows. On the one hand, prior studies show that cyclic deformation like tapping can cause local atomistic movement in free volume zones or STZs [Reference Packard, Homer, Al-Aqeeli and Schuh54, Reference Packard, Witmer and Schuh55, Reference Ye, Lu, Liu, Wang and Yang56, Reference Tong, Iwashita, Dmowski, Bei, Yokoyama and Egami57, Reference Sha, Qu, Liu, Wang and Gao75]. Tapping in this study occurs mostly at the elastic regime. At this low strain level, shear may not drive the generation of free volume [Reference Jiang and Dai76]. Instead, repetitive compression by tapping could decrease excess free volume generated from rapid cooling process during MG formation. Since shear bands are cooperative motions of STZs with excess free volume, lower density of free volume zones or STZs lowers the chances of forming major shear bands, which leads to smaller stress-drops. On the other hand, tapping can effectively change the residual stress state, which greatly affects the plasticity of MGs. Zhang et al. have shown that specimens with compressive residual stress introduced by peening show smaller serrations and more uniformed deformation [Reference Zhang, Wang and Greer77]. Suppressed serrations for a-CuNb indicate that tapping encourages more frequent but smaller shear banding events instead of large shear bands, which is supported by intertwined shear bands for pre-tapped pillars and isolated major shear bands for untapped pillars, as shown in Figs. 4 and 5. Strenuous shear band propagation path with intercepted minor shear bands for pre-tapped a-CuNb pillars relieves the shear offset and decreases the amplitude of serrated flows.
Statistics of stress-drops of a-CuNb and a-CuZr pillars. Distribution of stress-drops of a-CuNb pillars tested with and without tapping at (a) 5 × 10⁻³ s−1 and (b) 2.5 × 10⁻² s−1. (c) The magnitude of average stress-drop for a-CuNb decreases with increasing number of tapping for both strain rates. The distribution of stress-drops for a-CuZr pillars tested with and without tapping at (d) 5 × 10⁻³ s−1 and (e) 2.5 × 10⁻² s−1. (f) The average stress-drop for a-CuZr increases with increasing number of tapping for both strain rates.

Tapping on a-CuZr appears to increase the magnitude of serrations (Fig. 9). The enhanced serrations for a-CuZr after tapping should result from the deformation mode change from mostly barreling to shear banding. After tapping, shear banding becomes dominant over barreling and dominates the release of stored elastic energy. As reported in previous studies [Reference Ye, Lu, Yang and Liaw21, Reference Yang, Ye, Lu and Liu78], larger shear offsets correspond to larger average stress-drops, which is the case for a-CuZr after tapping. With more tapping, more strain and energy is accommodated or dissipated by shear banding, which requires more shear bands to operate, leading to larger stress-drops. The reason for the deformation mode change of a-CuZr after tapping is intriguing. One probable cause could be that tapping increases the free volume in a-CuZr pillars. This is opposite to a-CuNb, and the underlying reason could be related to bonding strength of Cu–Zr and Cu–Nb. As shown in Fig. 3, tapping seems to induce hardening for a-CuNb but softening for a-CuZr. This indicates that tapping could consume the free volume in a-CuNb, which increases flow stress, but tapping could generate extra free volume in a-CuZr, which decreases flow stress. Due to the positive heat of mixing between Cu and Nb, subnanometer Cu and Nb clusters may be able to “slide” during tapping and thus fill in (reduce) excess free volume. In contrast, due to the negative heat of mixing between Cu and Zr, the stronger Cu–Zr bonds compared with Cu–Cu and Zr–Zr may facilitate Cu–Zr types of short-range order before tapping. But elastic tapping may disturb the Cu–Zr bonds and lead to excess free volume. The extra free volume facilitates stress-induced structural dilatation and thus shear band initiation. As a result, more obvious serrations are observed. In principle, tapping could modify the competition between shear-induced disordering and internal structure relaxation in MGs [Reference Maaß and Löffler26]. Due to the different structure states and associated time scales for shear band initiation, propagation, and arrest, tapping effect on plasticity of MGs can vary prominently. The tapping effect on shear banding is intriguing and deserves future investigations through advanced techniques such as in situ acoustic emission [Reference Maaß and Löffler26] and synchrotron X-ray microdiffraction [Reference Radchenko, Tippabhotla, Tamura and Budiman79].
The effect of crystalline/amorphous layer interfaces
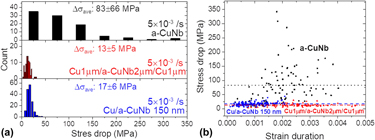
Introduction of crystalline phases into MGs generally promotes plasticity and toughness for both BMG composites and C/A multilayers. Radchenko et al. showed that interface shear strength can affect shear banding [Reference Radchenko, Anwarali, Tippabhotla and Budiman80]. However, it remains unclear how C/A interfaces affect serrated flows in C/A multilayers. To understand this effect, we compared serrated flows in three specimens: a-CuNb, Cu1 µm/a-CuNb2 µm/Cu1 µm trilayer, and Cu/a-CuNb 150 nm multilayers. The amorphous layer in the trilayer has the same thickness as the single layer a-CuNb, 2 µm, and the trilayer and multilayers have the same volume fraction of amorphous phase, 50%. As the diameter of trilayer and multilayers (2 µm and 1.2 µm) is larger than that of a-CuNb (1 µm), if the effect of pillar size dominates, shear banding should become less stable for the C/A multilayers [Reference Ke, Sun, Liu and Yang20, Reference Ye, Lu, Yang and Liaw21, Reference Cheng, Han, Li and Ma23]. However, as shown in Fig. 8, shear banding in 2 µm a-CuNb is contained by 1 µm Cu without sudden failure for trilayer (see details in a previous work [Reference Fan, Li, Li, Xue, Wang and Zhang58]) and substantial plasticity occurs in Cu/a-CuNb 150 nm multilayers without forming major shear bands. Moreover, the average stress-drop (Δσave) is 13 ± 5 and 17 ± 6 MPa for the trilayer and Cu/a-CuNb 150 nm multilayers, respectively, much smaller than that for untapped a-CuNb, 83 ± 66 MPa [Fig. 10(a)]. Apparently, the introduction of crystalline phases and interfaces alleviates major shear band operations and leads to smaller serrations. Upon compression, plasticity is first accommodated by dislocation activities in crystalline phase. Through C/A interfaces, dislocation-mediated plasticity is transferred into MGs and delocalizes deformation in MGs. As shear bands develop in MGs, crystalline phase counteracts the shear offset of shear bands through C/A interface by deforming itself. Thus, the accumulated elastic energy in MGs can be released by deformation in crystalline phase, which in turn leads to suppressed serrations in C/A multilayers. The similar Δσave for the trilayer and Cu/a-CuNb 150 nm multilayers could result from their same volume fraction of amorphous phase, which contributes to dissipation of stored elastic energy in MGs.
Statistics of stress-drops of a-CuNb, Cu1 µm/a-CuNb2 µm/Cu1 µm, and Cu/a-CuNb 150 nm pillars tested at 5 × 10⁻³ s−1. (a) The distribution and amplitude of stress-drop are broad and large for a-CuNb but become much narrower and smaller for Cu1 µm/a-CuNb2 µm/Cu1 µm and Cu/a-CuNb 150 nm. (b) Comparisons of stress-drop versus strain duration for a-CuNb (black squares), Cu1 µm/a-CuNb2 µm/Cu1 µm (red triangles), and Cu/a-CuNb 150 nm (blue circles). Average stress-drop is similar for Cu1 µm/a-CuNb2 µm/Cu1 µm and Cu/a-CuNb 150 nm, but the average strain duration for Cu/a-CuNb 150 nm is much smaller.

One intriguing difference between the trilayer and Cu/a-CuNb 150 nm multilayers is the strain duration for each serration [defined in the inset in Fig. 1(a)]. As shown in Fig. 10(b), Cu/a-CuNb 150 nm multilayers (blue circles) show much smaller strain duration during each stress-drop compared with the Cu1 µm/a-CuNb2 µm/Cu1 µm trilayer (red triangles). This indicates that in Cu/a-CuNb 150 nm multilayers, shear band operations in MGs are arrested in shorter strain (short traveling distance for shear bands before arrested). With the decrease in layer thickness of MGs, the scale for coalescence of STZs or free volume zones could shrink and the scale of shear banding operation could diminish correspondingly. A shorter shear band in Cu/a-CuNb 150 nm multilayers could be arrested more easily compared with a longer one in single-layer a-CuNb or trilayer (width of shear bands is unchanged 10–20 nm). Meanwhile, C/A interfaces can delocalize strain in MGs (promoting more delocalized STZ coalescences) and act as barriers for shear band operations. With smaller layer thickness, higher density of C/A interfaces results in more delocalized shear band operations and shorter traveling distance of shear bands before arrested or diverted by C/A interfaces. As a result, serrated flows with both suppressed amplitude and strain duration is achieved for Cu/a-CuNb 150 nm multilayers. Therefore, both layer interfaces and layer thickness (size effect) play an important role in suppressing serrated flows.
Conclusions
We systematically investigated the effects of pre-deformation and layer interfaces on serrated flows of two types of MGs under micropillar compression. The untapped amorphous-CuNb pillars deform by shear banding, but the untapped amorphous-CuZr pillars deform mainly by barreling with obscure shear banding. Cyclic elastic tapping prominently suppresses serrated flows in amorphous-CuNb presumably due to the reduction of free volume or stress state. However, cyclic elastic tapping on amorphous-CuZr pillars promotes serrated flows and changes the deformation mode from primarily barreling to shear banding, presumably due to the increase of free volume. The crystalline/amorphous layer interfaces promote shear delocalization and substantially suppress serrated flows. Both cyclic elastic tapping and layer interfaces can be utilized as effective strategies to tailor serrated flows and potentially enhance plastic deformation of metallic glasses.
Experimental
In order to explore the effect of strain rate and pre-deformation, two binary equal atomic percent MGs, a-CuNb and a-CuZr films, ∼2 μm in thickness, were deposited by direct current magnetron sputtering on silicon substrate. Micropillars were fabricated from films on silicon substrate by focused ion beam technique on an FEI Quanta 3D FEG dual-beam scanning electron microscope (SEM) (Thermo Fisher Scientific, Hillsboro, Oregon). A sequential ion milling process was applied in order to minimize the ion damage and tapering effect. Micropillars have an average taper angle of ∼2°. In situ micropillar compression tests were performed using a Hysitron PI 88 XR SEM PicoIndenter® (Hysitron, Minneapolis, Minnesota) at room temperature with a 5-µm flat-end diamond indenter tip inside the same microscope. To avoid the size effect, the height of both MGs is ∼2 µm and the aspect ratio (height/diameter) is kept at ∼2:1. Multiple pillars were compressed to ensure statistical significance. Besides, to study the effect of crystalline/amorphous layer interfaces on shear serrations, 1 µm Cu/2 µm a-CuNb/1 µm Cu and 150 nm Cu/150 nm a-CuNb multilayers (referred to as Cu1 µm/a-CuNb2 µm/Cu1 µm and Cu/a-CuNb 150 nm) were also fabricated and tested in the same manner as described above. The thickness of Cu1 µm/a-CuNb2 µm/Cu1 µm and Cu/a-CuNb 150 nm specimens is 4 µm and 2.4 µm, respectively, and the aspect ratio is also 2:1. The amorphous nature of the films was confirmed by X-ray diffraction and transmission electron microscope in previous studies [Reference Fan, Xue, Wang, Yu, Wang and Zhang51, Reference Fan, Li, Li, Xue, Wang and Zhang58]. In situ compression tests in SEM permit accurate alignment between the indenter and pillar, reliable determination of stress and strain, and direct correlation between morphology evolutions and stress–strain curves. The measured load fluctuation is smaller than 8 µN, which corresponds to a stress of 10 MPa for a pillar with a diameter of 1 µm. Therefore, stress-drops smaller than 10 MPa were discarded in the statistics. The machine stiffness for all the experiments was calibrated to be 0.16 × 10⁶ N/m.
Supplementary material
To view supplementary material for this article, please visit https://doi.org/10.1557/jmr.2018.446.
Acknowledgment
We acknowledge the financial support by NSF-DMR 1642759. H. Wang acknowledges the support from the U.S. Office of Naval Research (N00014-16-1-2778). Accesses to the Life Sciences Microscopy Center and Materials Science Microscopy Center at Purdue University are also acknowledged.