INTRODUCTION
Although the emerging avian influenza (AI) pandemic has largely been contained, human and poultry infections have continued to occur in several continents, with continued reports of outbreaks of highly pathogenic avian influenza (HPAI) throughout the last 10 years. While numerous risk factors have been identified in recent studies [Reference Pfeiffer1–Reference Gilbert6], the spatial and temporal ecology of the AI viruses is still poorly understood. It is imperative that long-term control measures are implemented, given the potential for genetic exchange among HPAI viruses and H1N1 or other highly contagious influenza viruses. The resulting recombinant virus poses the threat of a devastating pandemic [Reference Li7–Reference Smith9].
Wetland areas are of great concern with regard to HPAI in Asia, because these habitats are often concurrently used by both wild and domestic ducks [Reference Muzaffar10–Reference Feare12]. Hence, wild birds may serve as a vector of AI viruses [Reference Muzaffar, Ydenberg and Jones13, Reference Alexander14] and periodically transfer the viruses to domestic poultry [Reference Gilbert6], which might in turn infect other livestock and humans. Recent studies found that free-ranging domestic ducks in certain agro-ecological environments have played a critical role in the spread of HPAI viruses [Reference Gilbert5, Reference Li7, Reference Chen15–Reference Berhane17], which has prompted several research efforts to focus on wetland systems. A series of valuable studies on the disease ecology of HPAI, mostly in South East Asia, evaluated HPAI spatial distribution and the risk factors associated with HPAI [Reference Gilbert5, Reference Gilbert6, Reference Hulse-Post18, Reference Songserm19]. More recently, attention has focused on human–nature interactions in relation to HPAI transmission and outbreak patterns [Reference Martin20]. Such interactions are a key feature of China's Poyang Lake region, where populations of humans, livestock, and wild birds co-exist at high densities.
Poyang Lake is located in Jiangxi province and is the largest freshwater lake in China. Most of the water system of Jiangxi province is linked to Poyang Lake. The influence of the lake extends over much of the surrounding landscape. Poyang Lake provides habitat for over 0.4 million migratory birds each year. In the areas surrounding Poyang Lake, poultry farming is the main livelihood of local residents. Husbandry of free-ranging ducks occurs extensively in the Poyang Lake region where rice cropping is prevalent, because domestic ducks often feed on spilled grain in recently harvested paddies. Wild waterfowl and domestic poultry often forage side by side in the region, and rice paddy irrigation often interacts with the water systems used more generally by wild waterfowl in the region, such that there is ample opportunity for the AI viruses to circulate between wild waterfowl and domestic duck [Reference Songserm19, Reference Suarez21, Reference Smith22]. Poyang Lake differs from most other similar eco-regions in relation to HPAI, such as Qinghai Lake and communities in Thailand, owing to the large numbers of domestic ducks and migratory birds in and around Poyang Lake. Consequently, the potential for transmission of HPAI between domestic and migratory birds is relatively high in the Poyang Lake region, and the region has received considerable attention, because of this situation [Reference Takekawa23].
In this study, we evaluated the spatio-temporal patterns of HPAI transmission. In order to generate and evaluate a means for locating high-risk regions and possible transmission routes for AI viruses in such regions, we explored Poyang Lake-related interactions between human (crop planting, poultry production) and ecological (migratory waterfowl, ambient temperature) systems. We characterized HPAI outbreak risk as the convergence of a number of key ecological factors, including low temperatures, intensive rice cropping, frequent bird interactions, and complex poultry supply-and-demand dynamics. Our modelling effort attempts to support decision making with regard to the containment HPAI in the absence of actual outbreak data by synthesizing and integrating known risk variables into a hierarchical map. As the basis for this modelling exercise, we posit that HPAI risk increases in accordance with: (1) higher intensities of poultry production [Reference Xiao24] and poultry transportation, and (2) closer contacts between migratory birds and poultry, and between humans and poultry [Reference Gilbert6, Reference Muzaffar, Ydenberg and Jones13, Reference Alexander14].
While poultry production may influence the static spatio-temporal pattern of risk factors associated with HPAI, poultry transportation may influence the dynamics of such factors. We assessed the hypothesis, that in the Poyang Lake region, HPAI risks may be associated with both poultry production and poultry transportation flows [Reference Xiao24]. We further assessed HPAI risk in relation to the interactions between humans and natural systems and mapped the spatial distribution of HPAI risks as well as their dynamics within a complete year. Anticipating that the spatio-temporal identification of risk factors could help to prevent or control HPAI outbreaks [Reference Rivas25], we assessed nine such factors. As we gradually improve our understanding of the ecology of HPAI H5N1, this model can provide immediate aid in determining how to distribute limited resources.
MATERIALS AND METHODS
In this study, we analysed the spatio-temporal pattern of mixed HPAI risk factors by compiling publicly available data that relate to known and assumed risk factors associated with HPAI outbreaks and exposure to humans. Nine risk factors were analysed: (i) human population, (ii) poultry trade, (iii) land use, (iv) cropping system, (v) national highways, (vi) air temperature, and the density of (vii) domestic ducks, (viii) chickens, or (ix) wild avian species. The purpose of the analysis was to determine where outbreaks may occur and how they may spread via movements of live birds and poultry products. Data were rendered as geospatial layers to reflect spatial variation throughout Jiangxi province.
Data
Using ArcGIS (ArcGIS 9·1, ESRI Inc., USA), we compiled four types of spatial data for each of the 99 counties of Jiangxi province. These were socioeconomic ecological data, poultry and wild bird data, temperature data and HPAI outbreak data. Here, all data were entered into ArcGIS as county-level vector layers and then converted into raster layers with 2 × 2 km square cells. The four types of spatial data were used in subsequent analyses.
Socioeconomic ecological data
Based on the 2005 Jiangxi province Statistical Yearbook, we collected county-level data on human population and land areas occupied by city, town and cultivated land (used land area). Data on the national highway system and land-use types were retrieved from the Institute of Geographic Sciences and Natural Resources Research at the Chinese Academy of Sciences. Data on crops were derived from a previous study [Reference Yan26]. These primary variables were then used to generate four secondary variables: (i) human population density, (ii) land use, (iii) highway density, and (iv) cropping system.
The human population density layer was calculated as human population divided by used land area. The highway density layer shows the linear mile per grid square. Land use was classified into six categories: (i) city/town, (ii) cultivated land, (iii) forest, (iv) grassland, (v) barren land, and (vi) water body. Moreover, cultivated land was further classified into three categories: (i) non-paddy land, (ii) double cropping paddy land, and (iii) triple cropping paddy land [Reference Yan26]. This secondary classification was conducted to allow us to account for rice paddies that would probably attract both free-ranging ducks and wild birds [Reference Gilbert4].
Poultry and wild-bird data
Because domestic ducks are generally asymptomatic when infected with H5N1 [Reference Chen15, Reference Hulse-Post18], whereas chickens exhibit high mortality, it is likely that ducks and chickens have different roles in the spread of HPAI viruses. Therefore, we calculated duck and chicken densities independently for the 99 counties of Jiangxi province, resulting in separate data layers for ducks and chickens. Densities were calculated as the number of birds divided by land area used. Density calculations were based on figures from the 2005 Jiangxi province Statistical Yearbook.
To incorporate information about the dynamics of local poultry commerce, we generated two indexes: poultry productivity and poultry trade. Poultry productivity was defined as the annual mass of poultry products produced in a country, and poultry trade was defined as the annual number of poultry shipped into and out of a county. Both poultry productivity and poultry trade values were rendered as separate data layers.
To estimate both wild waterfowl density and dynamics (i.e. when birds enter or leave a particular site), we used water body as a proxy for wild bird-related HPAI risks, assuming that larger water bodies would provide habitat for more wild birds than smaller water bodies. The resulting data layer represented HPAI risk associated with wild waterfowl as the total surface area of a water body within a county.
Temperature data
The viability of AI viruses in the environment depends greatly on temperature [Reference Liu27]. AI viruses can survive for prolonged periods at temperatures below 17°C [28, 29], but persist over shorter intervals at higher temperatures. We acquired monthly temperatures, between 1961 and 1990 from the Thematic database for human–earth system [Reference Tran30]. Twelve temperature layers were generated based on these 30 years of data, which showed the distribution of average minimum monthly temperatures throughout Jiangxi province.
HPAI outbreak data
We generated an HPAI outbreak layer by marking the locations of five outbreaks reported as occurring between February 2004 and December 2005 in Jiangxi province, which involved both humans and birds. Such data were obtained from the Emergency Prevention System (EMPRES) [29] and the China pandemic flu website [31].
Analyses
Two primary risk assessment analyses were conducted. The first incorporated factors relating to poultry production, and the second quantified risk in association with poultry transportation. We then generated a comprehensive HPAI risk assessment map that was based on a combination of the two primary risk assessment maps. In combining risk assessments based on poultry production and transport, this comprehensive assessment map revealed how human–nature interactions relate to HPAI risk. Moreover, we also analysed the relationship between HPAI risk and the spatial patterns of poultry population, poultry productivity and poultry trade.
To eliminate the interferences of dimensional differences on the assessment, the densities of human population, poultry and wild birds, poultry productivity and poultry trade were normalized by their own value divided by the maximum value, respectively.
HPAI risk from poultry production
In the Poyang Lake region, poultry production entails contact between wild birds, poultry and humans; and these contacts are the principal pathways of HPAI transmission as well as the cause of most HPAI outbreaks. We assessed HPAI outbreak risk from poultry production by quantifying the potential for contact between wild birds, poultry and humans, which we assumed to be related to their population densities.
Duck density is generally regarded as an indicator for the capacity to provide an AI virus reservoir [Reference Hulse-Post18], whereas chicken density is probably associated with the potential for rapid outbreaks, given the high susceptibility of chickens. Domestic ducks infected with HPAI can generally survive for about 7 days, whereas chickens usually die in about 1 day [Reference Chen15, Reference Hulse-Post18]. Therefore, before incorporating these layers into the risk assessment, we applied a weight factor of 7 to the duck density layer. A poultry density layer was generated, in which the value equals the sum of weighted duck density and chicken density. We equated higher poultry density as indicated by these combined layers with an increased risk of HPAI outbreaks [Reference Claas32].
To incorporate the intensity of poultry production into the model, we generated a compound layer in which the intensity value of the ith cell, Pi i, was calculated as:
 $$Pi_i = Pp_i Pd_i, $$
where Pp i is the normalized poultry productivity within the ith cell and Pd i is the normalized poultry density within the ith cell. An increased HPAI risk is associated with a higher intensity of poultry production.
Contact rates between wild waterfowl and poultry and between poultry and humans are difficult to quantify and there have been few attempts to do so. In the Poyang Lake region, poultry and wild waterfowl probably come into contact in water bodies and on cultivated land as opposed to urban areas, grasslands, forests and barren land. Due to poultry trade, close contact between poultry and humans can occur both on farms and in urban areas. Therefore, the land-use layer was used to indicate the spatial patterns of these potential contact zones. Moreover, the densities of humans, poultry, and wild birds were used to estimate the intensity of these contacts, assuming that higher densities probably result in higher intensities of contacts. Therefore, the wild bird–poultry contact intensity of the ith cell, Cbpl i, was calculated as the square root of the product of wild-bird density and poultry density within the ith cell, while the human–poultry contact intensity of the ith cell, Chpl i, was calculated as the square root of the product of human population density and poultry density within the ith cell.
Our field observations revealed that, in winter and around Poyang Lake, wild waterfowl and domestic poultry frequently forage together in rice paddies, but rarely forage together in non-paddy land. The cropping system in rice paddies roughly reflects the degree of the contact between wild birds and domestic ducks [Reference Gilbert5, Reference Gilbert6, Reference Xiao24]. Because the highest densities of migratory ducks and free-feeding domestic ducks generally occur during the second rice harvest of the year [Reference Gilbert5], we regarded the cropping system layer as an indicator of wild waterfowl–domestic poultry contacts taking place on cultivated land. Because the density of migratory ducks and domestic ducks – in cultivated land – is empirically known to be greater in paddy than in non-paddy land, in this study wild bird–poultry contacts for double and triple cropping paddy land were estimated to be 10 times greater than non-paddy land-related contacts, i.e. they were numerically estimated to be equal to 1 and 0·01, respectively.
To assess the HPAI risk from the contact between wild birds and poultry, we generated the wild bird–poultry layer, in which the risk value of the ith cell, Rbpi, was calculated as:
 $$Rbp_i = Cbpl_i Cbpc_i Bd_i Pi_i, $$
where Cbpl i is the contact intensity of wild bird–poultry within the ith cell and Cbpc i is the contact coefficient of wild bird–poultry within the ith cell, respectively; and Bd i and Pi i are the normalized wild-bird density and the normalized intensity of poultry production within the ith cell, respectively. Moreover, we generated another layer to assess HPAI risk (Rhp) from the contact between poultry and humans (human–poultry layer). The risk value of the ith cell, Rhp i, was calculated as:
 $$Rhp_i = Chpl_i Pi_i Hp_i, $$
where Chpl i is the human–poultry contact intensity within the ith cell; and Hp i is the normalized human population density within the ith cell.
Because the presence of migratory birds in Jiangxi province is seasonal, high densities of wild birds occur from October to April. Thus, cold temperatures, which favour AI persistence and transmission [Reference Brown33, Reference Reperant34], generally coincide with the presence of migratory waterfowl. Accordingly, we used monthly average minimum temperatures to identify high-risk areas under the assumption that lower temperatures are associated with increased risk. Moreover, we also used the temperature layer to assess the effect of season on the contact between humans and poultry. For example, January–February is usually the annual peak of contact intensity between humans and poultry because of the high level of poultry consumption during the Spring Festival, the most important festival in China.
By overlapping the wild bird–poultry layer, human–poultry layer and 12 temperature layers, we generated a set of risk assessment layers that related the spatio-temporal pattern of HPAI risk from poultry production in the Poyang Lake region. The risk value of the ith cell, RP i, was calculated as:
 $$RP_i = Rbpi + Rhp_i, $$
In this set of risk assessment layers, a higher HPAI risk was associated with a higher risk value and a lower atmospheric temperature.
HPAI risk from poultry transportation
Because inter-county transportation is common in the Poyang Lake region, this practice is likely to promote long-distance transmission of AI viruses [Reference Paul35]. Hence, it is plausible to expect increased human–poultry contact rates and HPAI risk in relation to poultry productivity, the demand for poultry, and the geographical location of highways. Therefore, our assessment of HPAI risk from poultry transportation was based on the poultry trade layer, the poultry density layer, the poultry productivity layer, the human population density layer, the highway layer and the land-use layer. As we lacked a measure of market demand for poultry, we used human population density as an estimator for demand. This demand drives poultry trade, and higher density human population is likely to result in an increase of poultry imports.
Poultry transportation in China occurs mainly along the national highway system [Reference Fang2]. Hence, we reasoned that the risk of an HPAI outbreak would be inversely related to the distance from the highway. To generate a highway–distance layer, we calculated the Euclidean distance from the highway to each cell, wherein cells that contain a highway have a value of 1, and other cells are valued as the reciprocal of the Euclidean distance from the nearest highway. The highway–distance layer indicates the gradient of potential AI viruses spreading along the transportation route. Moreover, contact between humans and poultry probably occurs during poultry transportation. In this analysis, the human–poultry contact coefficient was used to indicate the degree of this contact as well as its spatial pattern.
We generated an assessment layer for HPAI risk from poultry transportation. The risk value of the ith cell, RT i, was calculated as:
 $$RT_i {\rm =} Chpl_i Hd_i Pt_i Pi_i Hp_i, $$
where Chpl i is the contact coefficient of human–poultry within the ith cell, Hd i is the distance from the ith cell to highway, Pt i is the normalized poultry trade within the ith cell, Pi i is the normalized intensity of poultry production within the ith cell, and Hp i is the normalized human population density within the ith cell.
HPAI risk from human–nature interactions
In the Poyang Lake region, poultry production and poultry transportation are the principal causes of human–nature interactions that are related to HPAI transmission and outbreaks. We integrated the assessments of HPAI risks from poultry production and from poultry transportation by summing the risk values from the poultry production and transportation layers such that
 $$RR_i = RP_i + RT_i, $$
where RR i is the comprehensive risk value of the ith grid cell. Higher HPAI risk was associated with a higher comprehensive risk value and a lower atmospheric temperature. The set of comprehensive HPAI risk assessment maps revealed monthly HPAI risks under the interactions between the human and nature systems in Jiangxi province (Fig. 1). Those comprehensive assessments were classified in five levels, of which level 5 indicated the highest HPAI risk.
[colour online]. Monthly highly pathogenic avian influenza risk. The monthly maps describe the risk in Jiangxi province for a complete year. Areas in red indicate the highest risk.

To determine whether the spatial distribution of HPAI risk predicted by our study corresponded with past outbreak locations, we plotted the locations of the five HPAI H5N1 outbreaks in poultry and humans that occurred from January 2004 to 30 May 2010 onto the comprehensive assessment maps (Fig. 2).
[colour online]. Highly pathogenic avian influenza (HPAI) outbreak points. The five red circles symbolize the HPAI outbreak points in Jiangxi province.
Supply and demand of poultry and transmission of HPAI viruses
To further understand how poultry transportation may serve as a vector for AI in Jiangxi province, we examined spatial patterns of both the poultry population and those associated with poultry production (poultry productivity, poultry trade). The analysis of such patterns may describe both poultry producing and consuming counties. Using the trend analysis tool of ArcGIS, we generated three three-dimensional renderings that illustrated the dynamics of poultry population density, poultry productivity and poultry trade in Jiangxi province (Fig. 3).
[colour online]. Distribution trends of poultry population, poultry productivity and poultry trade in Jiangxi province. Three three-dimensional graphs show the distribution trends of (a) poultry population, (b) poultry productivity and (c) poultry trade in Jiangxi, respectively. The horizontal (x–y) planes correspond to the spatial distributions of all counties. The perpendicular (x–y, black) bars represent (a) the poultry population, (b) productivity and (c) trade, respectively, and their maximums are projected on the x–z and y–z planes as scatter plots. The polynomial curves fitted to the scatter plots (on the x–z and y–z planes) illustrate west–east and south–north trends, respectively.
RESULTS
HPAI risk hotspots and transmission corridors
On the comprehensive assessment map for HPAI risk in Jiangxi province, the areas of levels 1–5 accounted for 6·7%, 23·6%, 36·6%, 26·7%, and 6·4%, of the total area of the province, respectively. The highest risk cells (level 5) were relatively concentrated in the two areas that we henceforth refer to as hotspots I and II (Figs 1, 4). It is of note that four of the five past outbreaks that occurred in Jiangxi province were located in areas designated as high risk by our study (Fig. 2). The fifth outbreak occurred in a low-risk area, which was located on the edge of hotspot II.
[colour online]. Highly pathogenic avian influenza (HPAI) hotspots and transmission corridors in Jiangxi province. Two HPAI hotspots and three transmission corridors were observed in Jiangxi province. Areas within the yellow ellipses are the hotspots and the green lines indicate the corridors.
Hotspot I was located in the north of Jiangxi province, close to Poyang Lake where the landscape is relatively flat and dominated by miles of rice paddies, most of which are harvested twice annually. This hotspot was largest in January and February, with outbreak risks declining gradually in subsequent months until the temperature drops markedly in October. At its greatest extent, hotspot I covered 11 counties.
Hotspot II occurred in the south of Jiangxi province. It was associated with forest and relatively small crop fields. Although smaller (it only involved five counties), hotspot II followed a monthly trend similar to that of hotspot I. The two hotspots were 281 km apart, but they were connected by two highways (Fig. 4). In addition, a third highway crossed hotspot I.
Supply and demand of poultry and transmission of HPAI
Poultry populations were relatively uniform across the province, but poultry production (poultry productivity, poultry trade) was unevenly distributed (Fig. 3). Both poultry productivity and poultry trade had a slightly hump-shaped distribution with regard to the west–east distribution as well as a strong south–north trend indicating much greater poultry production activity around hotspots I and II. Hence, poultry production was concentrated in the two hotspots, which indicated an uneven poultry production system that would necessitate large-scale transportation of poultry products throughout most of Jiangxi province.
DISCUSSION
The risk map that resulted from our analyses revealed HPAI high-risk areas in the Poyang Lake region, which results from the convergence of several known risk factors, including dense populations of domestic birds, a large influx of wild birds, and an extensive double-cropping rice production system. These risk factors also converge temporally in conjunction with low temperatures in mid-winter, which gives rise to a large high-risk zone in January and February (Fig. 1).
HPAI infections in ducks generally occur after they occupy rice fields [Reference Songserm19]. Hence it is clear that ducks generally contract the disease away from the farm, probably through contact with wild waterfowl [Reference Paul35]. Moreover, Takekawa et al. [Reference Takekawa23] showed that HPAI H5N1 outbreaks in the flyway were related to poultry density but not to the core migration corridor or to wetland habitats, which suggests that interaction between wild and domestic birds is a key factor in promoting outbreaks.
Increased infection risk has also been documented in poultry populations in close proximity to a water body and/or in the lower plains of rice paddy fields (especially where double cropping occurs), where wild and domestic birds often forage together [Reference Fang2, Reference Gilbert6]. Migratory birds abound around Poyang Lake from October to April of the following year [Reference Yan26, Reference Paul35]. As they arrive at the lake, these birds are likely to be weak from their long-distance travel and probably face extreme weather fluctuations, which may increase their susceptibility to HPAI [Reference Cui36]. Our field study detected several sites, around Poyang Lake, where wild birds and chickens interact. The densities of ducks, chickens and wild birds, as well as the duck–wild bird and chicken–wild bird contact rates were between 20 and 80 times higher in Jiangxi than in Qinghai. Hence, the potential for transmission of HPAI between domestic and migratory birds is relatively high in the Poyang Lake region.
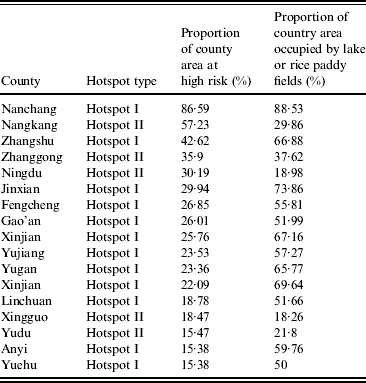
The two hotspots that emerged from our analysis differed in their size, seasonal dynamics, and overall severity. Hotspot I was associated with Poyang Lake, a region characterized by high human, livestock, and wild-bird density. In addition, hotspot I has extensive rice farming operations and numerous wetlands, which facilitate interactions between potential hosts. While hotspot II lacks a large water body and features smaller agricultural activity than hotspot I (Table 1), given its high poultry production, hotspot II emerged as a high priority area [Reference Guan37].
Hotspot features
In China, there is a strong association between the national highways and HPAI H5N1 transmission and outbreaks [Reference Fang2]. Long-distance transmission is a major factor associated with pandemics [Reference Rivas25]. In agreement with previous reports, our study did not reject the hypothesis that poultry transport promotes HPAI persistence and transmission [Reference Fang2, Reference Rivas25, Reference Guan37]. The geographical pattern of HPAI outbreaks may be driven by long-distance transmission associated with poultry commerce [Reference Gilbert6]. Long-distance transportation of poultry brings together different avian species, which increases the exposure in vulnerable populations [Reference Gilbert6, Reference Farnsworth and Ward38].
Some findings support the view that the three major roadways, which are inter-connected, form three HPAI transmission corridors that connect the two high-risk areas of Jiangxi province and promote assortment of AI viruses (e.g. [Reference Capua and Marangon39]). To prevent the dissemination of HPAI H5N1, poultry monitoring along such corridors is recommended.
While poultry populations, across the Jiangxi province, were more or less uniform, poultry productivity and poultry trade clustered in the south and north of the area investigated. Such spatial disparity between poultry population and poultry production may result in extensive live poultry transportation, which enhances the spread and recombination of AI viruses. Moreover, the transportation of live poultry or poultry products between northern and southern Jiangxi could also facilitate human outbreaks [Reference Cauthen40, Reference Cameron41]. Therefore, we argue that the supply and demand of poultry may play a key role in the transmission of AI viruses in Jiangxi province.
The current spatio-temporal pattern of HPAI risk factors is due to the interaction of humans and natural systems that relate to poultry production and transportation. Therefore, we reason that it is possible to exert some control over HPAI transmission and outbreaks by regulating the interaction between the relevant human and natural systems. Self-regulating mechanisms may already be in place, given that HPAI transmission and outbreaks will themselves change the spatio-temporal patterns of risk factors. For instance, outbreaks are likely to reduce poultry densities in affected areas as well as demand for poultry products. Disease mitigation efforts should seek to bring about these effects before outbreaks occur.
Instead of classical statistical methods, a geographically explicit, knowledge-based method was applied here. Such method was motivated by the lack of HPAI outbreak data in Jiangxi province. This approach should not be viewed as a substitute but as an additional tool to map risks, which may help efforts intended to contain disease outbreaks and transmission. The approach used offers a basis for decision making, facilitating the allocation of disease prevention resources when outbreak data are scarce. As our understanding of HPAI ecology improves, we can introduce new risk factors to improve our predictions of outbreaks in time and space.
ACKNOWLEDGMENTS
This study was supported by the National Natural Science Fund of China (no. 31070392) and US National Institutes of Health Fogarty International Center (grant R01-TW00786901). We thank H. M. Yan for providing the data of agricultural crop layer and thank the three reviewers for their comments.
DECLARATION OF INTEREST
None.