Nomenclature
- AI
artificial intelligence : A field of computer science focused on creating systems that can perform tasks requiring human intelligence.
- AZ
azimuth : angular measurement in the horizontal plan.
- CDM
comtech demodulator : A device used in communication systems to demodulate the received signal for further processing.
- CSV
-
comma-separated values : A file format used for storing tabular data.
- dBm
-
decibels relative to 1 milliwatt : Unit of power level used in RF communication.
- DDMM
-
deviation divide mean over neighbours : A method to compute variation based on local mean.
- DL
-
deep learning : A subset of machine learning using neural networks with multiple layers.
- EKF
-
extended Kalman FILTER : A nonlinear version of the Kalman filter used in estimation and tracking.
- EL
-
elevation : angular measurement in the vertical plane
- GS
-
ground station : A terrestrial terminal that communicates with satellites
- IOD
-
initial orbit determination : Process to estimate the orbit of a satellite from observational data.
- kNN
-
k-nearest neighbours : A smachine learning algorithm that classifies based on proximity to neighbors.
- LEO
-
low Earth orbit : An orbit around Earth with an altitude between ~160 to 2,000 km.
- LHCP
-
left-hand circular polarisation : A type of antenna polarization.
- LSTM
-
long short-term memory : A type of recurrent neural network (RNN) capable of learning long-term dependencies.
- MAE
-
mean absolute error : A metric to measure the average magnitude of errors in predictions.
- ML
-
machine learning : A field of AI focused on systems that learn from data.
- MSE
-
mean squared error : performance metric.
- R2
-
R-squared (coefficient of determination): A statistical measure of how close data are to a regression line.
- RF
-
radio frequency : The frequency range used in wireless communications.
- RHCP
-
right-hand circular polarisation : Type of antenna polarization.
- RMSE
-
root mean squared error : Square root of the average of squared differences between prediction and actual observation.
- STAN
-
simultaneous tracking and navigation : A technique or system used in satellite communications.
- TDNN
-
time delay neural network : A type of neural network for time-series data.
- TLE
-
two-line elements : A data format encoding a satellite’s orbital parameters.
- TM
-
telemetry: Data collected remotely and transmitted to receiving equipment.
1.0 Introduction
Telemetry plays a central role in space missions by providing vital information on the performance, status and operation of satellites in orbit. The reliable acquisition of telemetry data is especially critical for low Earth orbit (LEO) satellites like Alsat-2A and Alsat-2B, where visibility times are limited.
Over time, telemetry acquisition has been the focus of numerous studies in literature [Reference Chen, Mu, Ma, Liang, Wang, Liu, Na, Jia and Zhang1, Reference Uhlig, Sellmaier and Schmidhuber2]. Furthermore, several research works have explored the integration of machine learning (ML) techniques into ground stations (GS), enhancing operational efficiency through applications such as predictive maintenance and signal processing optimisation [Reference Weiss, Clarke and Elnourani3, 4]. For instance, ML algorithms are utilised in the Mobile CubeSat Command and Control (MC3) ground station network to monitor system health and predict anomalies [Reference Marczewski5].
In the upcoming upgrade of the ground infrastructure for the Alsat-2A and Alsat-2B satellites, the existing telemetry demodulators will be replaced with the new CDM-600 model from Comtech [6]. This upgrade requires the development of a hardware and software solution capable of controlling Doppler shift as well as a means for selecting the most appropriate circular polarisation, be it left or right, for reliable reception of telemetry.
In the context of downlinks, the power of the radio frequency (RF) signal, received at GS, can be altered by various factors such as satellite attitude and noise in the transmission channel. The movements and orientation of the satellite, particularly when capturing images, can affect the direction of transmission of the antennas on board, while the presence of noise in the transmission channel can harm the quality of the signal received. To guarantee the reliability of TM transmission, ALSAT-2 satellites use a technique called ‘polarisation diversity’ between RHCP (right-hand circular polarisation) and LHCP (left-hand circular polarisation) [7]. This technique allows telemetries (TMs) to be transmitted by two antennas with different polarisations, thus ensuring increased redundancy and robustness in signal reception. Indeed, the demodulator currently in place in the ground station is equipped with a device called ‘diversity combiner’, which makes it possible to combine the digital data from each channel after demodulation, ensuring effective management of the two polarisations. On the other hand, the demodulator to be installed, the CDM600, does not have this polarisation combination mechanism. Consequently, two complementary approaches, operating in cold redundancy, have been adopted:
-
• The design of an external circuit capable of selecting the appropriate acquisition polarisation.
-
• The development of a model based on (ML).
In this paper, a detailed look at the design, development and implementation of this integrated solution is presented. The challenges encountered and the solutions adopted are discussed, while the advantages and performance of the approach are highlighted. Finally, the future prospects and possible improvements for this essential technology in the field of space missions are considered.
The remainder of this paper is structured as follows: section 2.0 explores the key parameters impacting communication between satellites and ground stations. Section 3.0 introduces the heuristic-based polarisation switching method, detailing its operation and limitations. Section 4.0 presents the proposed solution, outlining its various modules. Section 5.0 discusses the obtained results, while section 6.0 provides a conclusion and summarises the main findings.
1.1 Related works
The integration of ML techniques into space mission systems is an emerging and growing research area, encompassing various applications that can be categorised into three main areas [Reference Hassanien, Darwish and Abdelghafar8–Reference Murphy, Ward and Mac Namee10]:
-
1. Telemetry analysis and monitoring: This category focuses on the analysis of satellite health data to ensure optimal functioning. It includes monitoring critical satellite parameters such as temperature, voltage, current, etc., for early detection of faults, anomaly detection and proactive maintenance planning to prevent critical failures [Reference Mohamed, Badran and Hussien11–Reference Bensikaddour and Nasri17]. For instance, the paper [Reference Wang18] presents an anomaly detection framework using deep learning techniques, including the long short-term memory (LSTM) model, to analyse satellite telemetry data. It introduces the deviation divide mean over neighbours (DDMN) method to reduce false anomalies, thereby improving health monitoring of satellites in orbit. Nalepa et al. present in their paper [Reference Nalepa19] a two-step method for detecting anomalies in satellite telemetry data, using an LSTM network to predict signals. The authors introduce new metrics for evaluating temporal detection and discuss the Antelope Toolbox, a tool for simulating data and analysing algorithms.
-
2. Operations optimisation and planning: In this domain, ML methods are used to optimise satellite operations, including orbit estimation, energy management, mission scheduling and autonomous navigation [Reference Thangavel20–Reference Rösch and Gou22]. For instance, In Ref. (Reference LEE, KIM and LEE23), the authors presented a trilateration-based initial orbit determination (IOD) method that used satellite measurement data generated by ML. This approach employed one real ground station and two virtual ground stations, utilising simulated range rate and slant range data for orbit propagation and satellite tracking verification. Building on this, Ref. (Reference Mortlock and Kassas24) evaluates the effectiveness of two algorithms, the extended Kalman filter (EKF) and the time delay neural Network (TDNN), in a hybrid approach within a simultaneous tracking and navigation (STAN) framework. The study shows that this hybrid method significantly improves LEO satellite position tracking and vehicle navigation accuracy compared to conventional models.
-
3. Data processing and applications: This category involves the use of ML for processing satellite data, such as images, communication signals and environmental data [Reference Ma, Liu, Zhang, Ye, Yin and Johnson25, Reference Miralles26]. It includes tasks such as image enhancement and classification [Reference Mini and Bhomini27] and optimising communication links [Reference Bhattacharyya, Kumar, Sahu, Roy, Chatterjee and Paul28], where an in-depth analysis is provided on the integration of ML and deep learning (DL) in satellite communications. This analysis demonstrates how satellite communication subsystems and other satellite applications can be optimised using artificial intelligence (AI), while highlighting current challenges and future perspectives in this field.
2.0 Key parameters of satellite-ground links
Communication links between a LEO satellite and a GS depend on several key parameters to ensure efficient and reliable data transmission, the main parameters involved are [Reference Bekkar Djelloul Saiah29, Reference GALLARDO30]:
-
• Antenna directivity: LEO satellites move rapidly across the sky at high speeds. A dish antenna with narrow beam width focuses the signal reception, maximising received power and minimising interference. To maintain this focus, the GS employs an antenna tracking mechanism that continuously adjusts the antenna’s azimuth and elevation angles during the satellite’s pass over the GS.
-
• Polarisation: When circular polarisation is used, it can be either right- or left-handed. To enhance communication reliability, especially in adverse conditions such as multi-path interference, polarisation diversity techniques are employed. This approach involves sending the same data simultaneously in two different polarisations, using the same frequency. This redundancy can significantly reduce the likelihood of data loss or corruption.
-
• Doppler shift: Due to the relative motion between the satellite and the ground station, the received signal frequency appears to be either slightly higher or lower compared to the original transmission frequency. To overcome this issue, ground stations need to implement real-time Doppler correction techniques. These techniques adjust the frequency of the received signals to compensate for the Doppler shift, ensuring that the data remains accurate and coherent.
Figure 1 presents a block diagram of the GS for the Alsat-2A and Alsat-2B satellites located in Oran, Algeria. The diagram delineates the two distinct operational chains: one for telemetry reception and the other for telecommand transmission.
(a) Block diagram of the GS of the Alsat-2A and 2B satellites.

3.0 Heuristic-based polarisation switching
Initially, before implementing the ML solution, we developed a heuristic non-ML baseline for polarisation switching. Since the CDM600 modem measures only one polarisation at a time, a heuristic approach would require switching to the alternative polarisation to take an actual measurement before deciding.
The method operates as follows:
-
1. Initial selection:
-
• Proceed with the measurement of signal power level from both polarisations by alternatively switching between them.
-
• Start with the polarisation that has the highest power level.
-
-
2. Continuous monitoring:
-
• Measure the signal power level of the current polarisation from the CDM600.
-
-
3. Switching rule:
-
• Switch to the other polarisation only if the power level of the current polarisation falls below −55 dBm.
-
• After switching, measure the power level of the new polarisation:
-
∘ If the new polarisation’s power level is higher than the last known value of the previous polarisation, remain in the new polarisation.
-
∘ Otherwise, if the new polarisation’s power level is lower, immediately switch back to the previous polarisation.
-
While this approach provides a simple rule-based solution and works with actual measurements, it has significant limitations. The CDM600 modem can only measure one polarisation at a time, causing delays when switching, which may lead to temporary signal degradation or even link loss. Additionally, in cases where both polarisations exhibit similar power levels, the method can cause unnecessary switching (ping-pong effect), especially in marginal signal conditions. Indeed, we encountered situations where the CDM600 switched to the other polarisation, but its power level was significantly lower, resulting in degraded signal quality and, in some cases, a complete loss of the link. The results for one such case are provided in section 5.0. Consequently, we decided to adopt a predictive approach (section 4.0) to enhance switching decisions and improve link stability.
4.0 Proposed solution
The proposed solution integrates both hardware and software parts. The hardware component of this solution includes the electrical setup needed to control the polarisation. In parallel, the software component consists of two applications developed in Python: Parameters-Predictor and Acquisition-Drive, which are detailed in the following sections.
4.1 Parameters-Predictor application
This application is designed to forecast tracking parameters essential for satellite data acquisition, including azimuth (Az), elevation (El), and Doppler shift [Reference Bensikaddour, Nasri and Hamed31], alongside determining the optimal polarisation (LHCP or RHCP). As illustrated in Fig. 2, the application comprises various modules with distinct inputs and outputs, orchestrating a cohesive prediction framework.
Different modules, inputs and outputs of Parameters-Predictor application.

Tracking parameters are calculated using the PyEphem library [Reference Rhodes32], a well-established tool for astronomical computations known for its reliability and ease of use. Predicting these parameters necessitates two inputs: TLE (two-line elements) files, which encapsulate standardised orbital parameters of objects orbiting the Earth, and GS coordinates, comprising latitude, longitude and altitude data. This module is thoroughly described in previous work [Reference Bensikaddour, Nasri and Hamed31]. Additionally, Parameters-Predictor incorporates trained machine learning models to predict signal power level in dBm for RHCP and LHCP polarisations.
4.1.1 Dataset and model training
It is well established that azimuth and elevation directly influence the quality of RHCP and LHCP signals due to their impact on the geometric alignment between the satellite and the GS [Reference Lighari, Berg, Kallankari, Parssinen and Salonen33]. These parameters can lead to variations due to phenomena such as diffraction, reflection or attenuation of electromagnetic waves. Therefore, these two parameters were chosen to build a model capable of predicting the signal power in both RHCP and LHCP polarisations.
The ALSAT-2 satellites’ GS (S-band) operates using programme tracking rather than autotrack. In this mode, azimuth and elevation parameters are predicted before the satellite pass and used to control the antenna in real time. While minor errors may occur due to control loop limitations (e.g. latency or mechanical constraints), these errors remain minimal and do not significantly affect tracking accuracy. It is important to note that the azimuth and elevation values used in the dataset correspond to the predicted values rather than real-time measured values.
The dataset used for model training consists of historical measurements obtained from the Alsat-2A and Alsat-2B satellites. These measurements include azimuth, elevation and power level data for both RHCP and LHCP polarisations. The data was leveraged to train ML models aimed at predicting signal power level. The dataset used for training the model consists of TM data from the Alsat-2A and Alsat-2B satellites. It includes azimuth, elevation and signal strength measurements for RHCP and LHCP polarisations, collected during satellite passes over 2022 and 2023 with a recording interval of 5 seconds. A total of 145,000 entries were extracted for each satellite. The data, converted to comma-separated values (CSV) format, were cleaned and preprocessed to address anomalies and missing values. These prepared datasets were used to train ML models to predict signal strength based on azimuth and elevation.
To evaluate model performance, the dataset was divided into two subsets:
-
• Training set (80%) – used to train the machine learning model.
-
• Test set (20%) – used to assess the model’s generalisation performance.
To enhance robustness and reduce bias, five-fold cross-validation was employed. The training set was divided into five folds, with four used for training and one for validation in each iteration. This process was repeated five times, ensuring that every data point was utilised for both training and validation.
In our study, missing data and anomalies occur in the signal power measurements for RHCP and LHCP, which are provided by the previous demodulator. These inconsistencies arise due to reception conditions (e.g. atmospheric disturbances) or temporary signal loss during low-power periods. Importantly, the azimuth and elevation values, which are predicted based on orbital data and used for antenna control, remain unaffected by these signal power level anomalies.
During data preprocessing, missing signal power level values were removed rather than interpolated, as interpolation could introduce artificial trends or inaccuracies. Anomalies, such as abrupt fluctuations in power levels, were identified and filtered using the interquartile range (IQR) method, which effectively detects extreme deviations that do not reflect normal signal behaviour. Since these anomalies account for only a small fraction (approximately 2%) of the dataset, and are concentrated in periods of low signal power (specifically below −55 dBm), their impact on the overall data distribution is minimal.
To further validate their minimal effect, we assessed the model’s performance before and after anomaly removal. The results showed no significant deviation in predictive accuracy, confirming that the anomalies were either negligible or inherently accounted for by the model’s learning process.
In Figs 3 and 4, the temporal evolution of the RF signal power level for RHCP and LHCP polarisations, and the variation of this power with respect to azimuth and elevation during a previous pass, are illustrated, respectively. Both subtle fluctuations and significant variations in signal power are displayed in these graphs. It is critical to note that the CDM 600 demodulator stops working when the signal power level drops to −60 dB or below, which could impact data acquisition.
Temporal evolution of signal power level in RHCP and LHCP for a previous ALSAT-2A pass.

Signal power level variation on RHCP and LHCP vs Az and El for a previous ALSAT-2A pass.

Two well-established ML algorithms, k-nearest neighbours (kNN) and random forest (RF), have been selected for this task. The selection of these algorithms was predicated on their robustness and proven track record in handling complex datasets [Reference Rhys34]. To fine-tune the parameters of these algorithms, automatic adjustments were executed using a Python script [Reference Random Forest35, 36]. Table 1 presents the optimised parameters for both algorithms as applied to the two satellites, Alsat-2A and Alsat-2B.
Tuning kNN and RF

To mitigate noise present in the training measurements, smoothing has been applied to the predicted values of RHCP and LHCP using a moving average. This technique helps in reducing noise and stabilising the predictions.
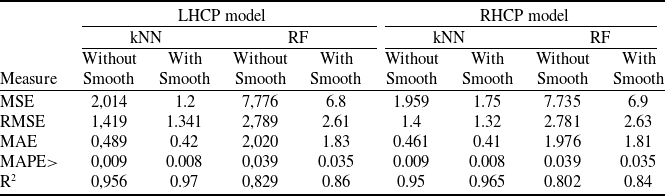
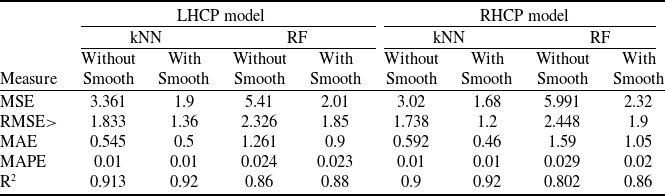
Tables 2 and 3 present the performance of the kNN and RF algorithms (without smoothing and with smoothing), evaluated using various metrics for ALSAT-2A and ALSAT-2B, respectively. The test set used for evaluation was derived from the same dataset as the training set but was kept separate to ensure an unbiased assessment of the model’s generalisation performance.
Performance of kNN and RF, using several evaluation metrics (ALSAT-2A)

Performance of kNN and RF, using several evaluation metrics (ALSAT-2B)

The smoothing was performed using a moving average with a window size of 8, selected based on empirical analysis and preliminary testing.
For the ALSAT-2A dataset, kNN consistently outperforms RF across all evaluation metrics for both LHCP and RHCP models. In the LHCP case, kNN has lower errors, with an MSE of 2.014 compared to 7.776 for RF. The RMSE (1.419 vs. 2.789), MAE (0.489 vs. 2.020), and MAPE (0.009 vs. 0.039) also show that kNN predictions are more accurate. The R² value of 0.956 for kNN confirms that it explains more of the signal’s variability compared to RF (R² = 0.829).
For the RHCP model in ALSAT-2A, the trend is the same. kNN achieves lower MSE (1.959 vs. 7.735), RMSE (1.4 vs. 2.781), MAE (0.461 vs. 1.976) and MAPE (0.009 vs. 0.039), showing better accuracy. Its R² value of 0.950 is also higher than RF’s 0.802.
For ALSAT-2B (Table 3), similar results are observed. In the LHCP case, kNN again performs better, with an MSE of 3.361 compared to 5.410 for RF. The RMSE (1.833 vs. 2.326), MAE (0.545 vs. 1.261) and MAPE (0.01 vs. 0.024) are all lower for kNN. The R² value of 0.913 for kNN confirms its better fit compared to RF (R² = 0.860).
For the RHCP model in ALSAT-2B, kNN remains superior. Its MSE (3.020 vs. 5.991), RMSE (1.738 vs. 2.448), MAE (0.592 vs. 1.590) and MAPE (0.01 vs. 0.029) are all smaller. The R² value for kNN (0.900) is also higher than for RF (0.802).
Overall, kNN consistently outperforms RF for both LHCP and RHCP models on ALSAT-2A and ALSAT-2B. This shows that kNN is better suited for these tasks, while RF may need further tuning to improve its performance.
To better understand the performance and assess the strengths and limitations of models, it is essential to examine real-world samples of predictions on evaluation samples. Figures 5 and 6 present examples of the evaluation data used to assess the performance of kNN and RFmodels in predicting LHCP signal strength. These visualisations compare the raw and smoothed model predictions against the actual measured signal values.
Representation of a sample of LHCP test data results using kNN.

Representation of a sample of LHCP test data results using random forest.

In Fig. 5, the actual LHCP signal, depicted in blue, shows a distinct time evolution over approximately nine minutes, ranging from −56 dBm to −44 dBm. This progression can be divided into three phases: a rapid initial increase, a period of relative stability and a more volatile final phase. The raw kNN model performs reasonably well, with a mean squared error (MSE) of 1.71. However, applying a smoothing technique significantly enhances its accuracy, reducing the MSE to 0.78. Despite this improvement, sharp negative peaks and sudden drops are observed around 07:50:30 and 07:51:40. These anomalies are likely due to noisy or outlier data points in the nearest neighbours used by the kNN algorithm. Smoothing helps mitigate the impact of these outliers, leading to more stable and accurate predictions and a notable reduction in prediction errors.
Figure 6 displays the RF model’s predictions for LHCP signal strength over time, compared to the actual values. The initial model has an MSE of 3.27, indicating less accurate predictions. After smoothing, the MSE improves to 1.65, showing a significant reduction in errors. While smoothing enhances the model’s stability and accuracy, the RF still underperforms compared to the kNN model, which achieves a smoothed MSE of 0.78.
Overall, the developed prediction models effectively capture the general trends of the LHCP signal but face challenges during rapid signal variations, particularly in weak signal conditions. These insights will inform the development of the Acquisition-Drive application discussed in Section 3.2.
4.2 Acquisition-Drive application
The second application aims to control the demodulator and RF switch via RS232 using the results obtained from the first application. The descriptive diagram of the application is presented in Fig. 7. This application contains modules: CDM-600 driver and Polarisation driver.
Different modules, inputs and outputs of Acquisition-Drive application.

CDM-600 driver is responsible for controlling the demodulator via a serial link, the execution process of this application is as follows:
-
1. Read the acquisition time and Doppler shift parameters of the next pass generated by the Parameters-Predictor to determine: start time of the pass, end time of the pass, and the estimated Doppler shift values for each second.
-
2. Send the first estimated frequency value (70 MHz + the first estimated Doppler shift) to the CDM-600. This is essential for the CDM-600 to establish communication with the satellite at the beginning of the pass.
-
3. Wait for the start time of the pass.
-
4. At the beginning of the pass, the application starts acquiring from the modem the measured difference between the set frequency and the actual frequency (frequency obtained at the input of the CDM-600). If the difference exceeds a pre-set threshold, the CDM-600 combines this offset with the set frequency and transmits the result to the CDM-600 as a new frequency.
-
5. If the communication link is lost between the satellite and the modem before the end of the pass, the application transmits an estimated frequency (from the file generated by Parameters-Predictor) every second until communication is restored or until the end of the pass.
The Polarisation Driver application is responsible for controlling the switch via a serial link. The execution process of this application is as follows:
-
1. Read the acquisition time and the signal power in both RHCP and LHCP, as generated by the Parameters-Predictor application.
-
2. Wait for acquisition time.
-
3. Select the appropriate polarisation to acquire telemetry data. The selection of the polarisation is based on the predicted power values in RHCP and LHCP. Once a polarisation is selected, it remains unchanged until its predicted power level falls below −55 dBm.
-
4. Send the appropriate polarisation information to the microcontroller responsible for driving the RF switch.
5.0 Tests and results
To evaluate the effectiveness of the proposed solution for managing communication links between the Alsat-2 satellites and the GS, three evaluations were conducted: Comparative Analysis, Comparison with Heuristic Method and Operational Evaluation, which are discussed in the following sections.
5.1. Comparative analysis
A comparison has been conducted between the predicted values and the actual values of azimuth, elevation and signal power levels for both polarisations. A detailed comparison of azimuth, elevation and Doppler shift values has been presented in a previous work [Reference Bensikaddour, Nasri and Hamed31]. In this study, the results for the strength of RF signals in both polarisations, obtained by the ML model, will be presented.
Several comparisons have been conducted to evaluate the performance of the developed prediction models for the Alsat-2A and Alsat-2B satellites. Figures 8 and 9 present sample results from these analyses, illustrating the actual and predicted signal power levels for LHCP and RHCP over acquisition time.
Actual and redicted LHCP and RHCP vs acquisition time (Alsat-2A).

Actual and predicted LHCP and RHCP vs acquisition time (Alsat-2B).

For Alsat-2A (Fig. 8), observations from February 28, 2024 (07:43:33 to 07:55:14) reveal distinct patterns in signal behaviour. The LHCP signal demonstrates a consistent improvement pattern, progressing from initial lower power levels to reach optimal signal strength around −40 dBm. The prediction model for LHCP shows a strong correlation with actual measurements, effectively capturing the general trend while smoothing out minor fluctuations. In contrast, the RHCP signal maintains lower power levels between −55 and −60 dBm, exhibiting more pronounced periodic fluctuations. The prediction model for RHCP follows the overall trend but shows some deviations during periods of rapid signal variation, particularly in weaker signal conditions.
Alsat-2B measurements (Fig. 9) from January 1, 2024 (09:52:15 to 10:04:31) reveal more complex signal dynamics. The LHCP signal shows variable behaviour with significant transition points, particularly around the 10:00:00 mark. The initially weak signal improves rapidly at mid-pass, posing challenges for the prediction model. The RHCP signal exhibits strong initial power levels followed by notable degradation, with significant power level fluctuations throughout the pass. The prediction model for RHCP captures the general trends but demonstrates reduced accuracy during these transitional periods.
Based on these samples and other comparisons, it can be concluded that the general trends in signal behaviour for both LHCP and RHCP of Alsat-2A and Alsat-2B are effectively captured by the developed prediction models. This observation is aligned with the results discussed in the training section (section 3.1.1) using test data.
The amplitude modulation seen in the RHCP power level (Fig. 8) is mainly caused by small changes in the tracking angles, which make the ground antenna slightly misaligned with the signal. This misalignment causes the power level to fluctuate. The effect is stronger for weaker signals like the RHCP signal in this case.
The modulation periods can be explained by these factors:
-
• Satellite attitude changes: The satellite’s attitude can change a little, especially during certain transitions, like when it moves from eclipse to sunlight or when it takes images. These small changes cause the satellite and the ground antenna to be slightly misaligned, leading to the observed modulation.
-
• Ground antenna stability: The GS antenna is housed inside a radome, which provides protection from external environmental factors such as wind. Therefore, any observed modulation is not caused by the antenna’s movement due to wind or other external influences.
The consistent modulation of ±7.5 dBm shows that these misalignments happen in a regular pattern, not randomly. This is further supported by similar patterns seen in Fig. 9, which suggests the same cause for both cases.
5.2 Comparison with heuristic method
Due to the limitation of having only one communication channel, multiple methods cannot be tested simultaneously for a direct comparison. However, we performed a simulation using a specific case to highlight the limitations of the heuristic approach, particularly its effect on performance stability and switching behaviour. Figure 10 compares the heuristic-based polarisation switching method with the ML-based predictive switching method, demonstrating the drawbacks of the heuristic approach and the advantages of the ML solution.
Comparison with heuristic method.

In the first subplot, the power levels of both RHCP and LHCP are shown over time, presenting actual values for the heuristic method and predicted values for the ML-based method at the same time. The second subplot illustrates the performance of both methods in this specific case. The heuristic method frequently switches polarisations when the power drops below −55 dBm, resulting in signal degradation due to the switching process or even loss of communication, represented by drops to −60 dBm. This often leads to a ping-pong effect, where the system switches back and forth to the original polarisation if the alternative polarisation’s power is lower, causing instability, particularly during fade events.
In contrast, the ML-based method predicts the power of both polarisations and proactively selects the optimal polarisation without relying on real-time measurements. This results in more stable signal power levels and smoother transitions, such as to the horizontal polarisation during the fade event, minimising disruption and improving reliability.
This specific case simulation highlights the advantages of using ML for polarisation switching in satellite communication systems, particularly in dynamic and challenging conditions where signal stability is crucial.
5.3 Operational evaluation
The second stage involved operational testing at the GS in Oran for the Alsat-2A and Alsat-2B satellites. Acquisition-Drive application, described in Section 3.2, has been used to drive the CDM-600 and the RF switch. This testing phase aims to evaluate the application’s effectiveness in a real operational environment.
We have fully implemented the solution on the Oran site for the S band, according to the test configuration presented in Fig. 11. The satellites (2A and 2B) evolve in sun-synchronous circular quasi-polar orbits, with respective inclinations of 98.7 degrees and 98.9 degrees, and altitudes of 645 km and 745 km. Station configuration parameters include TM frequencies of 2266.5 MHz and TC frequencies of 2087.1 MHz, as well as an intermediate demodulator frequency of 70 MHz. The bit rate is set at 384.615 kb/s.
The test configuration of the proposed solution.

Figures 12 and 13 show the EB/N0 curves for ALSAT-2A and ALSAT-2B during sample satellite passes. These curves help us understand how well the communication link works during these passes. Both satellites show high EB/N0 values, staying close to 14 dB most of the time. This means the connection between the satellites and the ground station is strong and reliable.
EB/N0 vs. Time for ALSAT-2A during satellite pass.

EB/N0 vs. Time for ALSAT-2B during satellite pass.

However, there are small fluctuations in the EB/N0 values. These variations are primarily caused by slight misalignments of the antennas, which occur due to minor changes in the satellite’s attitude. While these small shifts can lead to brief drops in signal strength, the system quickly recovers, maintaining a stable connection. Even though these small shifts can cause brief drops in signal strength, the system quickly recovers and keeps the connection stable.
Overall, the results show that the communication system works well with both satellites, even when there are small challenges. The high EB/N0 values prove that the system is strong and can handle changes, ensuring that data is transmitted reliably.
6.0 Conclusion
In this paper, the deployment of intelligent solutions for acquiring TM from Alsat-2 satellites has been presented. Two applications have been developed:
-
• The Parameters-Predictor application exploits the Ephem library to compute tracking parameters and employs ML algorithms. These algorithms are adept at forecasting signal power levels for Alsat-2A and 2B satellites across both RHCP and LHCP polarisations.
-
• On the other hand, the Acquisition-Drive application plays a critical role in real-time operational adjustments. It manages the CDM-600 demodulator and RF switch, dynamically determining the necessary Doppler shift for each satellite pass and selecting the appropriate polarisation (RHCP or LHCP) based on the predicted signal parameters.
The outcomes derived from these applications demonstrate that the integrated system is capable of acquiring telemetry in a reliable and efficient manner.