



1. Introduction
Flexible flapping surfaces operating in disturbed inflows arise in both biological locomotion and engineered propulsion systems. When a compliant membrane oscillates in the wake of an upstream bluff body, its dynamics is governed by the interaction of imposed actuation, intrinsic structural elasticity and coherent wake forcing. The manner in which these processes organise the coupled fluid–structure response determines whether flexibility mitigates or amplifies aerodynamic penalties associated with disturbance. In such environments, wakes, shear layers and vortices introduce momentum deficits and adverse pressure gradients, yet they may also be exploited to reduce energetic cost or enhance manoeuvrability (Fish & Lauder Reference Fish and Lauder2006). This dual role of disturbance is particularly relevant to bat-inspired micro air vehicles and compliant membrane wings. Bats frequently operate in cluttered, gusty and wake-rich environments, where their highly deformable membranes undergo large, spatially varying camber changes that modify vortex formation and pressure loading. Despite substantial progress in understanding flapping wings in uniform inflow, it remains unclear how prescribed flapping kinematics and passive membrane deformation jointly reorganise propulsive performance when the inflow contains a coherent upstream wake. Motivated by this question, we consider a heaving compliant membrane immersed in the wake of a stationary circular cylinder as a canonical wake–actuation–flexibility interaction problem.
A substantial body of work has examined flexible flapping wings to elucidate mechanisms underlying thrust enhancement and efficiency gains. Relative to rigid wings, compliant membranes can passively self-camber and adjust their effective angle of attack, thereby reorganising the vortex-pressure field and altering force production (Tiomkin & Raveh Reference Tiomkin and Raveh2021; Gehrke & Mulleners Reference Gehrke and Mulleners2025; Mavroyiakoumou & Alben Reference Mavroyiakoumou and Alben2025). Reduced-order analytical models coupling thin-airfoil theory with the membrane dynamics predict a thrust-to-drag transition in the vicinity of structural resonance (Tzezana & Breuer Reference Tzezana and Breuer2019). Increased compliance shifts this transition to lower actuation frequencies, accompanied by a wake reconfiguration from a reverse to a classical von Kármán street, with the force sign change lagging the topological transition. Unsteady aerodynamic formulations for extensible membranes further show that camber induction may suppress initial lift growth while enhancing asymptotic lift, with peak gains governed by membrane tension and phase lag (Tiomkin & Jaworski Reference Tiomkin and Jaworski2022). Bat-inspired articulated-wing analogues similarly demonstrate that segment-specific deformation can retune the leading-edge vortex dynamics, with vortex-induced pressure emerging as a dominant load pathway (Kumar et al. Reference Kumar, Seo and Mittal2025). Across numerical and experimental studies, peak performance is generally associated with moderate camber and controlled compliance, whereas excessive flexibility or over-cambering degrades efficiency. For example, heaving–pitching wing simulations report thrust increases of up to 200 % and efficiency gains approaching 100 % relative to rigid wings, typically below resonance (Zhang et al. Reference Zhang, Gao and Zhu2026). Experiments further reveal that at high compliance the canonical leading-edge vortex may be replaced by a bound shear layer, with edge geometry governing associated topology and performance transitions (Gehrke & Mulleners Reference Gehrke and Mulleners2025). Collectively, these results demonstrate that propulsive performance depends not only on prescribed kinematics but also on resonance, material properties and spatially varying deformation.
A complementary and practically important aspect of bat flight is operation in disturbed inflows. Upstream obstacles, terrain or neighbouring flyers generate coherent wake structures and velocity deficits that impose organised unsteady forcing. Evidence for wake-mediated locomotor assistance has been reported in several biological systems, where trailing individuals may gain energetic advantage by aligning with vortical structures shed by upstream bodies (Ramananarivo et al. Reference Ramananarivo, Fang, Oza, Zhang and Ristroph2016; Hedrick Reference Hedrick2024; Newbolt et al. Reference Newbolt, Lewis, Bleu, Wu, Mavroyiakoumou, Ramananarivo and Ristroph2024; Zhang & Lauder Reference Zhang and Lauder2024). Translating such observations into predictive, mechanistic understanding remains challenging. A canonical analogue for isolating the underlying physics is a compliant membrane-like wing immersed in the wake of a bluff body, where periodic vortex shedding provides a controlled source of unsteadiness. Although the flow past rigid bluff bodies is well characterised, the response of compliant structures to coherent wake forcing is less understood. Flexibility modifies energy-transfer pathways and can lead to large-amplitude oscillations, mode transitions and frequency lock-in (Furquan & Mittal Reference Furquan and Mittal2021). For flexible filaments and flags downstream of cylinders, wake forcing may induce constructive resonance and amplify oscillations (Michelin et al. Reference Michelin, Smith and Glover2008; Ristroph & Zhang Reference Ristroph and Zhang2008), yet it may also suppress vortex-induced vibration depending on mass ratio and bending rigidity (Banerjee et al. Reference Banerjee, Connell and Yue2015). When active heaving is imposed, the system is governed by the interaction of two periodic forcings: (i) the incoming wake characterised by its shedding frequency and convection dynamics, and (ii) the prescribed actuation frequency. The membrane response may entrain to either forcing, and sufficiently strong coupling can reorganise the shedding process itself, producing two-way lock-in. A regime-level framework that clarifies how wake forcing, imposed kinematics and structural flexibility jointly determine these transitions remains absent for membrane-like wings. This motivates a parametric investigation of the coupled roles of heaving kinematics, compliance and coherent wake forcing.
Scaling laws are central to organising this coupled dynamics and to rationalising performance trends. For rigid wings in uniform flow, mean force and power scalings can be expressed in terms of Strouhal number and effective angle of attack (Gazzola et al. Reference Gazzola, Argentina and Mahadevan2014; Floryan et al. Reference Floryan, Van Buren, Rowley and Smits2017). For flexible wings in isolation, these relations extend by incorporating structural effects through dimensionless stiffness, mass ratio and deformation measures (Moore Reference Moore2014; Mavroyiakoumou & Alben Reference Mavroyiakoumou and Alben2020, Reference Mavroyiakoumou and Alben2022). In particular, passive deformation may be embedded into an effective pitching amplitude, yielding modified scaling relations that capture thrust and power growth and the drag-to-thrust wake transition under heave or pitch actuation (Zhang et al. Reference Zhang, Gao and Zhu2026). Within this framework, the Strouhal number and effective incidence govern the emergence of a reverse von Kármán wake and the attainment of peak efficiency in uniform inflow. In contrast, when the wing operates in the wake of a bluff body, the inflow is inherently unsteady and periodically modulated by the Kármán street. The effective dynamic pressure and local incidence vary over the oscillation cycle, and the system is no longer governed by actuation alone. Wake–body coupling emerges when the flapping or structural natural frequency approaches the shedding frequency, and may be reinforced when the convective phase of incoming vortices aligns favourably with the body motion. A scaling framework that incorporates wake-induced velocity deficit, transverse shear and structural compliance alongside actuation parameters remains largely unexplored for membrane-like wings.
When the flapping dynamics locks onto the vortex-shedding frequency, a downstream flexible wing exhibits distinct small-, moderate- and large-amplitude response states. In this lock-in window, local vortex pattern reorganises, and the mean thrust, drag and energetic cost can change abruptly. Outside this frequency lock-in regime, the wing typically reverts to self-excited oscillations governed primarily by the structural and actuation dynamics (Shao & Pan Reference Shao and Pan2011; Parekh & Jaiman Reference Parekh and Jaiman2025). Consistent with observations of Kármán-gait swimming, experiments and simulations demonstrate thrust enhancement or reduced actuation cost when the flapper weaves between, or phase locks with, incoming vortices. In such cases, propulsive performance collapses when the Strouhal number is defined using the local wake velocity and augmented by the ratio of flapping to shedding frequency (Wang et al. Reference Wang, Du and Sun2024; Han et al. Reference Han, Zhang, Zhang and Huang2025). These findings indicate that frequency ratio and local wake momentum are essential organising parameters in wake–body interaction. However, existing formulations largely treat rigid or kinematically prescribed wings and do not explicitly incorporate passive compliance and curvature-induced deformation. A scaling framework that integrates the wake-momentum deficit, transverse momentum input from flapping, structural deformation and frequency alignment is therefore required to rationalise mode transitions and force amplification in compliant membranes immersed in bluff-body wakes.
Previous studies of two-dimensional flapping membranes have established baseline behaviour for the coupled fluid–structure dynamics under prescribed actuation in uniform inflow (Jaworski & Gordnier Reference Jaworski and Gordnier2015; Tzezana & Breuer Reference Tzezana and Breuer2019; Zhang et al. Reference Zhang, Gao and Zhu2026). Here, we extend that framework by introducing a coherent upstream wake disturbance and quantifying the resulting wake–actuation–flexibility interaction. We numerically investigate a thin compliant membrane executing prescribed harmonic heave in the near wake of a stationary circular cylinder at Reynolds number
 $\textit{Re}=3000$
, providing a canonical setting for wake-modulated propulsion. The objective is not to reproduce the full three-dimensional morphology of a bat wing, but to isolate the minimal mechanisms by which a compliant flapping surface transitions between wake-following and wake-reshaping states. The wake-following state corresponds to the situation where the membrane passively follows the upstream shedding frequency without changing the wake dynamics. The wake-reshaping state arises when actuation–structure coupling induces two-way lock-in, entraining and reorganising the upstream wake through resonant deformation. The problem is solved using a high-fidelity partitioned fluid–structure interaction (FSI) formulation with nonlinear iterative force correction, and the coupled response is mapped over
 $A^* \in [0.05,0.5]$
and
 $f^* \in [0.1,0.6]$
, where
 $A^*$
is dimensionless flapping amplitude and
 $f^*$
is dimensionless flapping frequency. The resulting force maps reveal a mode transition from weakly forced, wake-dominated behaviour to a high-performance regime in which lift and lift-to-drag increase abruptly. Frequency-resolved analysis identifies four distinct flapping states and shows that regime boundaries are governed by the relative ordering of three characteristic frequencies: the imposed heave frequency, the cylinder-shedding frequency and the fluid-loaded first natural frequency of the membrane. In the strongest-coupling regime, these frequencies approach one another, producing two-way lock-in in which vortex shedding locks onto actuation and amplified low-order membrane deformation reorganises the upstream wake.
The present work bridges two established research directions: (i) scaling relations for rigid and flexible flappers in uniform inflow (Gazzola et al. Reference Gazzola, Argentina and Mahadevan2014; Moore Reference Moore2014; Quinn et al. Reference Quinn, Moored, Dewey and Smits2014; Floryan et al. Reference Floryan, Van Buren, Rowley and Smits2017; Floryan & Rowley Reference Floryan and Rowley2018), and (ii) wake-driven responses of compliant filaments and flags behind bluff bodies, including instability onset and mode transitions (Michelin et al. Reference Michelin, Smith and Glover2008; Ristroph & Zhang Reference Ristroph and Zhang2008; Banerjee et al. Reference Banerjee, Connell and Yue2015). What has remained unresolved is a regime-level predictive framework for a membrane-like flapping wing operating inside a coherent bluff-body wake, where prescribed actuation, passive compliance, wake-momentum deficit and transverse gradients act simultaneously. Specifically, prior formulations do not (i) distinguish wake-dominated from actuation-dominated performance using frequency ratios, (ii) separate one-way entrainment from two-way wake reorganisation under strong actuation and (iii) collapse mean lift, drag and power across uniform and wake-modulated inflows using a minimal set of asymptotically justified terms. Addressing these gaps constitutes the central contribution of the present study.
Motivated by this gap, we address four specific questions: (i) How does a coherent cylinder wake reorganise the membrane dynamics and mean propulsive performance across heaving amplitude and frequency? (ii) Under what conditions does passive flexibility enhance, rather than degrade, performance in wake-modulated inflow? (iii) What role do the membrane’s fluid-loaded structural natural frequencies play in the tandem cylinder–membrane system? And (iv) how do flapping-mode transitions arise from the interaction of wake forcing, imposed actuation and structural response? Within the present configuration and parameter range, we make four contributions. First, we construct a regime map of the coupled response and define flapping modes quantitatively using dominant frequency ratios relative to the shedding and actuation frequencies, together with spectral energy concentration. Second, we identify the onset of two-way lock-in and show that it coincides with abrupt transitions in mean forces and energetic cost when the shedding, actuation and structural frequencies approach alignment. Third, we derive scaling relations for the cycle-averaged lift, drag and power by separating quasi-steady motion, added-mass effects, passive-curvature contributions and wake-induced momentum deficit and shear. The resulting formulation yields a compact description of performance across both uniform and wake-modulated inflows within the explored parameter space. Finally, we isolate the role of flexibility through comparison with a rigid counterpart and by explicitly extracting the curvature contribution within the scaling framework, clarifying when compliance retunes the wake interaction to enhance performance rather than merely amplifying deformation.
The remainder of the paper is organised as follows. Section 2 presents the high-fidelity FSI framework and numerical formulation. Section 3 details the geometrical configuration, boundary conditions and dimensionless parameters. The results are presented in § 4. Section 4.1 analyses the coupled wake–membrane dynamics and the compliance effect. Section 4.2 constructs the regime map and defines the flapping-mode classification based on frequency-resolved analysis. Section 4.3 develops the scaling relations for the cycle-averaged lift, drag and power. Section 4.4 examines wake modulation and frequency characteristics in the tandem system, including the onset of two-way lock-in. Section 4.5 synthesises the force trends and clarifies the mode-transition mechanism. The principal conclusions are summarised in § 5.
2. Computational FSI framework
Flapping compliant membranes in unsteady flow are modelled by the incompressible Navier–Stokes equations coupled to a flexible multibody structural dynamics. The fluid equations are discretised using a stabilised Petrov–Galerkin finite-element method in an arbitrary Lagrangian–Eulerian (ALE) frame, with temporal integration via the generalised-
 $\alpha$
scheme, where
 $\alpha$
is time-weighting parameter. The structure is discretised by a finite-element multibody formulation. A partitioned FSI strategy with nonlinear iterative force correction (NIFC) is employed to mitigate non-physical added-mass effects and ensure stability. Data transfer across the non-matching fluid–structure interface is performed with radial basis function (RBF) mapping for both kinematics and mesh motion. Each time step proceeds through a predictor–corrector sub-iteration: (i) predict structural displacement and velocity, (ii) transfer interface motion and update the ALE mesh via RBF, (iii) solve the fluid with the current interface and (iv) correct interface tractions via NIFC. The sub-iterations are repeated until the relative residual falls below
 $10^{-5}$
, typically requiring five iterations per time step. The complete weak variational forms, the numerical discretisation details and the partitioned coupling algorithm are given in Appendix A and follow our validated solver framework (Li et al. Reference Li, Law and Jaiman2019). Verification and validation against experiments for two-dimensional compliant membranes and three-dimensional multi-segment wings are reported in Li et al. (Reference Li, Jaiman and Khoo2021) and Li & Kumar Jaiman (Reference Li and Kumar Jaiman2023), respectively.
Schematic of a heaving compliant membrane immersed in disturbed flows produced by the upstream circular cylinder. The heaving structure in the black solid line indicates the initial configuration, while the structure in the red dashed line represents the transient heaving deformed geometry.

3. Problem description
A thin compliant membrane is positioned downstream of a stationary circular cylinder to investigate wake–membrane interactions. The membrane is separated from the cylinder by a dimensionless gap ratio
 $g^* = g/c$
, where
 $g$
is the cylinder-centre-to-leading-edge distance and
 $c$
is the membrane chord length. A prescribed harmonic heaving motion is imposed at both the leading and trailing edges in the vertical direction, with amplitude
 $A_{h_{\!p}}$
and frequency
 $f_{\!p}$
. A schematic of the wake-heaving compliant membrane interaction is illustrated in figure 1. A uniform inflow with velocity
 $U_{\infty } = 0.2886$
m s−1 enters the domain. The membrane has chord length
 $c = 0.2$
m and is mounted at a fixed geometric angle of attack
 $\alpha = 10^\circ$
. The upstream cylinder has radius
 $r$
, with
 $c/r = 4$
. The membrane thickness satisfies
 $h/r = 0.08$
. The membrane is attached to rigid mounts at both ends without pretension. The gap ratio is fixed at
 $g^* = 0.5$
, such that vortices shed from the upstream cylinder interact directly with the membrane throughout the heaving cycle.
The coupled dynamics of the tandem cylinder–membrane system is simulated using the developed partitioned FSI solver. The fluid domain is constructed to capture wake–body interaction and is governed by the incompressible Navier–Stokes equations. The computational domain extends
 $40c \times 40c$
in the streamwise and transverse directions. A uniform inflow velocity
 $U_{\infty }$
is prescribed at the inlet boundary
 $\varGamma _{{in}}$
, while a traction-free condition is applied at the outlet
 $\varGamma _{{out}}$
. No-slip boundary conditions are imposed on the cylinder and membrane surfaces, and slip conditions are enforced on the top and bottom boundaries. The computational fluid domain is discretised by unstructured triangular elements. The stretching ratio and the height of the first near-wall fluid element are set to 1.15 and
 $2\times 10^{-5}$
, respectively. The near-wall resolution is assessed using the standard dimensionless wall distance
 $y^+={u_\tau \Delta y_1}/{\nu }$
, where
 $\Delta y_1$
is the first-layer mesh height measured normal to the wall,
 $\nu =\mu /\rho ^f$
is the kinematic viscosity and
 $u_\tau =(|\tau _w|/\rho ^f)^{1/2}$
is the friction velocity based on the local wall, shear stress
 $\tau _w$
,
 $\mu$
is dynamic viscosity and
 $\rho$
is density of fluid. The selected first-layer height was chosen to keep
 $y^+$
below unity on the solid surfaces in the representative simulations. The structural domain is discretised with structured four-node rectangular elements. The cylinder and rigid mounts are modelled as rigid bodies, while the membrane is represented using geometrically exact co-rotational thin-shell elements. The rigid mounts undergo prescribed harmonic heaving enforced via Dirichlet boundary conditions. The non-dimensional parameters governing the coupled dynamics of the compliant membrane are defined as follows:
 \begin{equation} \textit{Re}=\frac {\rho ^f U_{\infty } c}{\mu }=3000, \quad \quad m^*=\frac {\rho ^s h}{\rho ^f c}=25.5, \quad \quad Ae=\frac {E^s h}{0.5 \rho ^f U_{\infty }^2 c} =8163 , \end{equation}
where
 $\textit{Re}$
,
 $m^*$
and
 $Ae$
denote the Reynolds number, mass ratio and aeroelastic number, respectively. The mass ratio
 $m^*$
is defined as the ratio between the structure’s mass to the displaced fluid’s mass. The aeroelastic number
 $Ae$
is defined as the balance between aerodynamic loading and membrane tension. The value
 $Ae$
= 8163 is used here as a reference compliance for the present wake–actuation–structure problem. It is not intended to represent a universal or optimal material stiffness. This value places the membrane in a moderately deformable regime that the passive deformation is sufficiently large to modify the pressure loading and wake interaction, but remains small enough that the membrane retains a well-defined chordwise shape without excessive over-cambering (Lauber et al. Reference Lauber, Weymouth and Limbert2023; Gehrke & Mulleners Reference Gehrke and Mulleners2025; Zhang et al. Reference Zhang, Gao and Zhu2026). In addition, the corresponding fluid-loaded first natural frequency lies within the range of the imposed heaving and cylinder-shedding frequencies examined below. The purpose of the present study is to isolate the wake–actuation–structure mechanism for this reference compliant membrane, rather than to construct a full stiffness parametric regime map.
The kinematics of the flexible heaving structure is governed by the dimensionless heaving frequency
 $f^*= { f_{\!p} c}/{U_{\infty }}$
and the amplitude
 $A^*={A_{h_{\!p}}}/{c}$
. Each heaving period contains five hundred time steps to well capture the coupled dynamics. For instance, the dimensionless time-step size at
 $f^*$
= 0.6 is set to
 $\Delta t U_{\infty }/c$
=
 $1/(500f^*)$
= 0.0033, resulting in a Courant–Friedrichs–Lewy number of 0.33. The instantaneous lift and drag coefficients are evaluated by integrating the fluid stress tensor
 $\boldsymbol{\sigma }^f$
into the first layer of the fluid mesh, and are given as
 \begin{equation} C_L(t)=\frac {1}{0.5 \rho ^f U_{\infty }^2 c} \int _{\varGamma ^f} (\boldsymbol{\sigma }^f \boldsymbol{\cdot }\boldsymbol{e}) \boldsymbol{\cdot }\boldsymbol{e}_z \text{d} \varGamma , \quad \quad C_D(t)=\frac {1}{0.5 \rho ^f U_{\infty }^2 c} \int _{\varGamma ^f} (\boldsymbol{\sigma }^f \boldsymbol{\cdot }\boldsymbol{e}) \boldsymbol{\cdot }\boldsymbol{e}_x \text{d} \varGamma . \end{equation}
Here,
 $\boldsymbol{e}$
is the outward unit normal vector to the membrane surface. The cycle-averaged lift and drag coefficients are obtained by averaging the instantaneous force coefficients over
 $N_c$
= 12 statistically periodic heaving cycles, which are given as
 \begin{equation} \overline {C}_L = \frac {1}{N_c T_{\!p}} \int _{t_s}^{t_s+N_cT_{\!p}} C_L(t)\,\textrm {d}t, \quad \quad \overline {C}_D = \frac {1}{N_c T_{\!p}} \int _{t_s}^{t_s+N_cT_{\!p}} C_D(t)\,\textrm {d}t, \end{equation}
where
 $t_s$
denotes the start of the statistically periodic interval and
 $T_{\!p}=1/f_{\!p}$
represents a whole heaving period.
The instantaneous pressure coefficient is sampled at fixed material coordinates
 $\xi /c$
(
 $\xi$
is the local coordinate along the membrane surface) on the upper and lower membrane surfaces, and is defined as
 \begin{equation} C_{\!p}(\xi ,t) = \frac {p(\xi ,t)-p_\infty } {0.5\rho ^f U_\infty ^2}, \end{equation}
where
 $p_\infty$
is the pressure of the oncoming free-stream flow far from the membrane wing. The cycle-averaged pressure coefficient is written as
 \begin{equation} \overline {C_{\!p}}(\xi ) = \frac {1}{N_c T_{\!p}} \int _{t_s}^{t_s+N_cT_{\!p}} C_{\!p}(\xi ,t)\,\textrm {d}t. \end{equation}
Before examining the wake flow effects, the FSI solver is validated against two benchmark cases, as detailed in Appendix B. First, the coupled dynamics of a flexible plate with prescribed flapping at the leading edge is simulated and compared with experimental measurements. The other simulation case is a thin flexible plate attached to a circular cylinder, namely the Turek
 $\&$
Hron case. Our FSI solver can reasonably predict the coupled dynamics of the flapping flexible plate. The developed FSI solver was also utilised to examine the coupled dynamics of a two-dimensional compliant membrane at
 $\textit{Re}$
= 2500 (Li & Kumar Jaiman Reference Li and Kumar Jaiman2023) and a three-dimensional circular cylinder at
 $\textit{Re}$
= 3900 (Joshi & Jaiman Reference Joshi and Jaiman2017) with comparative studies. A convergence study for the tandem cylinder–heaving membrane configuration is presented in Appendix C to determine suitable mesh resolutions and time-step sizes for subsequent simulations.
4. Results and discussion
We consider a two-dimensional compliant membrane downstream of a circular cylinder as a canonical configuration for wake–structure interaction. A series of wake–membrane interaction cases is simulated over a parameter space of heaving amplitudes and frequencies using the developed FSI solver. The dimensionless heaving amplitude ranges from 0.05 to 0.5, which covers the full-wake to intermittent wake-exposure conditions. The non-dimensional heaving frequency is varied over
 $f^* \in [0.1, 0.6]$
, spanning wake-dominated to actuation-dominated regimes. The Reynolds number is fixed at 3000, representative of efficient flow environments (
 $\textit{Re}= \mathcal{O} (10^3)$
) for small-scale bat locomotion (Liu et al. Reference Liu, Wang and Liu2024) and energy harvesters (Huang et al. Reference Huang, Xia, Dai, Yang and Wu2021; Farooq et al. Reference Farooq, Ghommem, Khalid and Akhtar2022). At this Reynolds number, the wake may exhibit three-dimensional instabilities. However, the present study restricts attention to the two-dimensional dynamics in order to isolate the frequency organisation and membrane deformation mechanisms. The analysis therefore focuses on identifying flapping-mode transitions and deriving a mechanistic scaling relation within the two-dimensional wake–actuation–structure coupling framework.
To isolate the respective roles of wake forcing and structural compliance, two baseline configurations are examined: (i) a tandem cylinder–heaving rigid plate and (ii) an isolated heaving compliant membrane. These references enable separation of wake-induced effects from purely structural and actuation-driven dynamics. Across the
 $f^*- A^*$
parameter space, we analyse the flow topology, coupled membrane response, frequency organisation and flapping-mode transitions of the compliant membrane in the cylinder wake. Mechanistic scaling relations for the cycle-averaged lift, drag and power coefficients are derived for all three configurations, providing a unified description of propulsive performance. The impact of wake modulation is quantified by direct comparison with the isolated compliant membrane. A phase diagram is constructed to delineate the transition from wake-following behaviour to wake reorganisation via two-way lock-in.
4.1. Coupled dynamics and flow features
4.1.1. Aerodynamic performance of heaving compliant membrane
We begin by examining how cycle-averaged forces and membrane deformation vary across the heaving parameter space, before interpreting the associated flow topology. Figure 2 presents the cycle-averaged aerodynamic coefficients and maximum membrane deformation across the
 $f^*-A^*$
space for the tandem heaving configuration. For reference, the contours include the performance of non-heaving compliant membranes in tandem and isolated configurations, indicated by white and red isolines, respectively. This comparison isolates the relative contributions of prescribed actuation and wake forcing to the coupled response. Representative instantaneous vorticity fields, membrane deformation snapshots and cycle-averaged pressure distributions are provided in figures 3 and 4 to elucidate the mechanisms underlying the observed performance transitions.
Cycle-averaged (a) lift coefficient, (b) drag coefficient, (c) lift-to-drag ratio and (d) maximum membrane deformation relative to its rigid counterpart in the
 $f^*$
–
 $A^*$
space. The white line indicates the isoline of the non-heaving tandem compliant membrane behind a cylinder. The red line represents the isoline of the non-heaving isolated compliant membrane.

At low heaving amplitudes and frequencies, the cycle-averaged lift and drag vary only weakly across the
 $f^*-A^*$
space (figures 2
a and 2
b), remaining close to the non-heaving tandem baseline. This low-performance regime corresponds to a wake-dominated dynamics in which the membrane motion remains strongly constrained by the incoming cylinder wake. The instantaneous vorticity fields shown in figure 3 indicate that at
 $(f^*,A^*)=(0.3,0.05)$
the membrane remains embedded within the low-momentum wake core for most of the oscillation cycle, closely resembling the non-heaving tandem configuration. Consistently, the cycle-averaged pressure distributions presented in figure 4 show weak leading-edge suction and limited chordwise pressure recovery, reflecting the reduced dynamic pressure within the wake core.
Increasing the heaving amplitude at low frequency produces a gradual transition toward an intermittent wake-exposure regime, accompanied by modest increases in both lift and drag. Physically, larger vertical excursions allow the membrane to access higher-momentum fluid outside the wake core during part of the cycle, thereby increasing the effective dynamic pressure and transverse momentum input. This enhances the cross-membrane pressure difference while leaving the upstream vortex-shedding pattern largely unchanged. The representative case
 $(f^*,A^*)=(0.1,0.35)$
(figures 3 and 4) exhibits intermittent detachment from the wake core, moderately increased deformation and enhanced leading-edge suction, yet no qualitative change in wake topology.
Comparison of (a–f) instantaneous
 $Y$
-vorticity contours at four instants within one heaving period in the Eulerian coordinate and (g–l) cycle-averaged
 $Y$
-vorticity contours in the body-following frame. Comparison of (m) time-varying lift and drag coefficients between the non-heaving isolated and tandem cases, and four representative cases selected from the
 $f^*$
–
 $A^*$
space.

A marked increase in propulsive performance emerges at moderate heaving amplitudes and frequencies. In this regime, the membrane motion progressively detunes from the imposed wake shedding, and the prescribed heaving begins to dominate the near-body flow organisation. The lift-to-drag ratio attains its maximum within the explored parameter space at
 $(f^*,A^*)=(0.2,0.5)$
as shown in figure 2(c), accompanied by a pronounced increase in membrane deformation (figure 2
d), exhibiting intensified fluid–structure coupling. The corresponding cycle-averaged pressure distributions plotted in figure 4(a) reveal a substantially intensified leading-edge suction region on the upper surface, consistent with increased effective circulation and a more favourable pressure-loading distribution than in the wake-dominated regime.
At the largest heaving amplitudes and frequencies, the coupled system enters a two-way lock-in regime, characterised by abrupt increases in both cycle-averaged lift and drag. In this regime, the membrane ceases to behave wake-following responses. Instead, the imposed heaving generates sufficiently strong unsteadiness to alter the local shedding process, leading to frequency lock-in between the actuation and wake frequencies and a reorganisation of the near-wake topology. The instantaneous and cycle-averaged vorticity fields at
 $(f^*,A^*)=(0.5,0.5)$
in figure 3 show a coherent restructuring of vortex formation in the vicinity of the membrane. The corresponding pressure distribution observed from figure 4(a) exhibits a dominant leading-edge suction peak. Relative to the moderate-amplitude case
 $(f^*, A^*) = (0.2, 0.5)$
, the peak suction increases by approximately a factor of five, while the deformation amplitude nearly doubles (figure 4
b). A sharp force increase of this type is consistent with previous studies of flapping compliant membranes, where the aerodynamic load was shown to depend nonlinearly on heave-induced incidence, added-mass forcing, vortex-induced suction and deformation amplification (Tzezana & Breuer Reference Tzezana and Breuer2019; Zhang et al. Reference Zhang, Gao and Zhu2026). The combined amplification of suction and deformation accounts for the large aerodynamic forces observed in figure 2 and motivates the frequency-resolved analysis presented in § 4.2.
Comparison of (a) cycle-averaged pressure coefficients along the membrane chord and (b) maximum membrane deformation profile relative to its rigid counterpart.

4.1.2. Membrane compliance effect on aerodynamic performance
To isolate the role of structural compliance independently of wake–heave kinematics, we compare the tandem compliant membrane with an identical rigid geometry across the same
 $f^*-A^*$
space. Three dimensionless indicators are defined to quantify flexibility-induced changes in the cycle-averaged lift, drag and lift-to-drag ratio
 \begin{equation} C_{\textit{LGF}}^f = \frac {\overline {C}_L^{tf} - \overline {C}_L^{tr}}{\overline {C}_L^{tr}}, \quad C_{\textit{DPF}}^f = \frac {\overline {C}_D^{tf} - \overline {C}_D^{tr}}{\overline {C}_D^{tr}}, \quad C_{\textit{LDF}}^f = \frac {\overline {{C}_L^{tf}/{C}_D^{tf}} - \overline {{C}_L^{tr}/{C}_D^{tr}}}{\overline {{C}_L^{tr}/{C}_D^{tr}}} , \end{equation}
where the superscripts
 $tf$
and
 $tr$
denote the tandem flexible and tandem rigid configurations. The corresponding phase diagrams, expressed in percentage form, are shown in figure 5, where the zero isoline separates regions of beneficial and detrimental compliance.
Figure 5(a) shows that compliance enhances lift predominantly once the coupled system heaves at higher amplitudes and frequencies. This gain is consistent with the substantially enlarged passive deformation at higher
 $(f^*,A^*)$
, driven by the stronger added-mass loading and more intense fluid–structure coupling. By contrast, when the membrane is fully immersed in the low-momentum wake, flexibility tends to reduce the mean lift relative to the rigid case (negative
 $C_{\textit{LGF}}^f$
). In this regime, passive bending primarily aligns the membrane with the local disturbed inflow, reducing effective camber and limiting circulation enhancement.
The drag response exhibits a distinct dependence on the heaving parameters. Figure 5(b) shows that the drag modification induced by compliance depends primarily on heaving frequency, with comparatively weaker sensitivity to amplitude. For fixed amplitude, increasing
 $f^*$
amplifies the contribution of compliance to drag through enhanced added-mass effects and unsteady pressure loading. By contrast, variations in amplitude alone do not systematically determine the sign of the drag modification. The combined effect on propulsive efficiency is summarised by the lift-to-drag factor in figure 5(c). Notably, in the intermittent wake-exposure regime at lower frequencies, compliance yields a positive
 $C_{\textit{LDF}}^f$
, resulting in a higher lift-to-drag ratio than the rigid counterpart. For the present reference compliance, this indicates that intermittent wake exposure allows the membrane deformation to redistribute the surface pressure in a way that enhances lift without a proportional drag increase. This statement should not be interpreted as a general property of all membrane stiffnesses. For a much lower Young’s modulus, the same kinematics could produce excessive deformation and a larger drag penalty. For a much larger Young’s modulus, the response would approach the rigid-plate limit. In contrast, when the membrane remains fully immersed within the wake core, compliance reduces lift and thereby lowers overall efficiency.
Phase diagram of (a) lift-gain factor, (b) drag-penalty factor and (c) lift-to-drag factor of the compliant membrane due to flexibility effect in percentage form. The isoline in black colour indicates the zero value in the phase diagram.

Figure 5. Long description
Panel A: A heat map representing the lift-gain factor of a compliant membrane. The x-axis is labeled f* ranging from 0.1 to 0.6, and the y-axis is labeled A* ranging from 0.05 to 0.5. The color scale ranges from -40 to 80, with blue indicating lower values and red indicating higher values. There is a notable region of high lift-gain factor around f* = 0.4 and A* = 0.2. A black isoline indicates the zero value in the phase diagram. Panel B: A heat map representing the drag-penalty factor of a compliant membrane. The x-axis is labeled f* ranging from 0.1 to 0.6, and the y-axis is labeled A* ranging from 0.05 to 0.5. The color scale ranges from -20 to 100, with blue indicating lower values and red indicating higher values. There is a notable region of high drag-penalty factor around f* = 0.4 and A* = 0.2. A black isoline indicates the zero value in the phase diagram. Panel C: A heat map representing the lift-to-drag factor of a compliant membrane. The x-axis is labeled f* ranging from 0.1 to 0.6, and the y-axis is labeled A* ranging from 0.05 to 0.5. The color scale ranges from -30 to 10, with blue indicating lower values and red indicating higher values. There is a notable region of high lift-to-drag factor around f* = 0.4 and A* = 0.2. A black isoline indicates the zero value in the phase diagram.
To elucidate the mechanism underlying the sign change of
 $C_{\textit{LGF}}^f$
in figure 5(a), we examine two representative cases located on opposite sides of the zero isoline:
 $(f^*,A^*)=(0.2,0.15)$
, corresponding to full wake immersion, and
 $(f^*,A^*)=(0.5,0.25)$
, corresponding to intermittent wake exposure at higher frequency. Figure 6 compares the cycle-averaged chordwise pressure distribution, instantaneous force histories, instantaneous vorticity fields during downstroke and the time-varying pressure difference between the upper and lower surfaces for rigid and flexible configurations.
Comparison of (a,d) cycle-averaged pressure coefficient distribution along the membrane chord, (b,e) lift and drag coefficients and (c, f) instantaneous
 $Y$
-vorticity during downstroke and (g,h) time-varying pressure coefficient difference of upper and lower surfaces between the tandem rigid and flexible configurations at (a,b,c,g)
 $(f^*,A^*)=(0.2,0.15)$
and (d,e, f,h)
 $(f^*,A^*)=(0.5,0.25)$
.

In the full-wake case
 $(f^*,A^*)=(0.2,0.15)$
, the compliant membrane bends downward as it interacts with vortical structures convecting from the cylinder, as shown in figure 6(c). This reverse camber locally reduces the effective angle of attack during part of the oscillation cycle, weakening leading-edge suction and reducing the instantaneous lift relative to the rigid configuration (figures 6
a and 6
b). The corresponding pressure-difference signal shown in figure 6(g) exhibits both reduced amplitude and a phase shift relative to the rigid case, leading to diminished cycle-integrated lift. This behaviour is consistent with the negative lift-gain factor in figure 5(a). By contrast, compliance becomes beneficial at
 $(f^*,A^*)=(0.5,0.25)$
. The cycle-averaged pressure distribution in figure 6(d) shows intensified leading-edge suction, while the time-resolved pressure difference between the upper and lower surfaces noticed from figure 6(h) exhibits increased amplitude. These effects generate higher aerodynamic loading than in the rigid configuration, as observed in figure 6(e). In this regime, the membrane deformation remains phase aligned with the heaving-induced unsteadiness rather than being governed by the incoming wake structures. As a result, compliance functions as an effective dynamic camber, enhancing circulation and lift, while the associated drag modification remains comparatively moderate.
4.2. Frequency characteristics and flapping-mode classification
We now formalise the regime classification using frequency characteristics and deformation-mode signatures, providing an operational definition of the flapping modes referenced throughout § 4. The vibration of the compliant membrane
 $\delta _n^f$
relative to its rigid counterpart
 $\delta _n^r$
is decomposed into standard sinusoidal shapes. The purpose is to quantify the contributions of structural vibration modes of
 $m$
th order to the total flow-induced vibration. The decomposition of vibration fluctuations at each structure node
 $\xi$
is written as (Li et al. Reference Li, Zhang, Lei, Wang, Jiang and Liu2024)
 \begin{equation} \frac {\delta _n^f(\xi ,t)-\delta _n^r(\xi ,t)}{c} \approx \sum _{m=1}^{M} \beta _m(t) \sin \left ( m \pi \frac {\xi }{c} \right ) \quad \quad \quad m=1,2,3,\ldots , \end{equation}
where
 $\beta _m(t)$
is the decomposed coefficient. The contribution of each mode to the total vibration response is evaluated by the standard deviation
 $\sigma _m$
of the decomposed coefficients, which is given as
 \begin{equation} \sigma _m=\sqrt {\frac {\sum _{k=1}^{K}(\beta _m(t_k)-\overline {\beta }_m)^2}{K-1}} , \end{equation}
where
 $K$
is the number of decomposed coefficients. In this study, the contributions of the first five structural modes
 $\sigma _m/{\sum _{m=1}^{5}\sigma _m}$
are calculated. In practice, the first mode captures large-scale camber deformation, while higher modes represent localised curvature variations associated with intensified fluid–structure coupling.
Comparison of (a) mode contributions of the first five membrane vibration modes through standard sinusoidal decomposition in (4.2) and (4.3). (b) Frequency spectra of the lift performance of the compliant membrane and cylinder and the membrane vibration frequency characteristic. Dominant FMD
 $Y$
-vorticity and pressure modes of the coupled system in the flapping-body reference frame for non-heaving isolated, tandem cases and four representative heaving cases are extracted at the frequency peaks. The magenta and black dashed lines in the frequency spectra of the four representative heaving cases denote the dominant dimensionless frequencies of the VIV and WIV modes. Here WD is wake dominated; FD-LR is flapping-dominated lift reduction; FD-LG is flapping-dominated lift gain; TW is two-way lock-in.

The global Fourier mode decomposition (FMD) method (Li et al. Reference Li, Jaiman and Khoo2022) is employed to extract frequency spectra and dominant flow modes of the coupled wake–membrane system. In the presence of heaving motion, conventional Eulerian-frame decomposition methods are ill posed for extracting dominant fluid modes near the body. Grid points that lie inside the body at one instant re-enter the fluid at another, so the snapshot sequence is no longer defined on a fixed fluid domain. This injects geometry artefacts (ghost body outlines, spurious shear layers tied to the changing boundary and contamination from rigid-body translation/rotation) into the computed decomposition modes and obscures near-body physics where the coupling actually occurs. To overcome this limitation, recent studies have reformulated modal decomposition in body-following or Lagrangian reference frames (Menon & Mittal Reference Menon and Mittal2020; Shinde & Gaitonde Reference Shinde and Gaitonde2021). Following this coordinate-transformation approach, we extend the global FMD method from Li et al. (Reference Li, Jaiman and Khoo2022) to extract fluid modes in the heaving-body reference frame. Specifically, we construct a time-dependent diffeomorphic mapping
 $\varPhi _t$
that transports each Eulerian snapshot
 $\boldsymbol{x}^f$
to a foil-following coordinate system
 $\boldsymbol{x}_l^f$
, defined as
 \begin{equation} \boldsymbol{x}_l^f (t^n) = \varPhi _t (\boldsymbol{x}^f (t^n)) = \boldsymbol{x}^f (t^n)- \boldsymbol{X_h} (t^n), \end{equation}
where
 $\boldsymbol{X_h} (t^n)$
denotes the imposed heaving displacement. Thus, the flow variables on the fixed reference frame can be mapped as
 $\boldsymbol{\tilde {y}}_n (\boldsymbol{x}_l^f,t^n)=\boldsymbol{{y}}_n (\varPhi ^{-1}_t(\boldsymbol{x}_l^f),t^n)$
. Similar to the conventional FMD method, the fluctuation flow field
 $\boldsymbol{\tilde {y}}^{\prime }_n (\boldsymbol{x}_l^f,t^n)$
is then decomposed into the reference frame of the heaving body. The decomposed spatial fluid mode
 $\boldsymbol{c}_k$
at a specific discrete frequency
 $f_k$
is expressed as
 \begin{equation} \boldsymbol{c}_k = \mathcal{F}(\boldsymbol{\tilde {y}}^{\prime }_n (\boldsymbol{x}_l^f,t^n) ) = \sum _{n=0}^{N-1} \boldsymbol{\tilde {y}}^{\prime }_n (\boldsymbol{x}_l^f,t^n) e^{-i \frac {2 \pi k}{N}n}, \end{equation}
where
 $N$
represents the number of snapshots. The mapping preserves smoothness and invertibility, ensuring that the transformed snapshots remain defined on a fixed reference domain for subsequent spectral analysis. The FMD method in the reference frame of the heaving body yields objective geometry-consistent fluid modes that isolate coherent fluid structures and wake–membrane coupling, without contamination from the changing boundary or from global translation or rotation. Practically, this eliminates remeshing artefacts and domain-occupancy flips, sharpens the spectral content and provides compact, interpretable modal structures tied to the physics that drive force production.
Dominant dimensionless flow frequency characteristics of (a) heaving compliant membranes and (b) a stationary cylinder determined by the FMD method from the vorticity field. Estimated dimensionless natural frequency of the heaving compliant membrane for (c) the first-order mode and (d) the second-order mode.

Figure 7(a) summarises the relative contributions of the first five membrane deformation modes, quantified by (4.3). Figure 7(b) compares the frequency spectra of the membrane lift coefficient, cylinder lift coefficient and membrane vibration amplitude. Dominant FMD
 $Y$
-vorticity and pressure modes are extracted at the principal frequency peaks associated with cylinder shedding and imposed heaving, evaluated in the flapping-body reference frame. Three distinct excitation mechanisms contribute to membrane vibration, namely vortex-induced vibration (VIV), wake-induced vibration (WIV) and actuation-induced vibration. To isolate these mechanisms, two additional configurations are simulated: (i) an isolated compliant membrane without heaving to identify self-excited VIV generated by its own vortex shedding, and (ii) a tandem compliant membrane without heaving to identify WIV induced by the upstream cylinder wake. The dominant dimensionless frequencies associated with the VIV and WIV modes are superimposed on the spectra in figure 7(b) as magenta and black dashed lines, respectively.
To relate the flow dynamics to aerodynamic performance, we analyse the spectra in figure 8 in terms of three characteristic frequencies: the imposed heaving frequency
 $f_{\!p}$
, the cylinder vortex-shedding frequency
 $f^w$
and the dominant membrane response frequency
 $f^m$
extracted from the vorticity field. The red dashed line denotes the imposed heaving frequency
 $f_{\!p}$
, while the black dashed line marks the isolated-cylinder-shedding frequency
 $f^w$
. We also use the estimated membrane natural frequency
 $f_n$
in figures 8(c) and 8(d) as a reference for identifying modal amplification and resonance-assisted responses. The expression of the natural frequency of a two-dimensional heaving compliant membrane immersed in fluid flows is derived in Appendix E. We use (E15) to estimate the first two-order natural frequencies of the compliant membrane, which are added to the frequency spectra of the non-heaving isolated and tandem cases in figure 7(b). The dominant frequency of the non-heaving isolated membrane
 $f c/ U_{\infty }$
= 0.5 approaches the natural frequency corresponding to the first-order membrane mode
 $f_1 c/ U_{\infty }$
= 0.55. The VIV is triggered through frequency lock-in, resulting in the first-order-mode-dominated vibration observed in figure 7(a). This finding is consistent with the VIV mechanism of a three-dimensional membrane observed in Li et al. (Reference Li, Jaiman and Khoo2021). For the non-heaving tandem configuration, the dominant frequency
 $f c/U_{\infty }=0.71$
lies close to the second-mode natural frequency
 $f_2 c/U_{\infty }=0.69$
. This WIV-type vibration shows a second-order dominated mode in figure 7(a). We also observe weaker secondary peaks in the spectra that are not simple higher harmonics. These peaks are consistent with nonlinear wake–heave interaction, appearing as combination tones (e.g.
 $f_{\!p} \pm f^w$
) that persist in both the kinematic and force signals.
Comparison of (a) frequency characteristics between the tandem compliant membrane and its rigid counterpart and (b) FMD pressure modes at the heaving frequency
 $f_{\!p}$
and the WIV frequency
 $f^w$
for tandem compliant membrane at
 $(f^*,A^*)=(0.2,0.15)$
.

Based on the frequency characteristics, flow-mode signatures and the lift change relative to the tandem rigid plate as the performance discriminator, four flapping modes are classified: WD, FD-LR, FD-LG and TW. These modes are defined as follows.
-
(i) The WD mode: WD corresponds to cases where the coupled dynamics is governed primarily by the incoming cylinder wake. The frequency spectra of both the cylinder (
 $f^c$
) and the membrane (
$f^m$
) exhibit dominant peaks near the WIV band
$f^w$
(figures 8
a and 8
b). The membrane response locks into
$f^w$
rather than
$f_{\!p}$
. In this state, the membrane exhibits wake-following responses. Compared with the rigid case shown in figure 9(a), vibration energy is concentrated near the wake shedding frequency
$f^w$
. The induced mode near
$f^w$
weakens leading-edge suction (figure 9
b), consistent with reduced aerodynamic performance under full-wake conditions presented in figure 6(a).
-
(ii) The FD-LR mode: FD-LR denotes cases where the heaving kinematics become the primary organiser of the near-body unsteadiness. The dominant spectral content of the compliant membrane
$f^m$
shifts toward
$f_{\!p}$
(figure 8
a) and the FMD modes show a clearer heave-imposed structure (figure 7
a). The wake deficit is not sufficiently compensated for the compliant membrane to outperform its rigid counterpart. In other words, the response is flapping dominated in frequency selection (
$f^m$
trending to
$f_{\!p}$
), but still lies on the lift-reduction side of the lift-change boundary in figure 5(a). This mode typically appears near the transition out of strict wake following, where wake–heave interaction is present but does not yield a net lift benefit. -
(iii) The FD-LG mode: FD-LG is defined by a heave-controlled spectral signature together with a positive lift change relative to the tandem rigid plate. Mechanistically, once this boundary is exceeded, passive deformation supplies additional transverse momentum that compensates the axial momentum deficit of the incoming wake. The membrane deforms upward near the top position, generating an additional positive effective angle of attack and strengthening leading-edge suction. In the frequency domain, the vibration energy becomes concentrated mainly at the heaving frequency
$f_{\!p}$
, rather than being attracted by
$f^w$
shown in figure 8(a). The structural-mode content is also aligned with heave-driven excitation, where the first-order mode is preferentially activated by heaving motion and shed vortices. -
(iv) The TW mode: TW represents the strongest coupling state, in which the downstream heaving membrane not only locks its dominant response to the imposed heaving frequency
$f_{\!p}$
, but also feeds back to modulate the upstream shedding (figures 8
a and 8
b). In this regime, the cylinder wake frequency
$f^c$
locks onto
$f_{\!p}$
. Examination of the membrane natural frequencies in figures 8(c) and 8(d) shows that the first natural frequency
$f_1$
approaches
$f_{\!p}$
. This near-resonant structural condition amplifies the first-mode contribution and increases membrane deformation. As shown in figure 6, the enhanced deformation strengthens both instantaneous and cycle-averaged pressure differences across the membrane, intensifying aerodynamic forcing and enabling feedback to the upstream wake. The resulting triadic frequency alignment (
$f^c \approx f_{\!p} \approx f_1$
) promotes the onset and persistence of TW.


The amplified first-mode deformation acts as an effective unsteady camber, elevating suction and increasing the surface pressure difference, thereby producing the largest lift gains observed for the flexible membrane. Meanwhile, the reinforced pressure loading and coherent vortex formation near the membrane modify the local wake-momentum distribution and vorticity organisation. These changes propagate upstream through pressure and velocity coupling, altering the cylinder vortex-shedding process. Consequently, the wake flow features are modulated by the downstream heaving motion through two-way frequency lock-in. Propulsive performance is improved through the coupled effects of deformation-assisted suction enhancement and wake reshaping. This observed TW phenomenon is consistent with prior wake–structure interaction studies, which demonstrate that a downstream flapping structure can not only respond to the incoming cylinder wake but also feed back to reshape the vortex-shedding process of the upstream bluff body. Wu & Shu (Reference Wu and Shu2011) showed that introducing a flapping plate in the near wake of a stationary cylinder can reorganise vortex formation and induce lock-in. Bao & Tao (Reference Bao and Tao2013) reported that a streamwise oscillating wing placed in the cylinder wake can actively control the vortex street and alter the effective shedding characteristics through periodic forcing and wake reattachment or deflection.
4.3. Scaling relations of coupled compliant membrane dynamics
The flapping-mode classification analysis in § 4.1 indicates that the mean propulsive performance of the tandem compliant membrane is governed by three coupled components: (i) the prescribed heaving kinematics, which sets the dominant transverse forcing and an effective incidence; (ii) passive structural deformation, which modifies the instantaneous camber and hence the pressure loading; and (iii) wake effects, which impose an axial momentum deficit and a transverse shear across the incoming flow. The frequency analysis further shows that, as
 $f^*$
increases, the flow response progressively locks into the actuation. In the TW regime, the wake itself is reorganised by the downstream membrane. These observations motivate a compact scaling framework that separates heaving kinematic, structural and wake contributions, while retaining an explicit descriptor for frequency lock-in. The following scaling relations should be interpreted as fixed-compliance, physics-guided regressions for the present dataset. They are used to separate the dominant force contributions associated with heaving kinematics, passive curvature and wake-momentum effects at
 $Ae=8163$
.
In this section, we therefore derive scaling relations for lift, drag and power by decomposing the total force into five physically interpretable contributions: (i) quasi-steady motion, (ii) added-mass effects, (iii) curvature-induced forces from passive deformation, (iv) velocity loss due to the wake deficit and (v) transverse momentum gradients across the wake. These scaling relations are physics-guided regression models whose terms correspond to the dominant mechanisms identified in the mode analysis for a nonlinear fully coupled wake–FSI system. Consider the predicted lift force as follows:
 \begin{align} \overline {C}_L^p=\underbrace {{\overline {C}_L}_0}_{\text{static}} + \underbrace {a_1 f^* A^*}_{\text{quasi-steady}} + \underbrace {a_2 \sin \left ( \pi \frac {f^*}{f_0} \right ) {A^*}^2}_{\text{heaving}} + \underbrace {a_3 \kappa ^* A^*}_{\text{curvature}} + \underbrace {a_4 W f^* A^*}_{\text{velocity loss}} + \underbrace {a_5 \textit{GA}^*}_{\text{wake gradient}} , \end{align}
where
 ${\overline {C}_L}_0$
denotes the static lift coefficient of the non-heaving tandem compliant membrane and
 $\kappa ^*$
is the curvature of the deformed structure shape. The velocity-loss coefficient and flow gradient of wake flows are defined as
 $W$
and
 $G$
. The fitting coefficients
 $a_1$
,
 $a_2$
,
 $a_3$
,
 $a_4$
and
 $a_5$
are determined by the nonlinear regression fitting algorithm for the present canonical cylinder–membrane configuration and parameter range. The terms in the expression of the lift coefficient are derived as follows.
We assume that the heaving motion is a simple harmonic oscillation governed by
 $h_{\!p}(t) = A_{h_{\!p}} \sin (2 \pi f_{\!p} t)$
. The imposed heaving velocity introduces an effective angle of attack. According to the unsteady thin wing theory proposed by Theodorsen (Theodorsen Reference Theodorsen1935), the variation of circulation
 $\varGamma ^{qs}$
is proportional to the instantaneous transverse velocity
 $\dot {h}_{\!p}(t)$
, which is given as
 \begin{equation} \varGamma ^{qs} \propto \dot {h}_{\!p}(t)= 2 \pi f_{\!p} A_{h_{\!p}} \cos (2 \pi f_{\!p} t) . \end{equation}
By introducing two dimensionless parameters
 $f^*= { f_{\!p} c}/{U_{\infty }}$
and
 $A^*={A_{h_{\!p}}}/{c}$
, the equation can be rewritten as
 \begin{equation} \varGamma ^{qs} \propto 2 \pi U_{\infty } \frac { f_{\!p} c}{U_{\infty }} \frac {A_{h_{\!p}}}{c} \cos (2 \pi f_{\!p} t) = 2 \pi U_{\infty } f^* A^* \cos (2 \pi f_{\!p} t) . \end{equation}
Thus, the quasi-steady lift coefficient is calculated by
 \begin{equation} \overline {C}_L^{qs} = \frac {\overline {L}^{qs}}{\dfrac{1}{2} \rho ^f U^2_{\infty } c} = \frac {\rho ^f U_{\infty } \overline {\varGamma }^{qs}}{\dfrac{1}{2} \rho ^f U^2_{\infty } c} = \frac {2 \overline {\varGamma }^{qs}}{U_{\infty } c} \propto \frac {8 U_{\infty } f^* A^*}{U_{\infty } c}= \frac {8}{c} f^* A^* . \end{equation}
The quasi-steady lift coefficient component is contributed by the product of heaving frequency and amplitude, which can be finally written as
 \begin{equation} \overline {C}_L^{qs} = a_1 f^* A^* . \end{equation}
The additional lifting force contributed by the inertial effect of the fluid during heaving is proportional to the square of the amplitude (Sarpkaya Reference Sarpkaya2004). To account for lock-in between heave and shedding, a phase-modulation factor
 $\sin ( \pi( {f^*}/{f_0}) )$
is introduced to consider the frequency synchronisation between the heaving motion and vortex-shedding process. The lift force associated with added-mass effect during heaving motion is given by
 \begin{equation} \overline {F}^{\textit{ine}} \propto \rho ^f U^2_{\infty } A^2_{h_{\!p}} \sin \left ( \pi \frac {f^*}{f_0} \right ) \!. \end{equation}
The phase-modulation term is introduced phenomenologically to represent constructive or destructive interaction between the imposed heaving motion and the incoming wake forcing. It is not intended as a first-principles asymptotic derivation, but rather as a compact representation of the observed phase-sensitive amplification behaviour within the explored parameter range. Thus, the lift coefficient is written as a function of heaving amplitude and frequency
 \begin{equation} \overline {C}_L^{\textit{hea}} = \frac {\overline {F}^{\textit{ine}}}{\dfrac{1}{2} \rho ^f U^2_{\infty } c} = a_2 \sin \left ( \pi \frac {f^*}{f_0} \right ) {A^*}^2. \end{equation}
The lift component contributed by the compliant membrane deformation during heaving motion can be regarded as a function of time-averaged structure curvature and heaving amplitude (Waldman & Breuer Reference Waldman and Breuer2017). The circulation related to flexible deformation can be written as
 \begin{equation} \overline {\varGamma }^{\textit{cur}} \propto (\kappa )^m (A_{h_{\!p}})^n U^p_{\infty } c^q. \end{equation}
Assuming the curvature-induced circulation scales linearly with both characteristic curvature and heaving amplitude over the explored parameter range, we obtain
 $m=n=p=q$
= 1. Thus, the lift coefficient contributed by structure deformation is given as
 \begin{equation} \overline {C}_L^{\textit{cur}} = \frac {\overline {L}^{\textit{cur}}}{\dfrac{1}{2} \rho ^f U^2_{\infty } c} = \frac {\rho ^f U_{\infty } \overline {\varGamma }^{\textit{cur}}}{\dfrac{1}{2} \rho ^f U^2_{\infty } c} = \frac {2 \overline {\varGamma }^{\textit{cur}}}{U_{\infty } c} \propto \frac {2 \kappa\kern-1pt A_{h_{\!p}} U_{\infty } c}{ U_{\infty } c} = 2 \kappa\kern-1pt A_{h_{\!p}}. \end{equation}
The lift coefficient component can be further given as a function of non-dimensional curvature and heaving amplitude
 \begin{equation} \overline {C}_L^{\textit{cur}} = a_3 \kappa ^* A^*. \end{equation}
From the dimensional analysis, circulation due to bending curvature scales as
 $\kappa ^* A^*$
which captures the suction generated by cambering deformation.
The wake effect on the lift performance of the compliant membrane can be divided into the velocity-loss term in the free-stream direction and the wake-gradient term in the transverse direction. The velocity-loss term represents the lift reduction caused by the axial momentum deficit of the incoming wake over the leading-edge control volume. The circulation related to the velocity-loss effect is written as
 \begin{equation} \varGamma ^{vl} = \pi c (U_{\infty }-U_{\textit{eff}}) \alpha _{\textit{eff}} \propto \pi c (U_{\infty }-U_{\textit{eff}}) \frac {\dot {h}_{\!p}(t)}{U_{\textit{eff}}} = \frac {\pi c (U_{\infty }-U_{\textit{eff}}) 2 \pi f_{\!p} A_{h_{\!p}} \cos (2 \pi f_{\!p} t) }{U_{\textit{eff}}}. \end{equation}
Thus, the lift coefficient is further expressed as
 \begin{equation} \overline {C}_L^{vl} = \frac {\overline {L}^{vl}}{\dfrac{1}{2} \rho ^f U^2_{\infty } c} = \frac {\rho ^f U_{\textit{eff}} \overline {\varGamma }^{vl}}{\dfrac{1}{2} \rho ^f U^2_{\infty } c} \propto 4 \pi ^2 \frac {(U_{\infty }-U_{\textit{eff}})}{U_{\infty }} \frac {f_{\!p} c}{U_{\infty }} \frac {A_{h_{\!p}}}{c} = 4 \pi ^2 W f^* A^*. \end{equation}
The lift coefficient component related to the velocity-loss term
 $W={(U_{\infty }-U_{\textit{eff}})}/{U_{\infty }}$
can be rewritten as
 \begin{equation} \overline {C}_L^{vl} = a_4 W f^* A^*. \end{equation}
The lift coefficient component caused by the wake flow gradient in transverse direction
 $G=({c}/{U_{\infty }} )({\partial u}/{\partial z}) |_{z=0}$
can be defined as
 \begin{equation} \overline {C}_L^{wg} = a_5 \textit{GA}^* , \end{equation}
where the wake flow gradient
 $G$
is inherently a function of heaving frequency.
Similarly, the drag force of the compliant membrane is contributed to by heaving motion, structural flexibility and the wake effect, and is expressed as
 \begin{equation} \overline {C}_D^p=\underbrace {{\overline {C}_D}_0}_{\text{static}} + \underbrace {b_1 {f^*}^2 {A^*}^{2}}_{\text{quasi-steady}} + \underbrace {b_2 \frac {f^*}{f^*_c} {A^*}^2}_{\text{vortex shedding}} + \underbrace {b_3 \kappa ^* A^*}_{\text{curvature}} + \underbrace {b_4 W f^* A^*}_{\text{velocity loss}} + \underbrace {b_5 \textit{GA}^*}_{\text{wake gradient}} , \end{equation}
where
 $f^*_c$
represents the vortex-shedding frequency. The fitting coefficients
 $b_1$
,
 $b_2$
,
 $b_3$
,
 $b_4$
and
 $b_5$
are determined by the numerical simulation data. The derivation of each term for the drag coefficient is presented as follows. Previous studies on flapping plates found that the drag/thrust force can be scaled as
 $(f_{\!p} A_{h_{\!p}})^2$
(Gazzola et al. Reference Gazzola, Argentina and Mahadevan2014; Quinn et al. Reference Quinn, Moored, Dewey and Smits2014; Floryan et al. Reference Floryan, Van Buren, Rowley and Smits2017, Reference Floryan, Van Buren and Smits2018) based on the Theodorsen theory. The drag coefficient contributed by the quasi-steady term can be written as
 \begin{equation} \overline {C}_D^{qs} = b_1 {f^*}^2 {A^*}^{2}. \end{equation}
An empirical formula was proposed to describe the relationship between mean drag, vortex-shedding frequency and vibration amplitude under VIV (Song et al. Reference Song, Fu, Dai, Zhang and Chen2016). Herein, a similar expression is proposed to reflect the contribution of the heaving frequency relative to the vortex-shedding frequency and the heaving amplitude, which is given as
 \begin{equation} \overline {C}_D^{vs} = b_2 \frac {f^*}{f^*_c} {A^*}^2 , \end{equation}
where the frequency relationship between the heaving frequency
 $f^*$
and the critical vortex-shedding frequency
 $f^*_c$
reflects the impact of frequency synchronisation on drag enhancement. The drag forces caused by structure deformation and wake flows have expressions similar to those of lift forces, and are defined as
 \begin{equation} \overline {C}_D^{\textit{cur}} = b_3 \kappa ^* A^*, \quad \overline {C}_D^{vl} = b_4 W f^* A^*, \quad \overline {C}_D^{wg} = b_5 \textit{GA}^*. \end{equation}
The power coefficient averaged over time,
 $\overline {C}_{pow}^p$
, is defined by the sum of the lift force times the transverse velocity in a heaving period, divided by the pressure of the dynamics and the area of the structure (Upfal et al. Reference Upfal, Zhu, Handy-Cardenas and Breuer2025)
 \begin{equation} \overline {C}_{pow}^p = \frac {\dfrac {1}{T}\int _{t_0}^{t_0+T} L \boldsymbol{\cdot }\dot {h}_{\!p} \text{d}t}{0.5 \rho ^f U_{\infty }^3 b c} \propto \frac {\pi (\overline {L}-\overline {L}_{0}) f_{\!p} A_{h_{\!p}} }{0.5 \rho ^f U_{\infty }^3 b c} =\pi (\overline {C}_L - {\overline {C}_L}_0) f^* A^*. \end{equation}
Substituting (4.6) into (4.24), the time-averaged power coefficient is rewritten as
 \begin{equation} \overline {C}_{pow}^p=\underbrace {c_1 {f^*}^2 {A^*}^{2}}_{\text{quasi-steady}} + \underbrace {c_2 \sin \left ( \pi \frac {f^*}{f_0} \right ) f^* {A^*}^3}_{\text{heaving}} + \underbrace {c_3 \kappa ^* f^* {A^*}^2}_{\text{curvature}} + \underbrace {c_4 W {f^*}^2 {A^*}^{2}}_{\text{velocity loss}} + \underbrace {c_5 G f^* {A^*}^2}_{\text{wake gradient}} , \end{equation}
where
 $c_1$
,
 $c_2$
,
 $c_3$
,
 $c_4$
and
 $c_5$
are fitting coefficients of the power coefficient.
Using (4.6), (4.20) and (4.25), the predicted lift, drag and power coefficients are compared with simulation data in figure 10(a). The goodness of fit (
 $R^2$
), root mean square error (RMSE) and mean absolute error (MAE) are also evaluated. The Theodorsen-based and added-mass terms capture the dominant unsteady contributions to the aerodynamic forces at large flapping amplitudes. Nonlinear finite-amplitude effects and wake–membrane coupling are represented through the fitted coefficients and the additional curvature and wake terms. The coefficients
 $a_i$
,
 $b_i$
and
 $c_i$
are obtained via least-squares regression over the full set of simulated cases. The best-fit values, together with their
 $95\,\%$
confidence intervals, are reported in figure 10(b). For the isolated flexible configuration, the velocity-deficit and wake-gradient terms are omitted when determining the fitting coefficients, whereas for the tandem rigid case, the curvature terms are set to zero. As shown in figure 10(a), the proposed scaling relations predict the aerodynamic coefficients with good agreement, collapsing the data around the 1 : 1 reference line (black dashed). This demonstrates that the scaling relations provide a quantitative framework for decomposing and evaluating the relative contributions of heaving, flexibility and wake effects to overall propulsive performance.
(a) Prediction of lift, drag and power coefficients by proposed scaling relations and the goodness of fit, RMSE, MAE values for isolated flexible membrane (IF), tandem rigid (TR) plate and flexible (TF) membrane. (b) Comparison of fitting coefficients and
 $95 \,\%$
confidence intervals of lift, drag and power coefficients for tandem compliant membrane.

Decomposed lift coefficient components contributed by (a) heaving term related to added-mass effect, (b) curvature term, (c) velocity-loss term and (d) wake-gradient term during heaving motion in the
 $f^*$
–
 $A^*$
space.

The lift decomposition highlights a balance between transverse momentum supply and axial-deficit penalty. In the tandem flexible case, the quasi-steady and curvature-induced terms both contribute positively to lift. As shown in figure 11, their combined contribution delineates a boundary that closely tracks the transition from lift reduction to lift gain. Physically, the curvature term represents deformation-enabled suction enhancement, consistent with the stronger leading-edge suction observed at higher (
 $f^*,A^*$
) in figure 4(a). The velocity-loss term enters with a negative coefficient, reflecting the reduced axial momentum available in the incoming wake shown in figure 11(c). The wake-gradient term contributes positively (figure 11
d), consistent with transverse shear providing an additional source of circulation during heaving. The lift transition therefore occurs when kinematics- and flexibility-driven transverse forcing exceeds the axial momentum deficit imposed by the wake.
Figure 11 further clarifies how the heaving term with the modulation factor reorganises the lift budget. The decomposed heaving contribution changes sign across the vertical demarcation in (
 $f^*,A^*$
). On the low
 $f^*$
side, it is predominantly negative, whereas it becomes positive as
 $f^*$
approaches the cylinder-shedding frequency. Thus, the actuation exploits the incoming vortices in a two-way frequency lock-in manner. In this sense, the heaving term acts as a compact proxy for the phase relation between heaving and wake forcing. Its sign change marks the onset of constructive wake–heave interaction that precedes the higher-performance regimes.
For drag and power, the fitted coefficients in figure 10(b) indicate that the quasi-steady kinematic term provides the primary positive contribution, consistent with the increase in effective incidence induced by transverse velocity. Frequency lock-in tends to reduce the drag-associated penalty and improve the power balance. The curvature term increases lift by strengthening leading-edge suction, while simultaneously weakening adverse pressure gradients and reducing pressure drag. Membrane deformation also renders the profile more streamlined within the wake, reducing streamwise drag and mitigating transverse fluid damping, thereby improving power efficiency. By contrast, the velocity-loss term reduces the available aerodynamic loading and therefore contributes detrimentally to both drag and power coefficients. For the present reference compliance, the scaling relations suggest that passive deformation can either mitigate or amplify the wake-induced aerodynamic penalty, depending on wake exposure and frequency organisation. First, deformation amplifies suction and the surface pressure difference, helping compensate for the axial momentum deficit of the incoming wake. Second, when
 $f^*A^*$
is sufficiently large, frequency lock-in promotes wake reorganisation, enabling the downstream membrane to reshape the upstream shedding and further enhance performance.
4.4. Effect of wake flows
A comparison of aerodynamic performance between the tandem compliant membrane and its isolated counterpart is performed to examine wake flow effect. Three dimensionless variables, namely lift-gain
 $C_{\textit{LGF}}^w$
, drag-penalty
 $C_{\textit{DPF}}^w$
and lift-to-drag ratio factors
 $C_{\textit{LDF}}^w$
, are defined to evaluate relative aerodynamic force changes due to disturbed wake flows
 \begin{equation} C_{\textit{LGF}}^w = \frac {\overline {C}_L^{tm} - \overline {C}_L^{im}}{\overline {C}_L^{im}}, \quad C_{\textit{DPF}}^w = \frac {\overline {C}_D^{tm} - \overline {C}_D^{im}}{\overline {C}_D^{im}}, \quad C_{\textit{LDF}}^w = \frac {\overline {{C}_L^{tm}/{C}_D^{tm}} - \overline {{C}_L^{im}/{C}_D^{im}}}{\overline {{C}_L^{im}/{C}_D^{im}}} , \end{equation}
where
 $\overline {C}_L^{tm}$
,
 $\overline {C}_D^{tm}$
and
 $\overline {{C}_L^{tm}/{C}_D^{tm}}$
are the time-averaged lift, drag and lift-to-drag ratio of the tandem membrane. Here,
 $\overline {C}_L^{im}$
,
 $\overline {C}_D^{im}$
and
 $\overline {{C}_L^{im}/{C}_D^{im}}$
represent the performance for the isolated membrane case.
Contours of these three factors in percentage form in the
 $f^*$
–
 $A^*$
space are presented in figure 12(a–c). The black isolines with zero value are added to the contours, which separate the positive and negative contributions for these three factors. It is worth noting that, in TW mode, both lift-gain and drag-penalty factors reach positive values. In this situation, the wake plays a boosting role in improving the aerodynamics rather than hindering it. However, the compliant membrane suffers from the axial momentum deficit of the incoming wake by observing from the horizontal velocity profile comparison in figure 12(d). This velocity-loss effect in the free-stream direction degrades the aerodynamic performance, which is also validated by the negative decomposed velocity-loss terms in (4.6), (4.20) and (4.25). There must be some underlying mechanisms that can improve aerodynamic performance by modulating entire flow features of the coupled system. To confirm this idea, the flexibility role in improving performance is excluded by calculating the lift-gain factor between the tandem rigid configuration and the isolated flexible case
 $C_{\textit{LGF}}^r = ({\overline {C}_L^{tr} - \overline {C}_L^{if}})/{\overline {C}_L^{if}}$
. It is observed from figure 14(a) that the rigid structure can still produce better lift performance immersed in wake flows than the isolated flexible case in the TW mode regime. Thus, the TW between heaving motion and wake flows becomes the key point to enhance performance at large heaving amplitudes and frequencies.
Phase diagram of (a) lift-gain factor, (b) drag-penalty factor and (c) lift-to-drag ratio factor of the compliant membrane due to wake effect in percentage form. The isoline in black colour indicates zero value in contours. (d) Comparison of cycle-averaged horizontal velocity profile along vertical direction at
 $x/c$
= −0.03 in front of the membrane leading edge between isolated and tandem compliant membranes for four flapping modes.

To further analyse the flow characteristics and aerodynamic forces influenced by wake flows, two representative cases of the tandem compliant membrane are selected in both the negative and positive regions of the lift-gain factor contour shown in figure 12(a). The cycle-averaged pressure coefficient distribution, instantaneous aerodynamic forces and
 $Y$
-vorticity contours are compared for isolated and tandem compliant membranes in figure 13. It can be seen from figure 13(c) that low-momentum wake flows generated from the upstream cylinder are merged with the vortices around the membrane. This axial momentum deficit of the incoming wake results in a reduced suction effect near the leading edge of the compliant membrane, as shown in figures 13(a) and 13(g). As a result, the tandem compliant membrane generates degraded aerodynamic forces compared with the isolated case at
 $(f^*$
,
 $A^*)$
= (0.1, 0.05), as plotted in figure 12.
Comparison of (a,d) cycle-averaged pressure coefficient distribution along the membrane chord, (b,e) lift and drag coefficients, (c, f) instantaneous
 $Y$
-vorticity during downstroke and (g,h) time-varying pressure coefficient difference of upper and lower surfaces between the isolated and tandem configurations at (a,b,c,g)
 $(f^*$
,
 $A^*)$
= (0.1, 0.05) and (d,e, f,h)
 $(f^*$
,
 $A^*)$
= (0.6, 0.25).

The tandem compliant membrane exhibits enhanced suction near the leading edge at the heaving top position and weakened positive pressure difference during downstroke at
 $(f^*$
,
 $A^*)$
= (0.6, 0.25), compared with its isolated counterpart, as depicted in figures 13(a) and 13(h). The overall lift and drag forces of the tandem case plotted in figure 13(e) are improved. The decomposed FMD modes in figure 7(b) and the instantaneous vorticity contours in figure 13(f) reveal that the heaving motion of the compliant membrane inversely interacts back to the upstream cylinder, altering its vortex-shedding pattern. To understand this two-way frequency lock-in phenomenon, we calculate the cross-correlation between the heaving motion and the vorticity field, as well as the lift fluctuation of the cylinder to analyse how the heaving motion inversely affects wake flows.
The cross-correlation
 $R_{h_{\!p} \textrm {-} \omega _y^{tc}}$
of the discrete time signals of heaving motion
 $h_{\!p}(t_n)$
and
 $Y$
-vorticity
 $\omega _y^{tc}(t_{n})$
is defined as
 \begin{equation} R_{h_{\!p} \textrm {-} \omega _y^{tc}}(m) = \frac {1}{N} \sum _{n=0}^{N-m-1} h_{\!p}(t_n) \omega _y^{tc}(t_{n+m}) \quad \quad 0 \leqslant m \leqslant N-1 , \end{equation}
where
 $N$
represents the data samples. We selected 4096 samples with 8 heaving cycles at a sampling rate of
 $f_s$
= 577 Hz and the
 $Y$
-vorticity values behind the cylinder to obtain the maximum cross-correlation coefficient, which is displayed in figure 14(b). The root-mean-square (r.m.s.) value of the lift fluctuation for the upstream cylinder shown in figure 14(c) is defined as
 \begin{equation} {C_{L}^{{tc}^{\prime }}}^{\textit{rms}} = \sqrt {\frac {1}{N} \sum _{n=1}^{N}\big(C_L^{tc} - \overline {C}_L^{tc}\big)^2}. \end{equation}
In figures 14(b) and 14(c), a white line representing the value of the zero lift-gain factor of the tandem compliant membrane is added to the plot to examine the positive contribution of the TW. It is found that when the compliant membrane moves beyond the white line, the vortex structure shed from the upstream cylinder is closely correlated with the heaving motion downstream. Large lift fluctuations of the cylinder are noticed on the right side of the critical lift-gain boundary. This phenomenon indicates that vortices shed from the cylinder lock into the heaving motion, thereby creating extra suction and enhancing aerodynamic forces. Under these conditions, the wake-induced contribution changes from a performance penalty to a wake-assisted loading mechanism in the present configuration. This analogy is consistent with wake-mediated locomotion, but the quantitative conclusion is restricted to the present two-dimensional model (Fish & Lauder Reference Fish and Lauder2006; Chen et al. Reference Chen, Fei, Chen, Chi and Yang2016).
(a) Lift-gain factor between the tandem rigid configuration and the isolated flexible case, (b) maximum cross-correlation coefficient between heaving motion and vortex shedding from upstream cylinder and (c) r.m.s. value of the lift fluctuation of the upstream cylinder influenced by downstream heaving compliant membrane. The isoline in white colour represents the zero lift-gain factor value of the tandem compliant membrane. The isoline in black colour denotes the zero value of the lift-gain factor of the tandem rigid structure.

Phase diagram of (a) cycle-averaged power coefficient in the
 $f^*$
–
 $A^*$
space, (b) propulsive efficiency of lift and (c) propulsive efficiency of drag as a function of dimensionless heaving amplitude and frequency for tandem compliant membrane.

4.5. Propulsive performance and mode transition
Aquatic and aerial animals can move efficiently in disturbed wakes by appropriately adjusting their flapping kinematics and exploiting coherent vortex patterns (Deng et al. Reference Deng, Shao and Yu2007; Maertens et al. Reference Maertens, Gao and Triantafyllou2017). Depending on the demands of movement, these animals conserve energy for cruising, or generate large propulsive forces during rapid manoeuvres. These flexible biological propulsion methods provide useful physical principles for the design of flapping vehicles. Within the present
 $Ae=8163$
dataset, the fitted power relation proposed in (4.25) indicates that large-amplitude and high-frequency heaving, together with deformation-induced curvature are associated with increased energetic cost. The wake-deficit term modifies the fitted power balance by reducing the local dynamic pressure available to the membrane. This statement is a diagnostic interpretation of the present simulations, not a general conclusion for biological locomotion. In systems with different membrane stiffness, mass ratio, gait, Reynolds number or three-dimensional morphology, the same terms and coefficients would have to be re-evaluated.
Figure 15(a) quantifies this energy trade-off over the
 $f^*$
–
 $A^*$
space. The compliant membrane consumes low power to maintain propulsion when it moves fully in wake flows or asynchronously with the vortex-shedding frequency. Meanwhile, it produces unfavourable aerodynamic forces even lower than the non-heaving isolated flexible case, as shown in figure 2. This type of propulsion strategy is not conducive to manoeuvrability, but is beneficial for energy saving, which is very suitable for efficient long-distance migration. To evaluate propulsion strategies for different locomotion demands, we further consider the propulsive efficiencies of lift and drag, which are given as
 \begin{equation} \eta _{C_L} = \frac {\overline {C}_L}{\overline {C}_{pow}}, \quad \quad \eta _{C_D} = \frac {\overline {C}_D}{\overline {C}_{pow}}. \end{equation}
Floryan et al. (Reference Floryan, Van Buren, Rowley and Smits2017) and Lauber et al. (Reference Lauber, Weymouth and Limbert2023) pointed out that the propulsion efficiency of compliant membranes is proportional to the flapping amplitude and frequency. In figures 15(b) and 15(c), the propulsive efficiencies of the lift and drag are collapsed onto inverse proportional functions with an overall downward trend. The optimal efficiencies occur in the WD and FD-LR regimes, whereas efficiency drops rapidly once the system enters the TW regime. In this regime, the lift is enhanced substantially (figure 2), but at the expense of sharply increased power input (figure 15
a). Rapid manoeuvres require energetic escalation, approximately scaling with
 $(f^* A^*)^2$
to overcome the low-momentum wake.
Comparison of (a,b) space–time contours of propulsive power coefficient and (c,d) frequency spectrum of propulsive power coefficient along the length of heaving structure between tandem flexible configuration and its rigid counterpart at (a,c)
 $(f^*,A^*)=(0.2,0.15)$
and (b,d)
 $(f^*,A^*)=(0.5,0.25)$
.

As discussed in § 4.1, WIV content can draw the response toward the shedding band at low heaving actuation intensity. The membrane response locks into the heaving frequency and ultimately reorganises the wake through two-way frequency lock-in at high intensity. To expose this energetic mechanism, figure 16 compares the chordwise distribution of the time-varying propulsive power and its spectral content between the flexible membrane and the rigid counterpart for two representative propulsive conditions. In the fully wake-immersed case, the flexible membrane requires more negative power than the rigid plate, as shown in figure 16(a). It indicates that compliance increases the work needed to sustain heaving when the wake deficit dominates. The spectrum plotted in figure 16(c) reveals an additional peak associated with wake shedding besides the imposed heaving frequency. The result shows that flexibility redistributes absorbed energy into wake-driven content rather than into constructive heave frequency-locked loading. In this regime, vortices impinging on the upper surface during downward bending weaken suction and reduce lift, consistent with the lift-reduction behaviour identified earlier.
Comparison of relative mode contributions
 $\sigma _m/{\sum _{m=1}^{5}\sigma _m}$
and standard deviation (std) of decomposed mode coefficients
 $\sigma _m$
for the first three structural modes to the membrane deformation.

In contrast, the power input increases but becomes more coherently channelled into heave-induced deformation and pressure loading in intermittent wake-exposure conditions shown in figure 16(b), which facilitates lift gain. This is precisely the setting where structural flexibility ceases to be a passive follower of wake forcing and instead acts as a passive compliance pathway that redirects the input work into coherent deformation and pressure loading. The membrane flexibility selectively amplifies the membrane deformation that strengthens suction by reorganising the flapping energy at the heaving frequency. This provides the energetic underpinning of the FD-LG regime and sets the conditions for the subsequent two-way frequency lock-in. The role of near-resonant alignment identified here connects naturally to recent membrane-wing studies in uniform inflow. In a heaving membrane, analytical modelling predicts that thrust/drag characteristics and wake topology change markedly as the forcing frequency approaches the estimated fluid-loaded modal frequency of the membrane, with the transition frequency shifting with compliance and fluid damping (Tzezana & Breuer Reference Tzezana and Breuer2019). Complementing this, unsteady membrane-wing theory shows that the lift response can increase abruptly as the reduced frequency approaches the fluid-loaded resonance, and that mode dominance can switch across successive frequency intervals (Tiomkin & Jaworski Reference Tiomkin and Jaworski2022). Our wake-forced configuration extends these ideas by introducing a competing external frequency
 $f^w$
and a deficit inflow. The key point is that the performance-improving state does not require broadband deformation. Rather, it is associated with a selective amplification of a low-order mode when
 $f_{\!p}$
approaches
 $f_1$
, which increases curvature and strengthens the pressure difference between membrane surfaces, thereby creating a robust pathway toward mode transition under disturbed inflow.
Figure 17 then links this energetic redistribution to modal modulation. The relative contributions of the first three structural modes together with their mode coefficients reveal that mode transition is not a generic increase in deformation, but a structured retuning of the vibration content. Here, the relative mode contribution measures how much each mode accounts for the total deformation energy over a cycle, thus indicating which structural shape dominates the response. The standard deviation of a decomposed modal coefficient quantifies the cycle-to-cycle fluctuation amplitude of that mode, and therefore serves as a direct proxy for how strongly the corresponding deformation is expressed and modulated in time. Across flapping modes, the membrane can suppress wake-driven components while selectively amplifying the targeted low-order mode when
 $f_{\!p}$
approaches
 $f_1$
. In the TW regime, this manifests as both a dominant share of the low-order mode and an increased coefficient fluctuation, indicating that the associated deformation is not only prevalent but also selectively strengthened. This modal retuning increases curvature, enlarges the surface pressure difference, and thereby reinforces the aerodynamic work-exchange pathway that feeds back to the wake.
Mode classification of the heaving compliant membrane in the cylinder wake. Regime map in the
 $f^*$
–
 $A^*$
parameter space showing WD, FD-LR, FD-LG and TW, with the fitted lift-transition boundary
 $A^*=\gamma (f^*)^{- {1}/{n}}+\delta$
indicated by a blue dashed line. The right panel summarises the identification criteria: WD (
 $f^m \approx f^w$
, lift reduction), FD-LR (
 $f^m \approx f_{\!p}$
, lift reduction), FD-LG (
 $f^m \approx f_{\!p}$
, lift gain) and TW (
 $f^c \approx f_{\!p}$
with near-resonant amplification
 $f_1 \approx f_{\!p}$
). The bottom schematic highlights the transition from wake-following to wake-reshaping responses through wake-deficit compensation, curvature, pressure-difference enhancement and two-way frequency lock-in.

Figure 18 summarises the flapping-mode phase diagram of the heaving compliant membrane in the
 $f^*$
–
 $A^*$
parameter space. Four distinct flapping modes are represented using labels with different shapes and colours. Relative to the rigid heaving structure behind the cylinder, the phase diagram is divided into two regimes: a lift-reduction regime represented by filled labels and a lift-gain regime indicated by open symbols. The blue boundary line in figure 18, separating the lift-reduction and lift-gain regimes, is described by the empirical relation
 \begin{equation} A^*=\gamma (f^*)^{-\frac {1}{n}}+\delta , \end{equation}
where
 $\gamma$
,
 $n$
and
 $\delta$
are fitting coefficients. The fitted coefficients are
 $\gamma =1.1458$
,
 $n=7.1941$
and
 $\delta =-1.1666$
, obtained from nine points along the critical boundary in figure 5(a), yielding a coefficient of determination
 $R^2=0.9961$
. This indicates that the empirical boundary accurately captures the onset of flapping-dominated performance across the explored parameter space for the present gap ratio
 $g^*=0.5$
. The form of (4.30) reflects a balance between the transverse momentum supplied by heaving and the axial momentum deficit of the incoming wake. Thus, the flexible heaving membrane achieves improved lift performance in wake flows at sufficiently high heaving amplitudes and frequencies compared with its rigid counterpart.
Following the transition arrow in figure 18, the coupled system transitions from wake-following to wake-reshaping responses through two coupled steps. First, the membrane transitions from WD mode (lift reduction) to near-resonant mode (lift gain) when the transverse induced velocity from heave compensates the leading-edge wake deficit. Flexibility becomes beneficial by producing extra suction through curvature without much additional drag (FD-LG). Second, TW emerges at sufficiently large heaving energy input. The downstream membrane becomes synchronised with the cylinder-shedding response and modifies the upstream shedding through hydrodynamic feedback, reorganising the upstream vortex-shedding pattern (TW). These two steps complete a feedback loop that deficit compensation and mode-selective near-resonant amplification increase curvature, reshape the pressure distribution, strengthen lift and ultimately alter wake organisation in a two-way frequency lock-in manner.
It is also worth noting that, even in uniform inflow, optimal propulsion does not always coincide with exact resonance. Fully coupled simulations of compliant membranes report that thrust and efficiency optima can occur below resonance, reflecting a balance between beneficial deformation and deformation-induced losses (Zhang et al. Reference Zhang, Gao and Zhu2026). In the present wake-modulated setting, the near-resonant condition
 $f_{\!p} \approx f_1$
should be interpreted as an effective modal-selection mechanism that promotes curvature and pressure loading, rather than a universal predictor of optimal efficiency. The transition framework offers a mechanistic explanation for adaptive bat flight in disturbed wakes and yields actionable design guidelines for flexible unmanned vehicles. For endurance-critical missions, air vehicles should operate in a wake-riding regime (WD/FD-LR). They employ low-amplitude, low-frequency kinematics to exploit wake-induced power reduction while accepting limited manoeuvrability. For agility-critical tasks such as obstacle avoidance or rapid acceleration in cluttered environments, the control system should drive a deliberate mode transition by increasing
 $f^*$
and
 $A^*$
beyond the critical boundary. It promotes heave–wake lock-in and enables mode-selective deformation amplification. In the high-performance regime, flexible appendages should be designed to support targeted low-order modal amplification near the actuation frequency, thereby maximising curvature-enabled suction and facilitating two-way coupling that reshapes the upstream wake.
The present results are obtained for a two-dimensional membrane in the wake of a stationary circular cylinder at fixed Reynolds number and gap ratio, with harmonic heaving imposed at the supported edges and no pretension. Consequently, the identified mode boundaries and the prevalence of TW should be interpreted within this specific configuration and parameter range. The gap ratio is expected to modulate wake recovery at the membrane location. Smaller gaps strengthen wake forcing and favour WD responses, whereas larger gaps weaken wake forcing and shift the critical boundary toward flapping-dominated behaviour at lower
 $f^*A^*$
. In particular, three-dimensional effects are expected to weaken exact frequency lock-in and may shift regime boundaries near transition, although the dominant two-dimensional mode structures are likely to remain representative in coherent periodic regimes. A more detailed discussion of three-dimensional effects is presented in Appendix D. Moreover, the near-resonant condition considered here is based on an estimated natural frequency for a fluid-loaded membrane. Changes in membrane tension state, material anisotropy and fluid damping can shift this frequency and alter which structural mode is preferentially amplified, as highlighted in prior membrane-wing analyses (Tzezana & Breuer Reference Tzezana and Breuer2019; Tiomkin & Jaworski Reference Tiomkin and Jaworski2022). Finally, the upstream disturbance is restricted to a canonical Kármán street. More complex inflows, such as multiple wakes, broadband gust spectra or time-varying spacing, may introduce additional competing time scales beyond (
 $f^w,f_{\!p},f_1$
). These limitations do not alter the central findings regarding deficit compensation, mode-selective amplification and TW within the present configuration. Extending the analysis to three-dimensional configurations, controlled gap-variation studies and experiments would provide a natural pathway to validate these mechanisms and refine the quantitative regime boundaries.
5. Conclusions
In this study, we have numerically investigated a two-dimensional compliant membrane executing prescribed heave in the near wake of a stationary circular cylinder at
 $\textit{Re}$
= 3000. It aimed to separate and then reconnect the roles of wake forcing, actuation and passive compliance in setting mean forces, power and wake organisation. Over the explored
 $f^*$
–
 $A^*$
space, the coupled system exhibited regime-level transition from wake-following responses to wake-reshaping propulsion. This mode transition was controlled by the balance between wake-momentum deficit and heave-supplied transverse momentum, and reinforced by mode-selective deformation amplification. Our main findings are as follows.
-
(i) Flapping-mode classification and regime map. Using dominant frequency ratios and spectral energy concentration, four distinct flapping modes were classified from the mode phase diagram, namely WD, FD-LR, FD-LG and TW. The resulting regime map highlighted a progression from wake-following responses to wake-modulating responses within the present parameter range as heave energy increases, which was governed by an empirical equation
$A^*=\gamma (f^*)^{-{1}/{n}}+\delta$
. -
(ii) Two-step mechanism for performance transition. The propulsive transition occurred through two coupled steps. First, the membrane crossed from lift reduction to lift gain when heave-induced transverse velocity compensated the leading-edge wake deficit. In the FD-LG regime, compliance became beneficial by generating extra suction through curvature with limited additional drag. Second, at sufficiently large heaving input, a TW feedback loop emerged. The membrane not only locked its response to the actuation but also reorganised upstream shedding (TW), completing a wake–structure coupling pathway that amplified curvature, strengthened the pressure difference and reshaped wake topology.
-
(iii) Two-way lock-in and mode-selective amplification. In the TW regime, the dynamics was characterised by a triadic frequency alignment, where cylinder shedding locked onto the actuation while the first structural mode was near-resonantly amplified (
$f^c \approx f_{\!p}$
with
$f_1 \approx f_{\!p}$
). This TW selectively enhanced low-order deformation and intensified leading-edge suction. -
(iv) Scaling relations. Building on the identified regimes, scaling relations for mean lift, drag and power were derived, decomposing contributions from quasi-steady motion, added mass with lock-in modulation, passive curvature, wake-momentum deficit and transverse shear. The resulting framework provided a compact diagnostic collapse for the simulated cases and quantified the relative roles of heaving, curvature and wake terms.


These conclusions are restricted to the present two-dimensional configuration with fixed Reynolds number and gap ratio, harmonic heave and no pretension. The near-resonant condition discussed here is based on an estimated fluid-loaded natural frequency, rather than a fixed in vacuo structural eigenfrequency. As shown in Appendix E, this estimate depends on both structural and added-mass contributions and therefore on the mass ratio. For the present case with
 $m^*$
= 25.5, it is used as an indicator of frequency alignment and mode-selective amplification within the explored parameter range. For much larger mass ratio, the estimate approaches the true structural frequency. For much smaller mass ratio, it should be interpreted more cautiously as an effective coupled frequency. Accordingly, the condition
 $f_1 \approx f_{\!p}$
is regarded as a near-resonant modal alignment, rather than strict resonance of an uncoupled structure. Three-dimensional effects may weaken exact frequency lock-in and shift regime boundaries, while variations in tension, anisotropy, aeroelastic number and damping may alter the effective natural frequencies governing modal selection. Nevertheless, the identified mechanisms such as deficit compensation, mode-selective amplification and TW provide a physically grounded framework for interpreting compliant-wing propulsion in disturbed inflows. Extending the present analysis to three-dimensional configurations, variable gap ratios and experimental validation constitutes a natural next step toward predictive design of compliant lifting surfaces in complex flow environments.
Supplementary material
Supplementary material is available at https://doi.org/10.1017/jfm.2026.11895.
Acknowledgements
The authors acknowledge the High Performance Computing (HPC) Platform at Xi’an Jiaotong University. R.K.J. acknowledges the support of the University of British Columbia.
Funding
This work was supported by the National Natural Science Foundation of China (NSFC) (Grant Nos. 52575639, 12202362, 52475605 and U2441288), the China Postdoctoral Science Foundation (Grant No. 2023M732798), the Open Fund of the State Key Laboratory for Manufacturing Systems Engineering, Xi’an Jiaotong University (Grant No. sklms2023014), and the Natural Sciences and Engineering Research Council of Canada (NSERC).
Declaration of interests
The authors report no conflict of interest.
Appendix A. Variational formulation of governing equations
The fluid loads are calculated by the variational formulation of the Navier–Stokes equations in the fluid domain
 $\varOmega ^f$
at the time instant
 $t^{n+1}$
, which is given as
 \begin{align} \int _{\varOmega ^f(t^{n+1})} \rho ^f \left ( \partial _t {\boldsymbol{u}}^{f,n+\alpha ^f_m}_h \bigg |_{\boldsymbol{\chi }} + ({\boldsymbol{u}}^{f,n+\alpha ^f}_h - \boldsymbol{u}^{m,n+\alpha ^f}_h) \boldsymbol{\cdot }\boldsymbol{\nabla }{\boldsymbol{u}}^{f,n+\alpha ^f}_h \right ) \boldsymbol{\cdot }\boldsymbol{\psi }^f_h {\textrm {d}\varOmega } \nonumber \\ +\int _{\varOmega ^f(t^{n+1})} {\boldsymbol{\sigma }}^{f,n+\alpha ^f}_h:\boldsymbol{\nabla }\boldsymbol{\psi }^f_h {\textrm {d}\varOmega } \nonumber \\ + \sum _{e=1}^{n^f_{el}} \int _{\varOmega ^e} \tau _m (\rho ^f ({\boldsymbol{u}}^{f,n+\alpha ^f}_h-\boldsymbol{u}^{m,n+\alpha ^f}_h) \boldsymbol{\cdot }\boldsymbol{\nabla }\boldsymbol{\psi }^f_h+\boldsymbol{\nabla }q_h) \boldsymbol{\cdot }\boldsymbol{\mathcal{R}}_m {\textrm {d}\varOmega ^e} \nonumber \\ -\int _{\varOmega ^f(t^{n+1})} q_h (\boldsymbol{\nabla }\boldsymbol{\cdot }{\boldsymbol{u}}^{f,n+\alpha ^f}_h) {\textrm {d}\varOmega } +\sum _{e=1}^{n^f_{el}} \int _{\varOmega ^e} \boldsymbol{\nabla }\boldsymbol{\cdot }\boldsymbol{\psi }^f_h \tau _c \boldsymbol{\mathcal{R}}_c {\textrm {d}\varOmega ^e} \nonumber \\ -\sum _{e=1}^{n^f_{el}} \int _{\varOmega ^e} \tau _m \boldsymbol{\psi }^f_h \boldsymbol{\cdot }(\boldsymbol{\mathcal{R}}_m \boldsymbol{\cdot }\boldsymbol{\nabla }{\boldsymbol{u}}^{f,n+\alpha ^f}_h) {\textrm {d}\varOmega ^e} - \sum _{e=1}^{n^f_{el}} \int _{\varOmega ^e} \boldsymbol{\nabla }\boldsymbol{\psi }^f_h : (\tau _m \boldsymbol{\mathcal{R}}_m \otimes \tau _m \boldsymbol{\mathcal{R}}_m) {\textrm {d}\varOmega ^e} \nonumber \\ = \int _{\varOmega ^f(t^{n+1})} \boldsymbol{b}^f(t^{n+\alpha ^f}) \boldsymbol{\cdot }\boldsymbol{\psi }^f_h {\textrm {d}\varOmega } + \int _{\varGamma ^f_N} \boldsymbol{h}^f \boldsymbol{\cdot }\boldsymbol{\psi }^f_h {\textrm {d} \varGamma } , \end{align}
where
 $\boldsymbol{u}^{f}_h$
and
 $\boldsymbol{u}^{m}_h$
denote fluid and mesh velocities. The integration coefficients of the generalised-
 $\alpha$
algorithm are defined as
 $\alpha ^f$
and
 $\alpha ^f_m$
. Unsteady fluid flows with a density of
 $\rho ^f$
produce body forces
 $\boldsymbol{b}^f$
on immersed structures. Here,
 $\boldsymbol{\psi }^f_h$
and
 $q_h$
are weighting functions of the fluid velocity
 $\boldsymbol{u}^{f}_h$
and pressure
 $p_h$
in the Petrov–Galerkin finite-element method. The second line represents the Galerkin term for the viscous stress term
 ${\boldsymbol{\sigma }}^{f}_h$
. The Neumann condition
 $\boldsymbol{h}^f$
is applied at the boundary of the computational fluid domain and
 $\boldsymbol{\mathcal{R}}_c$
and
 $\boldsymbol{\mathcal{R}}_m$
denote the element-wise residuals of the continuity and momentum equations. The stabilisation parameters for these two equations are represented by
 $\tau _c$
and
 $\tau _m$
.
A schematic of the predictor-corrector procedure for ALE fluid solver and flexible multibody solver coupling via NIFC.

The kinematic flapping motion of compliant membranes is described by the flexible multibody structure equations. The variational form of the structure equation for the
 $i$
th multibody component
 $\varOmega ^s_i$
can be given as
 \begin{align} \int _{t_n}^{t^{n+1}} \left ( \int _{\varOmega ^s_i} \rho ^s \frac {\partial ^2 \boldsymbol{d}^s_h}{\partial t^2} \boldsymbol{\cdot }\boldsymbol{\psi }^s_h \text{d}\varOmega + \int _{\varOmega ^s_i} \boldsymbol{P}^s : \boldsymbol{\nabla } \boldsymbol{\psi }^s_h \text{d}\varOmega \right ) \text{d} t \nonumber \\ = \int _{t_n}^{t^{n+1}} \left ( \int _{\varOmega ^s_i} \boldsymbol{b}^s \boldsymbol{\cdot }\boldsymbol{\psi }^s_h \text{d}\varOmega + \int _{\varGamma ^s_i} \boldsymbol{h}^s \boldsymbol{\cdot }\boldsymbol{\psi }^s_h \text{d}\varGamma \right ) \text{d} t , \end{align}
where the material density and the displacement of the compliant membrane are defined as
 $\rho ^s$
and
 $\boldsymbol{d}^s_h$
. The first Piola–Kirchhoff stress tensor and the structural body force are denoted by
 $\boldsymbol{P}^s$
and
 $\boldsymbol{b}^s$
. Herein,
 $\boldsymbol{\psi }^s_h$
and
 $\boldsymbol{h}^s$
represent weighting functions of structure displacement and the Neumann condition of the
 $i$
th multibody structure.
A partitioned iterative scheme based on the proposed NIFC approach is employed to couple the fluid and structure equations, which is illustrated in figure 19. In the predictor–corrector process, the predicted structural displacements and the corrected fluid forces are solved in an iterative manner. In the first step of the coupling procedure, the structural displacements at each structural node are calculated from the flexible multibody structural equations. Then, structural displacements are transferred to the surface nodes in the fluid domain along the non-matching fluid–structure interface by using the RBF method. The continuity condition of the displacement and velocity between two domains should be satisfied to avoid gap or overlap of the two types of meshes, which are given as
 \begin{equation} \boldsymbol{d}^{s}=\boldsymbol{d}^{m} = \boldsymbol{d}^f \quad \forall \boldsymbol{x}^s \in \varGamma ^{fs}, \end{equation}
 \begin{equation} \boldsymbol{u}^{f}= \boldsymbol{u}^{m} = \boldsymbol{u}^s \quad \forall \boldsymbol{x}^f \in \varGamma ^{fs}. \end{equation}
In the third step, the meshes in the fluid domain are updated following the continuity condition of the body-fitted meshes on the surface through the RBF remeshing approach. Then, the fluid forces acting on the compliant membranes are computed from the Navier–Stokes equations for the remeshed configuration. In the last step, the fluid forces are corrected by the NIFC scheme to achieve numerical stability under large added-mass effects. The corrected fluid forces are transferred to the structural surfaces by using the RBF method. The continuity of the shear stress should be satisfied along the interface
 $\varGamma ^{fs}_i$
, which is given as
 \begin{equation} \int _{\boldsymbol{\varphi }^s(\gamma ,t)}{\boldsymbol{\sigma }}^f(\boldsymbol{x}^f,t) \boldsymbol{\cdot }\boldsymbol{n}^f \text{d}\varGamma +\int _{\gamma } \boldsymbol{P}^s(\boldsymbol{X}^s,t) \boldsymbol{\cdot }\boldsymbol{n}^s \text{d}\varGamma =0 \quad \quad \forall \gamma \in \varGamma ^{fs}_i , \end{equation}
where
 $\boldsymbol{\varphi }^s(\gamma ,t)$
denotes the associated fluid domain corresponding to the
 $i$
th structure at time instant
 $t$
. The unit normal vectors of the interface in the fluid and structural domains are defined as
 $\boldsymbol{n}^f$
and
 $\boldsymbol{n}^s$
.
Illustration of (a) flexible plate geometry and (b) pitching motion applied at leading edge.

Appendix B. Experimental validation
B.1. Flapping dynamics of pitching flexible plate
A thin flexible plate immersed in uniform flows is considered for validation purposes. A pitching motion is applied along the leading edge of the plate. The propulsive performance of the flapping plate is simulated by our high-fidelity FSI solver and compared with the experimental measurements. The geometry and sizes of the thin plate are built from the water tunnel experiment performed by Van Buren et al. (Reference Van Buren, Floryan, Brunner, Senturk and Smits2017), which is shown in figure 20. The width of the plate is
 $b$
= 0.1 m and the mean chord length is set to
 $c$
= 0.1 m. The concave angle at the trailing edge is
 $\varPhi$
=
 $45^\circ$
. The thickness is
 $h$
= 2.54
 $\times$
 $10^{-3}$
m and the Young’s modulus is
 $E^s$
= 3.1
 $\times$
 $10^9$
N m−
 $^2$
. The dimensionless parameters that govern the flapping dynamics are set to
 $\textit{Re}$
= 10000 and
 $m^*$
= 0.03. The amplitude of the pitching angle is given as
 $A_{\theta _{\!p}}$
=
 $9^\circ$
. The flapping dynamics of the flexible plate is simulated within the range of
 $St \in [0.12, 0.76]$
. A comparison of the time-averaged thrust coefficient
 $\overline {C}_T$
and the propulsive efficiency
 $\eta _F$
between the experimental data and our simulation results is presented in figure 21. The flapping dynamics of the flexible plate is well predicted by our FSI solver.
Comparison of (a) time-averaged thrust coefficient and (b) propulsive efficiency between experimental results and present simulation data.

B.2. Flapping dynamics of thin flexible plate behind a circular cylinder
The flapping dynamics of a thin plate attached to a circular cylinder is simulated by our FSI solver. A comparison with the benchmark data of FSI-III set-up is performed for validation purposes. The ratios of the thickness and length of the flexible plate relative to the cylinder diameter
 $D$
are 0.2 and 3.5, respectively. In the FSI-III set-up, the Reynolds number and mass ratio are given as
 $\textit{Re}$
= 200 and
 $m^*$
= 1.0. A schematic of the computational fluid domain is plotted in figure 22(a). We apply a parabolic velocity profile along the inlet boundary. Traction-free boundary condition is applied along the outlet boundary. The slip wall condition is employed on the sidewalls and the no-slip wall condition is applied on the plate surface. A comparison of plate tip displacements along the vertical and horizontal directions between the reference data (Turek & Hron Reference Turek and Hron2006) and our simulation results is presented in figure 22(b). It can be noticed that the flapping dynamics of the plate is well captured by our FSI solver.
(a) Schematic of computational fluid domain and (b) time-varying plate tip displacements along the vertical and horizontal directions.

Appendix C. Convergence study
C.1. Mesh convergence
Before investigating the flapping dynamics of compliant membranes in disturbed flows, a mesh convergence study is performed to determine appropriate spatial resolutions. Three mesh sets (M1, M2 and M3) are constructed for both the fluid and structural domains. A representative case with moderate flapping amplitude
 $A^*=0.25$
and frequency
 $f^*=0.3$
is selected for this assessment. The computational fluid domain is discretised using 84 995, 153 641 and 211 679 unstructured triangular elements for M1, M2 and M3, respectively. The corresponding dimensionless wake-region mesh sizes relative to the membrane chord are 0.0036, 0.0025 and 0.0011. The compliant membrane is discretised with 30, 50 and 80 elements for M1, M2 and M3, respectively. A comparison of the aerodynamic performance metrics is summarised in table 1. The M3 results are taken as the reference for computing relative percentage differences. The maximum deviation between M1 and M3 exceeds
 $5\,\%$
in the r.m.s. drag fluctuation. In contrast, the differences between M2 and M3 remain below
 $1\,\%$
for all reported force metrics. Further comparisons of the time-averaged pressure coefficient distribution along the membrane, the time-varying mid-span displacement, the lift coefficient history and its frequency spectrum are presented in figure 23. The coupled dynamics predicted by M2 closely matches that of M3. Therefore, M2 is adopted for subsequent simulations as it provides adequate accuracy with reduced computational cost.
Mesh convergence of a heaving compliant membrane immersed in the wake flows of a stationary circular cylinder at
 $A^*$
= 0.25 and
 $f^*$
= 0.3. The percentage discrepancies in the brackets are calculated with respect to the finest mesh M3.

Table 1. Long description
A table comparing aerodynamic performance metrics across three mesh sets for a heaving compliant membrane in wake flows. The table has 6 rows and 4 columns. The columns are labeled Mesh, M1, M2, and M3. The rows are labeled Mean lift, Mean drag, Mean lift-to-drag ratio, The r.m.s. lift fluctuation, and The r.m.s. drag fluctuation. Row 1: Mesh, M1, M2, M3. Row 2: Mean lift, 1.9904 (1.2154 percent), 1.9680 (0.0763 percent), 1.9665. Row 3: Mean drag, 0.3281 (0.6442 percent), 0.3279 (0.5828 percent), 0.3260. Row 4: Mean lift-to-drag ratio, 6.0664 (0.5675 percent), 6.0018 (0.5036 percent), 6.0322. Row 5: The r.m.s. lift fluctuation, 2.0333 (3.2814 percent), 1.9662 (0.1270 percent), 1.9687. Row 6: The r.m.s. drag fluctuation, 0.2950 (5.8106 percent), 0.2764 (0.8608 percent), 0.2788. The table provides a detailed comparison of the aerodynamic performance metrics for three different mesh sets, highlighting the relative percentage differences with respect to the finest mesh M3.
C.2. Time-step size convergence
To assess the temporal accuracy of the coupled ALE–FSI solver, a time-step size convergence study is performed for a representative wake–membrane interaction case. The test case is selected at
 $A^*$
= 0.25 and
 $f^*$
= 0.3 and the spatial discretisation adopts the mesh set M2 for the parametric study. Three dimensionless time-step sizes are considered, denoted as T1, T2 and T3, with T3 being the finest time step used as the reference. For the case at
 $A^*$
= 0.25 and
 $f^*$
= 0.3, these three dimensionless time-step sizes are set as T1 = 0.0133, T2 = 0.0067 and T3 = 0.0033. The comparison of aerodynamic force statistics is summarised in table 2, including the time-averaged lift, drag coefficients and lift-to-drag ratio and the r.m.s. fluctuations. The intermediate time-step size T2 shows close agreement with T3, while the coarsest time-step size T1 exhibits noticeably larger deviations. Figure 24 compares the time-averaged pressure coefficient distribution along the membrane, the time-varying membrane displacement, lift coefficient and the corresponding lift spectra for the three time-step sizes. The coupled dynamics obtained with T2 and T3 shows a reasonable agreement. Thus, the time-step size T2 is chosen in the numerical simulations, which provides a good balance between accuracy and computational cost.
Time-step size convergence of a heaving compliant membrane immersed in the wake flows of a stationary circular cylinder at
 $A^*$
= 0.25 and
 $f^*$
= 0.3. The percentage discrepancies in the brackets are calculated with respect to the finest time-step size T3.

Table 2. Long description
A table comparing aerodynamic force statistics for different time-step sizes in a heaving compliant membrane immersed in the wake flows of a stationary circular cylinder. The table has four rows and three columns. The columns are labeled T1, T2, and T3, representing different dimensionless time-step sizes. The rows are labeled with different aerodynamic force statistics: Mean lift, Mean drag, Mean lift-to-drag ratio, The r.m.s. lift fluctuation, and The r.m.s. drag fluctuation. Each cell contains a value and a percentage discrepancy calculated with respect to the finest time-step size T3. Row 1: Mean lift, T1: 2.0847 (3.8766 percent), T2: 1.9680 (-1.9383 percent), T3: 2.0069. Row 2: Mean drag, T1: 0.3348 (0.4500 percent), T2: 0.3279 (-1.6202 percent), T3: 0.3333. Row 3: Mean lift-to-drag ratio, T1: 6.2275 (3.4262 percent), T2: 6.0018 (-0.3217 percent), T3: 6.0212. Row 4: The r.m.s. lift fluctuation, T1: 1.9419 (-0.8577 percent), T2: 1.9662 (0.3829 percent), T3: 1.9587. Row 5: The r.m.s. drag fluctuation, T1: 0.2606 (-8.4651 percent), T2: 0.2764 (-2.9153 percent), T3: 0.2847.
Comparison of (a) time-averaged pressure coefficient distribution along the membrane surface, (b) time-varying membrane displacement at the middle position, (c) time-varying lift coefficient and (d) frequency spectra of membrane lift force for three mesh sets.

Figure 23. Long description
The image contains four line graphs comparing data for three mesh sets labeled M1, M2, and M3. Panel A shows the time-averaged pressure coefficient distribution along the membrane surface. The horizontal axis is labeled ξ/c and ranges from 0 to 1. The vertical axis is labeled C-p and ranges from -4 to 4. The lines for M1, M2, and M3 show similar trends with slight variations. Panel B displays the time-varying membrane displacement at the middle position. The horizontal axis is labeled tU∞/c and ranges from 30 to 50. The vertical axis is labeled δz/c and ranges from -0.4 to 0.8. The lines for M1, M2, and M3 exhibit periodic oscillations with similar patterns. Panel C presents the time-varying lift coefficient. The horizontal axis is labeled tU∞/c and ranges from 20 to 45. The vertical axis is labeled CL and ranges from -10 to 10. The lines for M1, M2, and M3 show fluctuating values with no clear periodic trend. Panel D illustrates the frequency spectra of membrane lift force. The horizontal axis is labeled fc/U∞ and ranges from 0 to 2. The vertical axis is labeled Mode energy (%) and ranges from 0 to 50. The lines for M1, M2, and M3 show peaks at specific frequencies, indicating dominant modes of lift force.
Comparison of (a) time-averaged pressure coefficient distribution along the membrane surface, (b) time-varying membrane displacement at the middle position, (c) time-varying lift coefficient and (d) frequency spectra of membrane lift force for three time-step sizes.

Appendix D. Three-dimensional effects on wake-heaving membrane dynamics
All computations in the present study are conducted under two-dimensional configurations. The primary objective is to examine flapping-mode transitions and derive mechanistic scaling relations by isolating the dominant wake–membrane coupling mechanisms. The Reynolds number considered here lies within a transitional regime where three-dimensional wake instabilities may arise. Zurman-Nasution et al. (Reference Zurman-Nasution, Ganapathisubramani and Weymouth2020) numerically investigated the influence of three-dimensionality on propulsive performance for heaving and pitching wings at
 $\textit{Re}=5300$
by comparing two- and three-dimensional simulations. Their results indicate that near-wake topology and cycle-resolved force histories remain effectively two-dimensional over an intermediate range of flapping conditions. Three-dimensionality becomes more prominent outside this range, degrading spanwise coherence and introducing quantitative changes in propulsive performance. These findings suggest that two-dimensional models can capture the dominant force-generating mechanisms and mode structures when the wake–membrane system exhibits quasi-periodic and coherent shedding. However, when the wake becomes strongly three-dimensional, two-dimensional simulations tend to over-predict coherence. This broader observation is consistent with the review by Wu et al. (Reference Wu, Zhang, Tian, Li and Lu2020), which emphasises that finite aspect ratio and spanwise flow can introduce additional physics absent in canonical two-dimensional wings. Similarly, Fu et al. (Reference Fu, Fu, Han, Niu, Zhang and Zhao2025) examined VIVs of a circular cylinder in two and three dimensions and reported that two-dimensional simulations capture overall response amplitudes and dominant frequencies across broad conditions, while pronounced three-dimensional differences arise near high-response branches and transitional regimes. Based on these prior two- and three-dimensional comparisons, the primary two-dimensional mode structures and lock-in trends identified in the present study are expected to remain representative in periodic and coherent regimes. Fully three-dimensional effects would likely reduce spanwise coherence and shift regime boundaries near transition, without fundamentally altering the core deficit-compensation and mode-selective amplification mechanisms identified here.
Appendix E. Natural frequency of two-dimensional heaving compliant membrane
The governing equation of a two-dimensional membrane in a uniform flow of speed
 $U_{\infty }$
is given as (Tiomkin & Jaworski Reference Tiomkin and Jaworski2022)
 \begin{equation} \rho ^s h \frac {\partial ^2 d^s}{\partial t^2} - T^s \frac {\partial ^2 d^s}{\partial x^2} = \Delta p(x,t), \end{equation}
where
 $T^s$
denotes the membrane tension resultant (N m−1). Here,
 $\Delta p(x,t)$
represents the pressure difference on the membrane surface, which is positive when acting in the positive
 $d^s$
direction. The displacement of the membrane is decomposed into the heaving motion term
 $h_{\!p}(t)$
and the fluid-induced deformation term
 $\delta (x,t)$
, which is written as
 \begin{equation} d^s(x,t) = h_{\!p}(t) + \delta (x,t) = A_{h_{\!p}} \sin (2 \pi f_{\!p} t) + \overline {\delta }(x) + {\delta }^{\prime } (x,t) ,\qquad x\in [0,c], \end{equation}
where
 $A_{h_{\!p}}$
and
 $f_{\!p}$
are the heaving amplitude and frequency. Here,
 $\overline {\delta }(x)$
and
 ${\delta }^{\prime } (x,t)$
denote the time-averaged deformation and its fluctuation term. Substituting (E2) into (E1) gives
 \begin{equation} \rho ^s h \frac {\partial ^2 \delta (x,t)}{\partial t^2} - T^s \frac {\partial ^2 \delta (x,t)}{\partial x^2} = \Delta p(x,t) - \rho ^s h \frac {\partial ^2 h_{\!p}(t)}{\partial t^2}. \end{equation}
The time-varying pressure difference
 $\Delta p(x,t)$
on the membrane surface and the tension force
 $T^s$
can be decomposed into the time-averaged and fluctuating components
 \begin{equation} \Delta p(x,t) = \overline {\Delta p} (x) + \Delta p^{\prime } (x,t), \quad \quad T^s = \overline {T^s} + {T^s}^{\prime }. \end{equation}
Equation (E3) can be reformulated by substituting (E2), (E4) into (E3) to give
 \begin{equation} \rho ^s h \frac {\partial ^2 {\delta }^{\prime } }{\partial t^2} - (\overline {T^s} + {T^s}^{\prime }) \frac {\partial ^2 (\overline {\delta } + {\delta }^{\prime }) }{\partial x^2} = \overline {\Delta p} + \Delta p^{\prime } - \rho ^s h \frac {\partial ^2 h_{\!p}(t)}{\partial t^2}. \end{equation}
The time-averaged force balance equation for the mean membrane shape satisfies
 \begin{equation} \overline {T^s} \frac {\partial ^2 \overline {\delta } }{\partial x^2} + \overline {\Delta p} = 0. \end{equation}
We assume the mean membrane shape is a parabolic-like curve
 \begin{equation} \overline {\delta } (x) = 4 \overline {\delta _n}^{\,\textit{max}} \frac {x}{c} \left ( 1-\frac {x}{c} \right )\!, \end{equation}
where
 $\overline {\delta _n}^{\,\textit{max}}$
is the maximum deformation at the middle position. For the equivalent uniform pressure difference
 $\overline {\Delta p}_{eq}=({1}/{c}) \int _{0}^{c} \overline {\Delta p}(x) {\rm d}x$
, (E6) is written as
 \begin{equation} \overline {T^s} = \frac {\overline {\Delta p}_{eq} c^2}{8 \overline {\delta _n}^{\,\textit{max}}} = \frac {\overline {L}}{c} \frac { c^2}{8 \overline {\delta _n}^{\,\textit{max}}} = \frac {1}{2} \rho ^f U^2_{\infty } \overline {C}_L \frac { c^2}{8 \overline {\delta _n}^{\,\textit{max}}} = \frac {\rho ^f U^2_{\infty } \overline {C}_L c^2}{16 \overline {\delta _n}^{\,\textit{max}}}. \end{equation}
Linearising about the mean shape, we retain only
 $O({\delta }^{\prime })$
terms and neglect
 $O({T^s}^{\prime } {\delta }^{\prime })$
and
 $O({T^s}^{\prime } ({\partial ^2 \overline {\delta } }/{\partial x^2}))$
contributions (Fung Reference Fung2008). Equation (E5) can be given as
 \begin{equation} \rho ^s h \frac {\partial ^2 {\delta }^{\prime } }{\partial t^2} - \overline {T^s} \frac {\partial ^2 {\delta }^{\prime } }{\partial x^2} = \Delta p^{\prime } - \rho ^s h \frac {\partial ^2 h_{\!p}(t)}{\partial t^2}.\end{equation}
For the purpose of estimating the undamped eigenfrequency, we approximate the unsteady lift fluctuation by an added-mass and an effective aerodynamic stiffness contribution, which is given as
 \begin{equation} L^{\prime }(t) = - m^{as} \frac {\partial ^2 {\delta }^{\prime } }{\partial t^2} - K^{ae} {\delta }^{\prime }, \end{equation}
where
 $m^{as}=\rho ^f \pi c^2 /4$
denotes the added mass for the dominant normal-acceleration component (Jaiman et al. Reference Jaiman, Parmar and Gurugubelli2014). Aerodynamic damping is neglected here to obtain a closed-form undamped eigenfrequency estimate. To account for fluid–structure coupling in the eigenfrequency, we introduce an equivalent linearised aerodynamic stiffness, estimated directly from computational fluid dynamics statistics as
 \begin{equation} K^{ae}=-\frac {\partial L^{\prime }}{\partial \delta ^{\prime }} \approx -\frac {1}{2} \rho ^f U^2_{\infty } c \frac {{C_L^{\prime }}^{\textit{rms}}}{{\delta _n^{\prime }}^{\textit{rms}}}. \end{equation}
The equivalent uniform pressure difference on the membrane surface is further written as
 \begin{equation} \Delta p^{\prime }_{eq} (t) = \frac {L^{\prime }(t)}{c} = - \frac {m^{as}}{c} \frac {\partial ^2 {\delta }^{\prime } }{\partial t^2} - \frac {K^{ae}}{c} {\delta }^{\prime }. \end{equation}
Thus, (E9) is written as
 \begin{equation} \left (\rho ^s h + \frac {m^{as}}{c} \right ) \frac {\partial ^2 {\delta }^{\prime } }{\partial t^2} - \overline {T^s} \frac {\partial ^2 {\delta }^{\prime } }{\partial x^2} + \frac {K^{ae}}{c} {\delta }^{\prime } = \rho ^s h \frac {\partial ^2 h_{\!p}(t)}{\partial t^2}. \end{equation}
The right-hand side represents the inertial forcing induced by the prescribed heaving motion. Next, we assume the membrane displacement fluctuation as the function of the
 $i$
th structural mode
 $\phi _n(x)$
 \begin{equation} {\delta }^{\prime } = q_n (t) \phi _n(x), \quad \phi _n(x)=\sin \left ( \frac {n \pi x}{c}\right )\!, \end{equation}
where
 $q_n(t)$
is the generalised coordinate. The homogeneous equation yields the natural frequency
 \begin{equation} f_n=\frac {1}{2 \pi }\sqrt {\frac {\overline {T^s}\,n^2\pi ^2/c^2+K^{ae}/c}{\rho ^s h + m^{as}/c}} \qquad n=1,2,\ldots. \end{equation}
The first term in the numerator corresponds to membrane tension stiffness, the second to aerodynamic stiffness, while the denominator contains structural and added-mass contributions. Near-resonant amplification occurs when the imposed heaving frequency approaches
 $f_n$
.


 f∗
 A∗

 Y
 Y
 f∗
 A∗


 Y
 (f∗,A∗)=(0.2,0.15)
 (f∗,A∗)=(0.5,0.25)

 Y


 fp
 fw
 (f∗,A∗)=(0.2,0.15)

 95%

 f∗
 A∗

 x/c

 Y
 (f∗
 A∗)
 (f∗
 A∗)


 f∗
 A∗

 (f∗,A∗)=(0.2,0.15)
 (f∗,A∗)=(0.5,0.25)

 σm/∑m=15σm
 σm

 f∗
 A∗
 A∗=γ(f∗)−1/n+δ
 fm≈fw
 fm≈fp
 fm≈fp
 fc≈fp
 f1≈fp


 A∗
 f∗
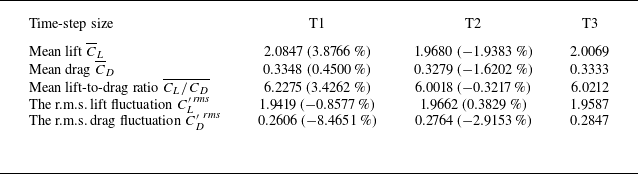
 A∗
 f∗



