

1 Introduction
Characterization of the flow-induced deformation of flexible structures has been the subject of intense research in the last decades due to its relevance in various engineering, biology and forestry fields (Taylor Reference Taylor1952; Daniel & Combes Reference Daniel and Combes2002; Harder et al. Reference Harder, Speck, Hurd and Speck2004; Vollsinger et al. Reference Vollsinger, Mitchell, Byrne, Novak and Rudnicki2005; Crawford & Platts Reference Crawford and Platts2008; Stanford et al. Reference Stanford, Ifju, Albertani and Shyy2008; Vogel Reference Vogel2009). The reconfiguration of wall-mounted elastic structures under relative flow usually results in a reduction of the frontal area, and mean drag,  $D$. The scaling
 $D\propto U_{0}^{2}$ of a rigid body may exhibit a relation
 $D\propto U_{0}^{2+V}$; here,
 $U_{0}$ is the incoming velocity and
 $V<0$ is the so-called Vogel exponent (Vogel Reference Vogel1984, Reference Vogel1989). Evidence shows that
 $-4/3<V<-0.1$, where the geometry and material of the structure, buoyancy, skin friction, incoming flow profile and other factors may affect this parameter (Vogel Reference Vogel1984; Alben, Shelley & Zhang Reference Alben, Shelley and Zhang2002, Reference Alben, Shelley and Zhang2004; Zhu & Peskin Reference Zhu and Peskin2007; Zhu Reference Zhu2008; Gosselin, De Langre & Machado-Almeida Reference Gosselin, De Langre and Machado-Almeida2010; Luhar & Nepf Reference Luhar and Nepf2011; Leclercq & De Langre Reference Leclercq and De Langre2016; Bhati et al. Reference Bhati, Sawanni, Kulkarni and Bhardwaj2018). Experimental works have shown that larger than quadratic drag laws are possible for systems with a ball covered by elastic round filament canopy (Gosselin & De Langre Reference Gosselin and De Langre2011) or inverted flags (Kim et al. Reference Kim, Cossé, Cerdeira and Gharib2013).
Porosity plays a significant role in natural structures; it modulates the aero- and hydrodynamic forces, the structure reconfiguration and the surrounding flow. Examples are ubiquitous; they range from coral groups (Tunnicliffe Reference Tunnicliffe1982), and insect wings (Santhanakrishnan et al. Reference Santhanakrishnan, Robinson, Jones, Low, Gadi, Hedrick and Miller2014) to dandelion seeds (Cummins et al. Reference Cummins, Seale, Macente, Certini, Mastropaolo, Viola and Nakayama2018). The variation of structure porosity influences the stream impinging its frontal surface, which either passes through the structure or circumvents it, significantly altering the velocity shear and therefore flow recirculation in the wake region. Early experiments by Castro (Reference Castro1971) pointed out that, for structures with Reynolds numbers in the range  $2.5\times 10^{4}<Re<9\times 10^{4}$, a critical structure porosity exists where periodic Kármán vortex shedding can be triggered. The dependence between drag coefficient and porosity has been examined in various studies; pressure loss appears to be a function of the Reynolds number,
 $Re$, porosity ratio,
 $\unicode[STIX]{x1D6FD}$, and Mach number,
 $Ma$ (Castro Reference Castro1971; Koo & James Reference Koo and James1973; Graham Reference Graham1976; Laws & Livesey Reference Laws and Livesey1978). During the past decades, various studies have focused on establishing a robust model for predicting the drag coefficient as a function of porosity. Early efforts can be dated to Betz (Reference Betz1920), where potential flow was considered everywhere except regions very close to the structure; the model works well over a particular range of porosities, with underestimation of the drag coefficient at small porosities. An improved model was proposed by Koo & James (Reference Koo and James1973), which scaled the wake velocity to match the boundary conditions; experiments revealed underperformance in cases with low porosity. Recently, Steiros & Hultmark (Reference Steiros and Hultmark2018) extended the model of Koo & James (Reference Koo and James1973) by including the influence of base suctions, leading to a much better prediction of drag at low porosity.
Most studies on perforated structures, however, have focused on rigid bodies. The role of porosity in the deformation and drag of flexible structures has not been explored in detail. Recently, Guttag et al. (Reference Guttag, Karimi, Falcón and Reis2018) investigated the influence of base clamping on the static deformation of perforated plates; wake characteristics and direct measurements of drag were not explored. This work aims to contribute to the understanding of the dynamics of perforated, flexible plates; it focuses on the drag, wake and reconfiguration for various degrees of porosity,  $\unicode[STIX]{x1D6FD}$. For the first time, we demonstrate that, over a critical porosity level, the Vogel exponent can be positive. This counter-intuitive phenomenon implies that flow-induced bending can lead to an increased drag coefficient. This distinct result offers new insight into the design of flexible structures subject to relative flow. The experimental set-up is described in § 2, the results are presented and discussed in § 3 and the main remarks are given in § 4.
2 Experimental set-up
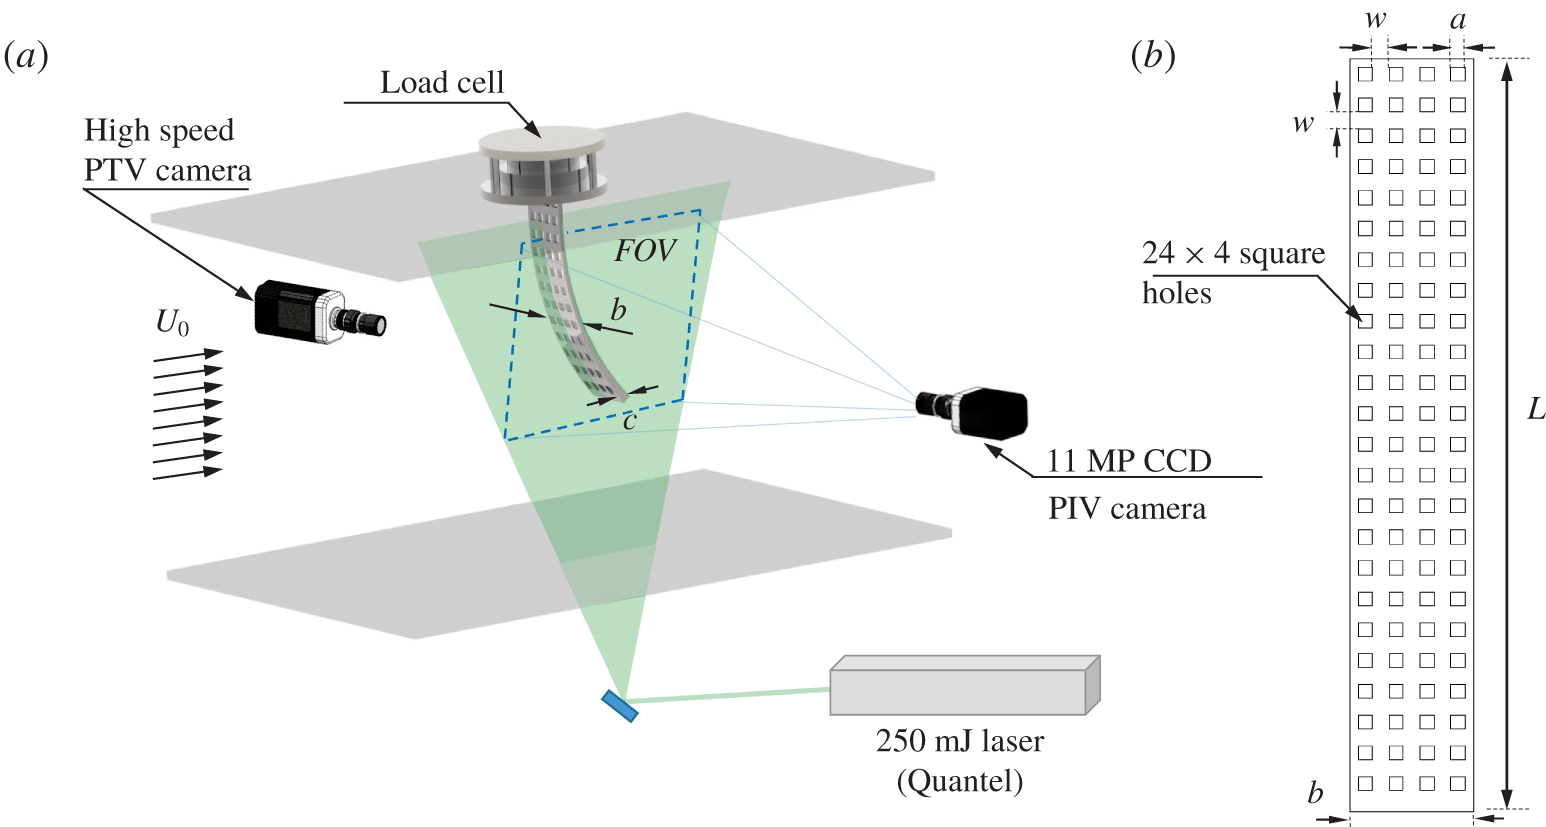
We performed systematic experiments considering five flexible plates, which shared a length of  $L=300~\text{mm}$, width
 $b=50~\text{mm}$, thickness
 $c=1.2~\text{mm}$, Young’s modulus
 $E=3.72~\text{GPa}$ and density
 $\unicode[STIX]{x1D70C}_{m}=1.12~\text{kg}~\text{m}^{-3}$, but different porosity ratios. These structures were tested within the free-stream region of the Talbot wind tunnel at the University of Illinois (Adrian, Meinhart & Tomkins Reference Adrian, Meinhart and Tomkins2000), and mounted normal to the top wall as cantilever beams with the frontal area facing the incoming flow. There, the boundary layer effects were negligible (figure 1a). The ratio of the gravity force to the restoring force
 $G=\unicode[STIX]{x0394}\unicode[STIX]{x1D70C}gbcL^{3}/(EI)=0.66$ (Luhar & Nepf Reference Luhar and Nepf2011), indicates that gravity plays a minor role in the plate deformation within the tested flow speeds. The porosity of the plates consisted of
 $N=96$ square holes of side
 $a$, which were distributed uniformly along the span and width of the structures; this resulted in an array of 24 × 4 holes (see figure 1b). The selected levels of porosity were
 $\unicode[STIX]{x1D6FD}=[0,0.5]$ every
 $\unicode[STIX]{x0394}\unicode[STIX]{x1D6FD}=0.1$, which were controlled with the size of each square hole. For the selected
 $\unicode[STIX]{x1D6FD}$,
 $a=0$, 3.95, 5.59, 6.85, 7.91 and 8.84 mm, and the space between holes was then
 $w=12.5$, 8.55, 6.91, 5.65, 4.59 and 3.66 mm. It is worth noting that the equivalent mass per unit length (
 $\unicode[STIX]{x1D70C}_{m}A_{eq}$) and equivalent bending stiffness (
 $EI_{eq}$) are determined by the plate porosity, which can be approximated as (Luschi & Pieri Reference Luschi and Pieri2014; Barry & Tanbour Reference Barry and Tanbour2018)
 $$\begin{eqnarray}\left.\begin{array}{@{}c@{}}\displaystyle \unicode[STIX]{x1D70C}_{m}A_{eq}=\frac{\unicode[STIX]{x1D70C}_{m}bc(1-N(\unicode[STIX]{x1D6FE}-2))\unicode[STIX]{x1D6FE}}{N+\unicode[STIX]{x1D6FE}},\\ \displaystyle EI_{eq}=EI\frac{(N+1)\unicode[STIX]{x1D6FE}(N^{2}+2N+\unicode[STIX]{x1D6FE}^{2})}{(1-\unicode[STIX]{x1D6FE}^{2}+\unicode[STIX]{x1D6FE}^{3})N^{3}+3\unicode[STIX]{x1D6FE}N^{2}+(3+2\unicode[STIX]{x1D6FE}-3\unicode[STIX]{x1D6FE}^{2}+\unicode[STIX]{x1D6FE}^{3})\unicode[STIX]{x1D6FE}^{2}N+\unicode[STIX]{x1D6FE}^{3}},\end{array}\right\}\end{eqnarray}$$
where  $\unicode[STIX]{x1D6FE}=w/[(w+a)]$. The large
 $L/b=5$ and
 $L/c\gg 20$ suggest negligible influence of the Poisson ratio. However, porosity may influence the structural characteristics of the plates (Lee & Kim Reference Lee and Kim2005; Barry & Tanbour Reference Barry and Tanbour2018).
(a) Basic schematic of the experimental set-up illustrating the load cell, particle tracking velocimetry (PTV) and particle image velocimetry (PIV) systems; (b) general distribution of the porosity in a plate.

The aerodynamic force and deformation of each plate were characterized for 19 incoming velocities  $U_{0}\in [3.26,11.54]~\text{m}~\text{s}^{-1}$ every
 $\unicode[STIX]{x0394}U_{0}\approx 0.46~\text{m}~\text{s}^{-1}$, resulting in Reynolds numbers of
 $Re=U_{0}b/\unicode[STIX]{x1D708}\in [1.1,3.8]\times 10^{4}$, where
 $\unicode[STIX]{x1D708}$ denotes the kinematic viscosity of air. Within the tested
 $Re$, complementary measurements show that the drag coefficient,
 $C_{d}$, of a rigid plate experience minor variations. The flexible plates were mounted on a high-resolution ATI Gamma load cell that measured instantaneous drag at a frequency of 1 kHz for periods of 30 s (Jin & Chamorro Reference Jin and Chamorro2017; Jin et al. Reference Jin, Yan, Qiu and Chamorro2018b, Reference Jin, Kim, Fu and Chamorro2019). All the forces were measured three times, 90 s each case. The uncertainty of the load cell in the worst scenario, i.e. under the minimum drag, was ∼3 %. A two-dimensional particle tracking velocimetry system was used to track fiducial points distributed along one side of each plate at a frequency of 300 Hz for periods of 30 s (Kim et al. Reference Kim, Kim, Liberzon and Chamorro2016; Jin, Kim & Chamorro Reference Jin, Kim and Chamorro2018a). A Halogen Spotlight illuminated the plates, and the motions were captured with a 2 MP high-speed camera. Flow in the vicinity of the plates was characterized by a PIV system from TSI. A wall-normal field of view of
 $350~\text{mm}\times 280~\text{mm}$ crossing the centre of the plates was illuminated with a 1 mm thick laser sheet produced by a
 $250~\text{mJ}~\text{pulse}^{-1}$ laser from Quantel. Two thousand image pairs were collected at 1 Hz by an 11 MP CCD camera, where the airflow was seeded with
 $1~\unicode[STIX]{x03BC}\text{m}$ olive oil particles. Images were interrogated with a recursive cross-correlation method with an interrogation window size of
 $16\times 16$ pixels and 50 % overlap, resulting in a vector grid spacing of
 $\unicode[STIX]{x0394}x=\unicode[STIX]{x0394}y=0.9~\text{mm}$. To minimize any initial transient effect, the force fluctuations and tip motions were sampled after the steady state was reached (waiting time of at least 60 s).
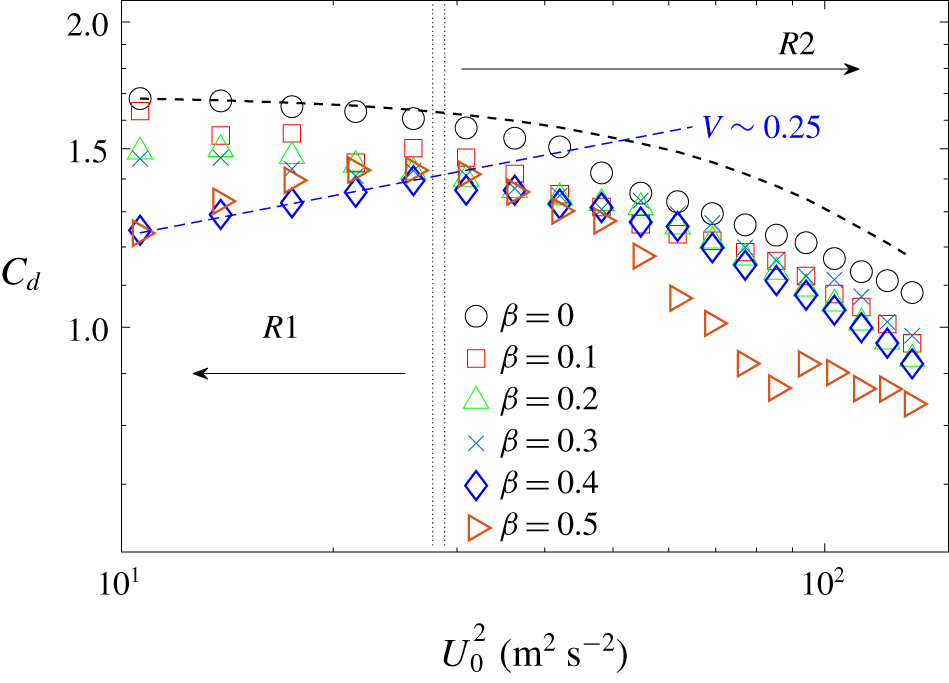
Distribution of the drag coefficient,  $C_{d}$, as a function of incoming velocity,
 $U_{0}$, and structure porosity,
 $\unicode[STIX]{x1D6FD}$. The dashed black line denotes the trend for
 $\unicode[STIX]{x1D6FD}=0$ following the relation by Luhar & Nepf (Reference Luhar and Nepf2011).

3 Results
3.1 On the drag coefficient
Characterization of the drag and structure deformation of the various plates revealed distinct trends modulated by the degree of porosity. The time-averaged drag coefficient  $C_{d}$ of a perforated plate of porosity
 $\unicode[STIX]{x1D6FD}$, defined as
 $$\begin{eqnarray}C_{d}=\frac{2D}{\unicode[STIX]{x1D70C}_{f}U_{0}^{2}bL(1-\unicode[STIX]{x1D6FD})},\end{eqnarray}$$
where  $D$ is the time-averaged drag force, and
 $\unicode[STIX]{x1D70C}_{f}$ is the air density, is illustrated in figure 2. The base case with a non-perforated plate, i.e.
 $\unicode[STIX]{x1D6FD}=0$, shows the
 $C_{d}$ decreasing monotonically with
 $U_{0}$ due to the increased structure deformation. Luhar & Nepf (Reference Luhar and Nepf2011) proposed a formulation for estimating
 $C_{d}$ in these cases based on the plate bending along the span, as follows:
 $$\begin{eqnarray}C_{d}\propto \int _{0}^{L}\cos ^{3}\unicode[STIX]{x1D703}\,\text{d}s,\end{eqnarray}$$
where  $\text{d}s$ is the differential length along the plate span, and
 $\unicode[STIX]{x1D703}$ denotes the local bending angle. The estimation of
 $C_{d}$ using (3.2) with direct PTV measurements of the plate reconfiguration is shown with the dashed black line. Overall, the trend fits reasonably well; some deviations are attributed to the tip effect. In general, the increase of
 $\unicode[STIX]{x1D6FD}$ leads to lower
 $C_{d}$ across
 $U_{0}$; some minor local exceptions may be attributed to experimental effects, and the coupled influence of plate reconfiguration and small recirculation regions induced by each perforation, which plays a central role in governing the drag distribution, as illustrated later. Except locally,
 $C_{d}$ decreased with
 $U_{0}$ for
 $\unicode[STIX]{x1D6FD}\lesssim 0.3$; however, surprisingly, at sufficiently high values, namely
 $\unicode[STIX]{x1D6FD}=0.4$ and 0.5,
 $C_{d}$ exhibited an increase with
 $U_{0}$ in a low-velocity range (up to
 $U_{0}\lessapprox 5.1~\text{m}~\text{s}^{-1}$,
 $R1$ in figure 2), which is followed by the expected decay as that with lower or no porosity plates (
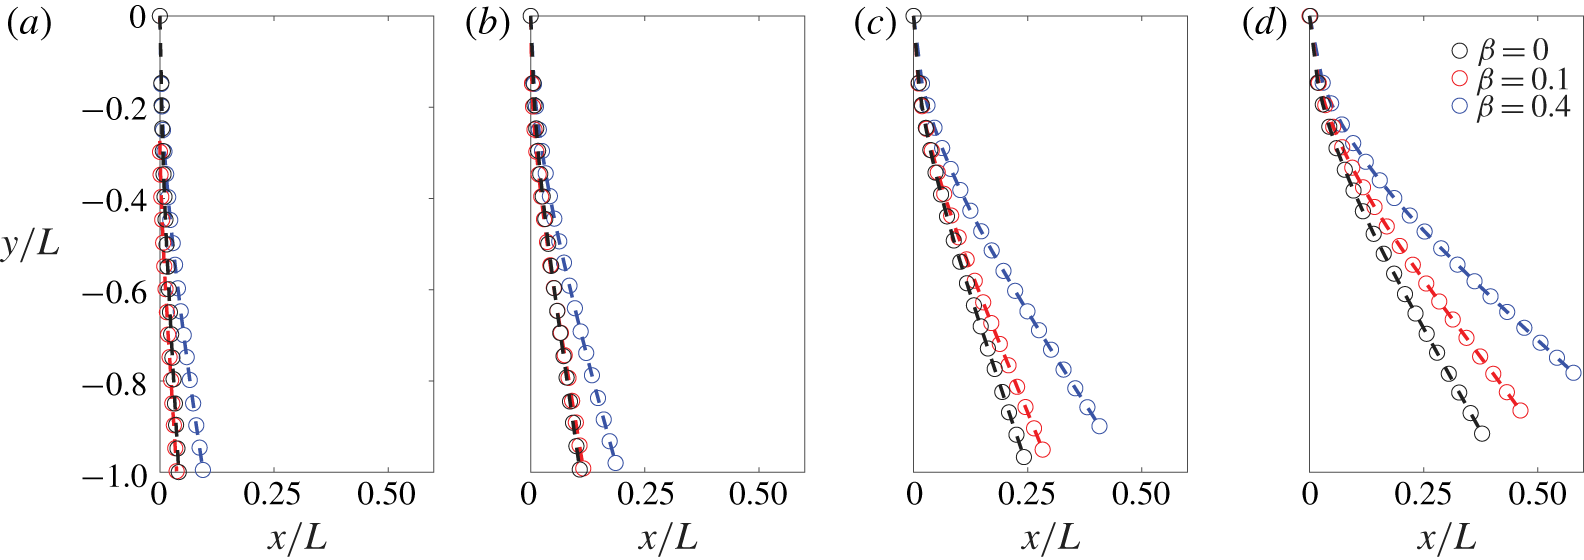
 $R2$ in figure 2). Figure 3 illustrates the mean postures of the plates with
 $\unicode[STIX]{x1D6FD}=0$, 0.1 and 0.4. Regardless of structure porosity, higher
 $U_{0}$ induced higher structure bending.
It is worth stressing that at  $\unicode[STIX]{x1D6FD}=0.4$ and 0.5 higher plate reconfiguration induced an increased drag coefficient for a range of comparatively low velocities. Specifically,
 $C_{d}\propto U_{0}^{V}$, where
 $V\geqslant 0.25$, i.e. the Vogel exponent of the mean drag is
 $V\geqslant 0.25$ (shown as dashed blue line in figure 2). Also note that, despite the observed significant bending for cases with
 $\unicode[STIX]{x1D6FD}=0.4$ in figure 3, the corresponding
 $C_{d}$ decreased less than the solid counterpart (≈25 % compared to 36 % between
 $U_{0}\approx 3.3$ and
 $11.5~\text{m}~\text{s}^{-1}$). This phenomenon indicates that the classical theory that provides the relation between flexible structure reconfiguration and drag is not applicable for structures with sufficiently high porosity.
(a–d) Equilibrium plate deformation at  $U_{0}\approx 3.3$, 4.6, 7.4 and
 $10.2~\text{m}~\text{s}^{-1}$; the black, red and blue circles correspond to the
 $\unicode[STIX]{x1D6FD}=0$, 0.1 and 0.4 plates.

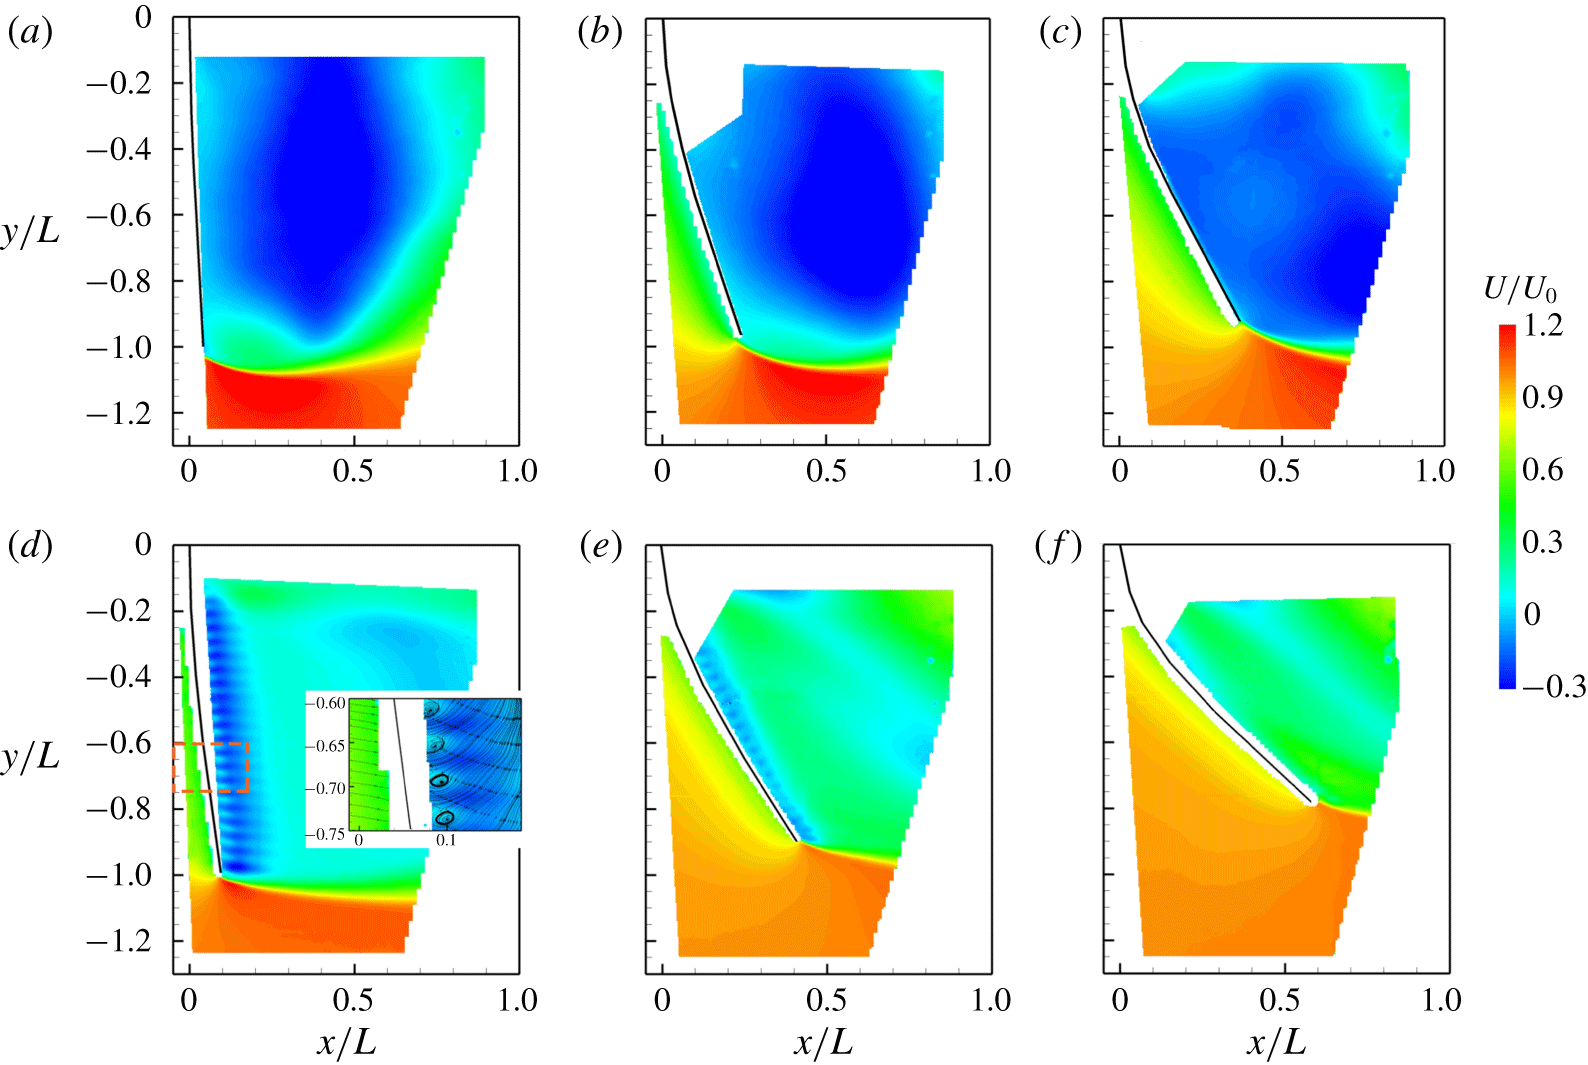
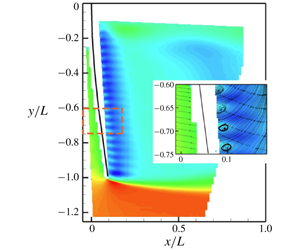
Time-averaged streamwise velocity distribution for plates with (a)  $\unicode[STIX]{x1D6FD}=0$,
 $U=3.26~\text{m}~\text{s}^{-1}$; (b)
 $\unicode[STIX]{x1D6FD}=0$,
 $U=7.4~\text{m}~\text{s}^{-1}$; (c)
 $\unicode[STIX]{x1D6FD}=0$,
 $U=10.16~\text{m}~\text{s}^{-1}$; (d)
 $\unicode[STIX]{x1D6FD}=0.4$,
 $U=3.26~\text{m}~\text{s}^{-1}$; (e)
 $\unicode[STIX]{x1D6FD}=0.4$,
 $U=7.4~\text{m}~\text{s}^{-1}$; (f)
 $\unicode[STIX]{x1D6FD}=0.4$,
 $U=10.16~\text{m}~\text{s}^{-1}$. The inset in (d) superimposed with the streamlines highlights the local recirculation regions.

3.2 Wake characteristics induced by the bent perforated plates
To explore the modulation of  $\unicode[STIX]{x1D6FD}$ by the drag and structure deformation, we characterized the flow field in the vicinity of the plates for the ranges of
 $U_{0}$ and
 $\unicode[STIX]{x1D6FD}$ indicated above. Selected cases illustrating the time-averaged streamwise velocity distributions,
 $U/U_{0}$, are shown in figure 4. They reveal the distinctive impact of porosity in the very near wake region. The base structure (plate with no porosity) induced significant backward flow
 $U(x,y)\leqslant 0$ along the span with marked velocity excess near the tip across all
 $U_{0}$ (figure 4a–c). Due to the no-slip and no-penetration conditions, negligible flow occurred very close to the leeward surface of the plate. However, plate porosity altered the mean wake and flow near to the structure. Specifically, the region with backward flow reduced significantly due to the flow leakage through the plate, which facilitated the wake mixing and the velocity recovery (figure 4d–f). The location of the region with maximum velocity deficit shifted closer to the plate with high porosity; comparatively small backward flow regions appeared at regular intervals along the span of the structure. Such a phenomenon is particularly distinctive at small plate deformations, as highlighted in the inset of figure 4(d). There, superimposed streamlines show recirculation bubbles located between the backward flow areas, which matched with the square holes homogeneously distributed along the plate span. Figure 4 shows that the very near wake of the plate is composed of a series of small recirculation regions produced by the flow passing the open areas. The size of these recirculation bubbles is comparable to the width
 $w$ (space between holes), which is approximately one order of magnitude smaller than
 $b$. The flow in the vicinity of the space between adjacent perforations appeared highly modulated by the neighbouring flow. Then, the drag on the plate can be thought of as the contribution of the drag produced by the flow passing through each rectangular grid at sufficiently high porosity. Here, the local drag can be estimated with the local incoming velocity and local plate inclination.
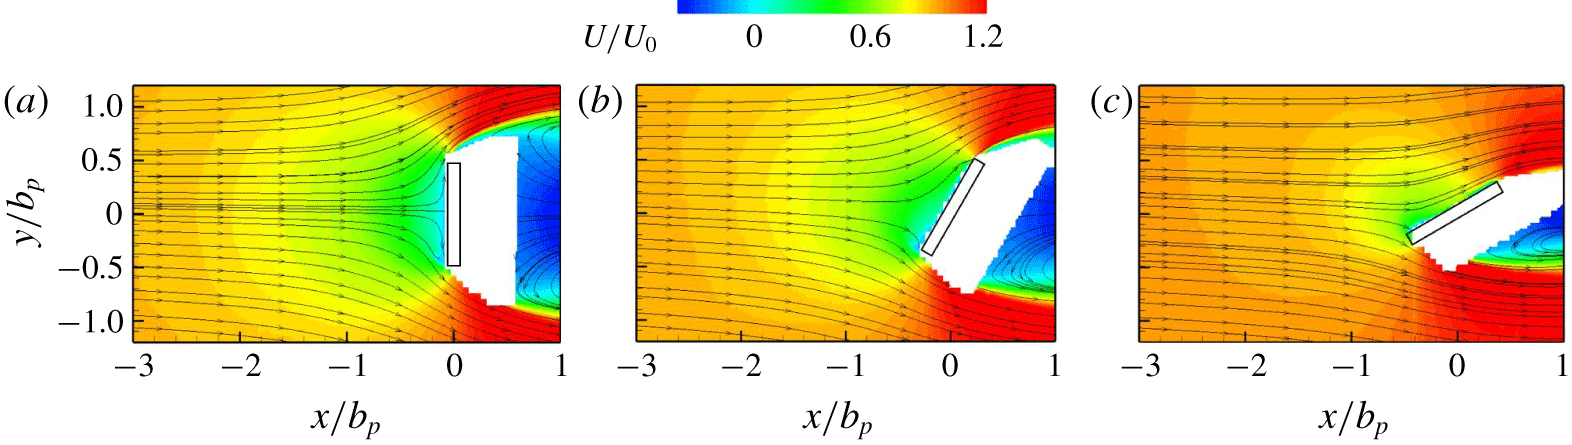
Time-averaged streamwise velocity distribution approaching a two-dimensional rigid plate with angles of attack of (a)  $0^{\circ }$, (b)
 $30^{\circ }$ and (c)
 $60^{\circ }$.

Structures in the vicinity of others affect the flow, and the aerodynamic force (Ljungkrona, Norberg & Sunden Reference Ljungkrona, Norberg and Sunden1991; Sumner et al. Reference Sumner, Wong, Price and Paidoussis1999; Sumner, Richards & Akosile Reference Sumner, Richards and Akosile2005; Niu & Zhu Reference Niu and Zhu2006; Alam & Zhou Reference Alam and Zhou2013; Ma et al. Reference Ma, Kang, Lim, Wu and Tutty2017). The inclination of the plate dependent on the flow magnitude alters the flow dynamics in the vicinity of the space between adjacent perforations of thickness  $w$. Estimation of the effective velocity impinging these sections along the plate span may provide a way to determine the bulk drag on the plate. It is important to note that the windward side of bluff bodies strongly influences the incoming flow in the vicinity of the structure (Hemmati, Wood & Martinuzzi Reference Hemmati, Wood and Martinuzzi2016; Younis, Alam & Zhou Reference Younis, Alam and Zhou2016; Liu et al. Reference Liu, Hamed, Jin and Chamorro2017), which has to be accounted for in the estimation of the local (at scale
 $w$) and bulk (plate) drag. This phenomenon is inspected with complementary experiments using a two-dimensional rigid plate impinged by uniform flows under various angles of attack. There, regardless of the angle of attack, the incoming velocity at approximately (2.5–3)
 $b_{p}$ upwind of the structure, where
 $b_{p}$ is the width of the rigid rectangular plate, is nearly the free stream (figure 5); it is an effective velocity,
 $U_{e}$, to compute the drag. Such a hint is, then, used to consider the effective velocity around each perforation of the plate, which was obtained via the time-averaged streamwise velocity distribution at
 $d=2.5w$ upwind of the frontal plate surface.
3.3 A basic model for the drag of highly perforated plates
The distribution of  $U_{e}$ plays a key role in determining the drag force acting on flexible plates with high porosity. To quantify this influence,
 $U_{e}$ of the
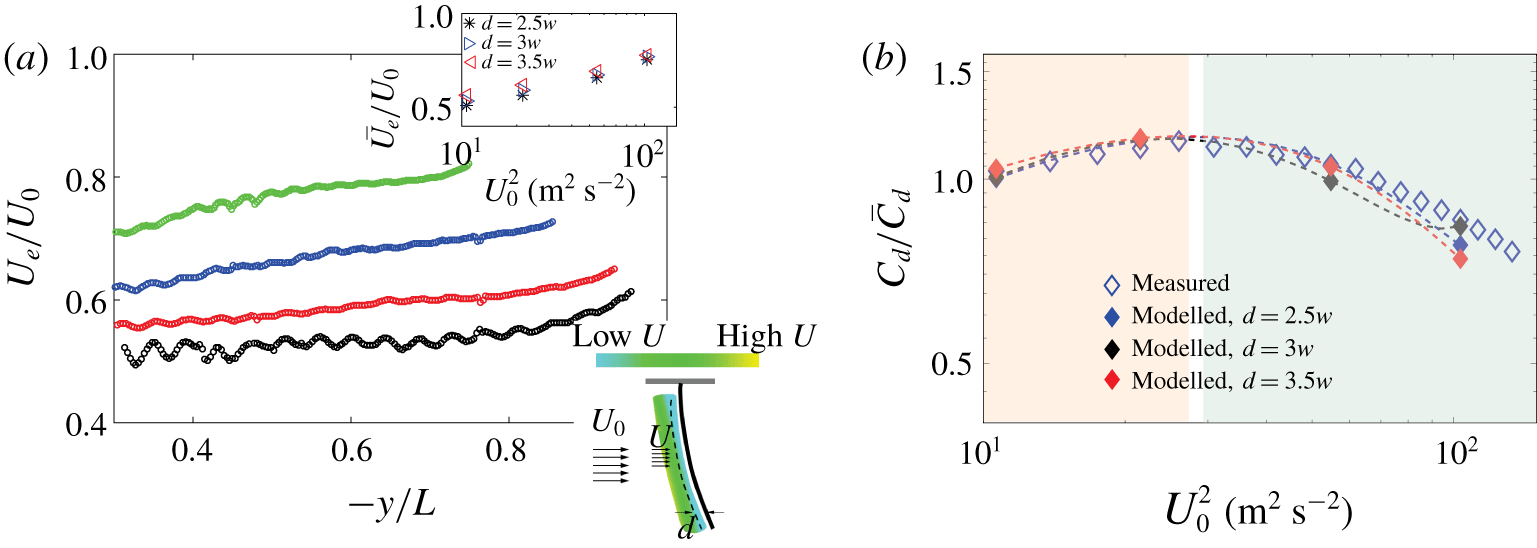
 $\unicode[STIX]{x1D6FD}=0.4$ plate is shown in figure 6(a). As noted from the complementary experiments, the velocity profile at a distance of approximately
 $d=2.5w$ upwind off the surface of the plate can be considered as the effective velocity around each perforation to calculate the local drag. Regardless, we inspected
 $U$ at
 $d=2.5$–
 $3.5w$ upwind of the plate surface as
 $U_{e}$ in figure 6(a). Higher plate bending generates larger inclination angles in each section around a perforation, where the local wake induced weaker influence on the neighbouring perforation. This led to a monotonic increase of
 $U_{e}$ with
 $U_{0}$. In the limiting case with the plate (surface vector) parallel to the incoming flow,
 $U_{e}=U_{0}$. Then, the relation between drag force acting on the structure (
 $D_{model}$) and
 $U_{e}$ can be integrated as
 $$\begin{eqnarray}D_{model}\propto \int _{0}^{L}\frac{1}{2}U_{e}^{2}\cos ^{3}\unicode[STIX]{x1D703}\,\text{d}s.\end{eqnarray}$$
Figure 6(b) illustrates the estimated and measured  $C_{d}$ normalized with its mean value
 $\bar{C}_{d}$ across
 $U_{0}$. The estimated
 $C_{d}$ shows good agreement with the experimental results with
 $d\in [2.5,3.5]w$. For relatively low
 $U_{0}$ (
 $U_{0}\lesssim 5~\text{m}~\text{s}^{-1}$,
 $R1$ marked red region),
 $\text{d}Cd/\text{d}U_{0}>0$ may be affected by the increase of
 $U_{e}$, whereas for higher
 $U_{0}$ (
 $U_{0}\gtrsim 6~\text{m}~\text{s}^{-1}$,
 $R2$ marked green region),
 $\text{d}Cd/\text{d}U_{0}<0$; there, the deformation of the plate modulates
 $C_{d}$, similar to the case of non-perforated plates.
(a) Distribution of the effective velocity  $U_{e}$ (obtained at
 $d=2.5w$) along the
 $\unicode[STIX]{x1D6FD}=0.4$ plate span at
 $U_{0}=3.26~\text{m}~\text{s}^{-1}$ (black),
 $4.64~\text{m}~\text{s}^{-1}$ (red),
 $7.4~\text{m}~\text{s}^{-1}$ (blue) and
 $10.16~\text{m}~\text{s}^{-1}$ (green); the inset (top) shows the spatially averaged
 $U_{e}$ for various upwind distances
 $2.5w$–
 $3.5w$, indicating negligible changes; the inset (bottom) shows a schematic of a time-averaged near field velocity distribution and locations where
 $U_{e}$ is considered (dashed line,
 $d=2.5w$–
 $3.5w$ upwind of the plate surface). (b) Comparison of measured and modelled
 $C_{d}/\bar{C_{d}}$ of the
 $\unicode[STIX]{x1D6FD}=0.4$ plate for a range of velocities; the red and green dashed regions denote the range dominated by
 $U_{e}$ (
 $R1$) and plate bending (
 $R2$).

As pointed out by Luhar & Nepf (Reference Luhar and Nepf2011), for an elastic, solid plate of sufficiently high aspect ratio, the drag may be determined by the extent of the structure bending or tip equilibrium location ( $X_{tip}$) as
 $$\begin{eqnarray}\left.\begin{array}{@{}c@{}}\displaystyle \frac{C_{d}(U_{0})}{C_{d}(U_{0}+\unicode[STIX]{x0394}U_{0})}=\frac{\displaystyle \int _{0}^{L}\cos ^{3}\unicode[STIX]{x1D703}\,\text{d}s|_{U_{0}}}{\displaystyle \int _{0}^{L}\cos ^{3}\unicode[STIX]{x1D703}\,\text{d}s|_{U_{0}+\unicode[STIX]{x0394}U_{0}}},\\ \displaystyle X_{tip}=\int _{0}^{L}\sin \unicode[STIX]{x1D703}\,\text{d}s.\end{array}\right\}\end{eqnarray}$$
So far, we have shown that this formulation cannot be extrapolated to perforated structures due to the significant effect of  $U_{e}$. We introduce a non-dimensional parameter
 $\unicode[STIX]{x1D6FC}$ in
 $U_{0}$ to further quantitatively evaluate the role of
 $\unicode[STIX]{x1D6FD}$ in
 $C_{d}$ over a range of flow velocities. Then, the drag coefficient can be written as
 $$\begin{eqnarray}C_{d}=\frac{2D}{\unicode[STIX]{x1D70C}_{f}(\unicode[STIX]{x1D6FC}U_{0})^{2}bL(1-\unicode[STIX]{x1D6FD})}.\end{eqnarray}$$
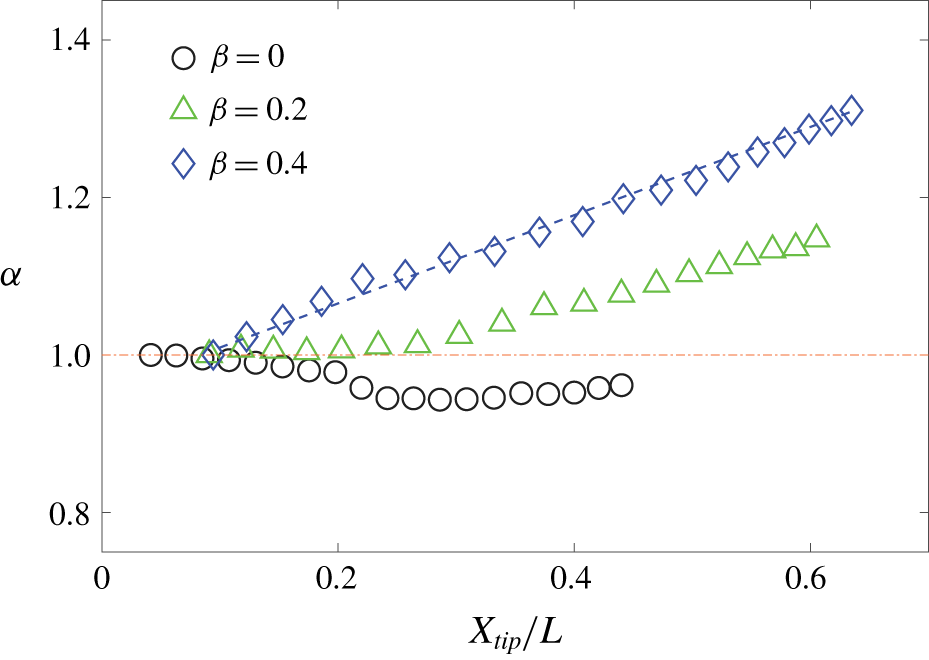
This way,  $\unicode[STIX]{x1D6FC}$ can be adjusted to match (3.4) for solid plates; its value provides a bulk quantification of the effect of porosity. The distribution of
 $\unicode[STIX]{x1D6FC}$ for different plate porosities
 $X_{tip}$ is shown in figure 7. For the base case with
 $\unicode[STIX]{x1D6FD}=0$,
 $\unicode[STIX]{x1D6FC}\approx 1$ remains approximately constant across all
 $X_{tip}$. The effect of porosity appears to be important at
 $\unicode[STIX]{x1D6FD}\gtrsim 0.1$; there,
 $\unicode[STIX]{x1D6FC}$ increases monotonically with the plate tip bending due to the increase of
 $U_{e}$ with
 $U_{0}$. At
 $\unicode[STIX]{x1D6FD}=0.4$,
 $\unicode[STIX]{x1D6FC}$ undergoes a significant, nearly linear increase with
 $X_{tip}$ up to ∼30 % higher than its initial value, where the counter-intuitive, positive Vogel exponent occurred. Estimation of the effective velocity, or
 $\unicode[STIX]{x1D6FC}$, is not straightforward without direct measurement of the flow characteristics around the plate surface. As noted in figure 7,
 $\unicode[STIX]{x1D6FC}$ increases monotonically with both
 $X_{tip}/L$ and
 $\unicode[STIX]{x1D6FD}$. As a first-order approximation, a linear relationship can be defined as follows:
 $$\begin{eqnarray}\unicode[STIX]{x1D6FC}=A(\unicode[STIX]{x1D6FD})+BX_{tip}/L,\end{eqnarray}$$
where  $A=A_{0}+A_{1}\unicode[STIX]{x1D6FD}$; in the inspected parameter space,
 $(A_{0},A_{1},B)\approx (0.9,0.4,0.3)$. Equation (3.6) provides a basic, first-order estimation of the effective velocity with a perforated, bent plate. It is worth stressing that it is based on cases with regularly spaced rectangular perforations. Inspection of the potential effect of perforation patterns and high-order formulation deserves particular attention.
Non-dimensional parameter  $\unicode[STIX]{x1D6FC}$ as a function of tip equilibrium deformation
 $X_{tip}/L$ and porosity,
 $\unicode[STIX]{x1D6FD}$.

4 Conclusions and remarks
In summary, our experiments examined the flow-induced deformation of wall-mounted perforated plates, their drag coefficient, structure bending and flow characteristics. We uncovered, for the first time, that structure bending may produce a higher drag coefficient, or equivalently, positive Vogel exponent, at sufficiently high structure porosity. To explain this phenomenon, we considered the bulk drag as the contribution of small regions containing a hole. We have demonstrated that the equivalent structure bending significantly alters the effective velocity, which may lead to the counter-intuitive trend of the drag coefficient. It is worth stressing that the effective velocity increases gradually from near the base of the plate to the tip, as noted in figure 6(a); this factor can be accounted for in the recent model by Guttag et al. (Reference Guttag, Karimi, Falcón and Reis2018), which assumed a constant local drag coefficient over the extent of the strip. In addition, the distinct coupling between the effective velocity and equilibrium posture of the structure provides insight into the different drag coefficients of a given perforated plate with different clamped configurations and, therefore, various postures, as reported in Guttag et al. (Reference Guttag, Karimi, Falcón and Reis2018).
In this study, we have taken a step to quantitatively assess the complex fluid–structure interaction of perforated bodies with various degrees of porosity. There may be other parameters that deserve close inspection to obtain a full understanding of the reconfiguration of perforated structures. Geometry and distribution of the empty spaces (Castro Reference Castro1971), the boundary conditions (Guttag et al. Reference Guttag, Karimi, Falcón and Reis2018) and even higher porosity may offer an unexpected relation between flow and drag. The uncovered positive Vogel exponent may be instrumental in explaining the complex dynamics of highly porous, flexible bodies in nature; examples range from canopies to wings.
Acknowledgements
This work was supported by the Department of Mechanical Science and Engineering, University of Illinois at Urbana-Champaign.
Declaration of interests
The authors report no conflict of interest.