One of the goals of the formation of the European Community in the late 1950s was to increase the prosperity of European citizens by means of initiating economic interdependency among European countries. In addition to economic traffic, European migration rates have accelerated substantially over the past decades. Citizens of Western European countries increasingly migrate to other Western European countries (Eurostat, 2008) for occupational, educational, and marital reasons. In 2006, for example, around 17,000 migrants born in other Western European countries arrived in The Netherlands (Statline, 2008). A majority of these migrants originated from the neighboring countries Belgium, Germany, and Great Britain, although substantial numbers were born in Romance-speaking countries like France, Spain, and Italy.
Studies on immigrant adjustment have indicated that immigrants face various degrees of difficulty in acquiring proficiency in the dominant language of the host country and that a migrant’s native language may play an important role in this process (Chiswick & Miller, Reference Chiswick and Miller2005). For this reason, the present study examines the impact of 11 West European mother tongues—spoken in 15 Western European countries—on the acquisition of Dutch as a target language. The native languages examined are Danish, English, Finnish, French, German, Greek, Italian, Norwegian, Portuguese, Spanish, and Swedish.
This study differs in two important aspects from other studies of SLA. Applied linguistic studies on second-language (L2) proficiency are generally small-scale in nature and make use of test scores as direct measures of language proficiency. In contrast, SLA research from a sociological and economic perspective is typically done on a larger scale and uses self-reported proficiency as an indirect measure of language skills. The disadvantages of both approaches are evident. Small-scale studies cannot deal with a variety of mother tongues as an explanatory factor for differences in target language proficiency. It is perhaps for this reason that a comparison that involves a variety of mother tongues is relatively rare in most handbooks on SLA. Additionally, although the use of self-reported target (destination) language proficiency measures has become standard practice in large-scale research, its validity has remained an unresolved issue, despite the fact that occasionally high correlations have been found with direct measures of language skills (Hulsen, Reference Hulsen2000; Spolsky, Reference Spolsky1989). Anderson (Reference Anderson1982), for instance, reported that the correlation between self-reported proficiency in English with test scores differs by country of origin. Additionally De Bot, Evers, De Quay, and Van der Slik (Reference De Bot, Evers, De Quay and Van der Slik2005) have found that students with a lower level of education tend to overestimate their foreign language skills. Both of these forms of bias may thus severely tarnish the validity of the outcomes of large-scale investigations using self-reporting measures.
The present study is not hindered by these kinds of shortcomings. A large-scale database, which contains information on nearly 6,000 West European migrants, is used here to examine the impact of these migrants’ mother tongue on their proficiency in Dutch. Another virtue of this database is that direct measures of productive abilities of Dutch language proficiency have been applied, which enabled the study of the participants’ speaking and writing skills in Dutch. This has not been done in the past on a large-scale basis and allows for the test of a variety of hypotheses that could not be investigated adequately in the past.
THEORY
A review of contemporary handbooks on SLA reveals that in theories on SLA, the role of the mother tongue receives considerable attention, for example, in contrastive analysis (e.g., Lado, Reference Lado1957; Weinreich, Reference Weinreich1953) or in studies on crosslinguistic transfer of the first language (L1) on the L2 (e.g., Arabski, Reference Arabski2006; Jarvis & Pavlenko, Reference Jarvis and Pavlenko2008; Kellerman & Sharwood Smith, Reference Kellerman and Sharwood Smith1986; Odlin, Reference Odlin1989; Schwartz & Sprouse, Reference Schwartz and Sprouse1996). Contrastive analysis of differences between languages is a highly laborious task, however, because a fine-grained study of differences between languages can be very extensive even when just two languages are concerned. For example, to present the differences between English and Spanish, Stockwell, Bowen, and Martin’s (Reference Stockwell and Bowen1965) contrastive analysis spanned more than 300 pages, with another 150 pages on phonological differences (Stockwell & Bowen, Reference Stockwell and Bowen1965). It seems needless to say that contrastive analyses in which even a small number of languages are involved may comprise a life-task project. In the present study, rather than aiming for an extensive coverage of grammatical, phonetic, or vocabulary differences among a variety of mother tongues in relation to a target language, the goal is to examine overall differences in productive language skills in relation to a substantial number of mother tongues. To my knowledge, studies in which the global mastery of productive skills in English as a L2—or any other target language for that matter—are covered in relation to a large number of mother tongues are rare, if not nonexistent. This is an odd observation because it is commonly accepted that languages vary substantially in their difficulty to be mastered. The present study is intended to fill this gap for West European languages with Dutch as the target language.
In linguistic typological research, it is generally accepted that languages can be grouped together into language families or language trees (Crystal, Reference Crystal1987) and that languages have evolved from common ancestors (Dunn, Reesink, Foley, & Levinson, Reference Dunn, Reesink, Foley and Levinson2005; Gordon, Reference Gordon2005) or—more controversially—from a single ancestor (Cavalli-Sforza, Menozzi, & Piazza, Reference Cavalli-Sforza, Menozzi and Piazza1994; Ruhlen, Reference Ruhlen1987). It has been argued that languages linguistically closely related to the target language have more in common with and are, in general, less difficult to acquire than languages more distant from the target language (Lado, Reference Lado1957; Weinreich, Reference Weinreich1953). Acquiring a target language may thus be more difficult for learners with mother tongue A than for learners with mother tongue B or C; but how much more difficult (Chiswick & Miller, Reference Chiswick and Miller2005; McCloskey, Reference McCloskey1998)? It is clear that this question can only be answered when a measure of linguistic distance is available, either constructed on the basis of learners’ levels of mastery or on the basis of common linguistic features (syntactic or phonetic similarity, proportion of cognates, etc.). In the current study, both possibilities will be tested by comparing average levels of mastery according to learners’ mother tongues with linguistic distance measures.
Linguistic Distance
Linguists have always rejected the possibility of constructing a quantitative measure for linguistic distance because languages were considered to be too complex to be captured in a quantitative way. During the last decade, however, an increasing number of researchers have pursued work in that direction (Chiswick & Miller, Reference Chiswick and Miller2005; Dunn et al., Reference Dunn, Reesink, Foley and Levinson2005; Gooskens, Reference Gooskens2007; Gooskens & Heeringa, Reference Gooskens and Heeringa2004; Gordon, Reference Gordon2005; Gray & Atkinson, Reference Gray and Atkinson2003; Heeringa, Reference Heeringa2004; Kessler, Reference Kessler, Abney and Hinrichs1995; McMahon & McMahon, Reference McMahon and McMahon2005).
Based on the work of Hart-Gonzalez and Lindemann (Reference Hart-Gonzalez and Lindemann1993), Chiswick and Miller (Reference Chiswick and Miller2005) constructed a linguistic distance measure that takes into account the difficulty that American language learners have experienced in mastering a great variety of target languages. Hart-Gonzalez and Lindemann reported average language ability scores for 43 languages for English-speaking Americans after 16 and 24 weeks of foreign language training. These ability scores have been applied to construct a linguistic distance measure for these 43 languages. Using the Ethnologue Language Family Index (Grimes & Grimes, Reference Grimes and Grimes1993), Chiswick and Miller were able to extend that list by adding almost 70 closely related languages. A critical assumption underlying the validity of this particular measure of linguistic distance is that the distance between, for example, English and Japanese is identical to the distance between Japanese and English; that is, it is equally difficult for Americans to learn Japanese as it is for Japanese speakers to learn English.
Although appealing, this assumption has proven to be untenable, at least for closely related languages. Gooskens (Reference Gooskens2007) and Moberg, Gooskens, Nerbonne, and Vaillette (Reference Moberg, Gooskens, Nerbonne, Vaillette, Dirix, Schuurman, Vandeghinste and Van Eynde2007) have found that mutual intelligibility of Nordic languages is asymmetric: Swedish citizens experience more difficulty in understanding Danish than the other way around. Norwegian listeners have also less difficulty in understanding Swedish and Danish than the Swedish and Danish listeners in understanding Norwegian. Additionally, Gooskens found such an asymmetric intelligibility among three other closely related languages: Dutch, Afrikaans, and Frisian. There is no reason to assume that symmetric intelligibility will be present between less related languages, such as English and Mandarin or isiXhosa. In sum, the validity of a linguistic distance measure based on the difficulty experienced by learners with a common mother tongue when they try to master a variety of target languages may be questionable if it is intended to measure the difficulty experienced by learners with a great variety of mother tongues when they try to master a common target language.
Rather than relying on the judgment of a single tester as in Chiswick and Miller’s (Reference Chiswick and Miller2005) study, the goal of the present study is to explain the differences in proficiency by means of two existing linguistic distance measures—the ones developed by McMahon and McMahon (Reference McMahon and McMahon2005) and by Cavalli-Sforza et al. (Reference Cavalli-Sforza, Menozzi and Piazza1994). McMahon and McMahon constructed a linguistic distance measure based on the 200-items database used by Dyen, Kruskal, and Black (Reference Dyen, Kruskal and Black1992), which is a slightly modified version of the Swadesh (Reference Swadesh1952) list. This 200-item database contains a culture-neutral sample of basic or high-frequency words in 84 Indo-European languages and dialects. Because these words are highly frequent, it is assumed that they are relatively resistant to borrowing and loss. A distance matrix for these languages such as the one proposed by McMahon and McMahon can be constructed on the basis of the proportion of cognates: I will designate such a distance matrix as a cognate linguistic distance measure. Cavalli-Sforza et al. developed a genetic linguistic distance measure by means of transposing genetic differences between populations to the linguistic classification scheme adopted from Ruhlen (Reference Ruhlen1987). This genetic linguistic distance measure is greatly contested (O’Grady et al., Reference O’Grady, Goddard, Bateman, DiMichelle, Funk and Kress1989), however, because the assumption of commensurate or synchronous development of genes and tongues appears to be untenable. Due to various forms of language contact (borrowing, colonization, conquest, or enslavement), populations may have lost their original language throughout the course of history. To put it in statistical terms, the random noise may have increased to such an extent since mankind left its African cradle that the detection of the original tone has become a desperate effort. Despite these difficulties with the genetic distance measure, both linguistic distance measures will be employed because only empirical research can prove the claim that one linguistic distance measure is superior compared to the other. Therefore, the differences in oral and written proficiency in Dutch are expected to be explained by the cognate linguistic distance measure and the genetic linguistic distance measure. However, it is assumed that the explanative power of the cognate distance measure is greater than the explanative power of the genetic distance measure.
Hypotheses on Learner Characteristics
The ease or difficulty that learners experience in trying to master a second or even a third language does not depend solely on a learner’s mother tongue, however: Other factors may also be involved. To extract the purest possible effect of mother tongue, the role of other factors has to be controlled for. Therefore, both learner characteristics and context characteristics are considered here.
It is generally accepted that younger learners ultimately achieve higher levels of mastery of an additional language than older learners (see Ellis, Reference Ellis1994) and, thus, it can be expected that age of arrival plays an important role (Chiswick & Miller, Reference Chiswick and Miller2008; Hakuta, Bialystok, & Wiley, Reference Hakuta, Bialystok and Wiley2003). There is much debate on the existence of a so-called critical period (e.g., Johnson & Newport, Reference Johnson and Newport1989, Reference Johnson and Newport1991; Scovel, Reference Scovel1988). The premise is that learners of an additional language can only reach a native or near-native level of mastery provided they started to learn that language before a certain age. The exact age considered to be critical in this respect is not entirely clear (Chiswick & Miller), but it seems to be located between 12 and 16 years of age. If learners start to acquire a L2 at a later age, it is assumed that they are unable to acquire a nativelike level due to biologically based or cognition-based constraints (see Bongaerts, Mennen, & Van der Slik, Reference Bongaerts, Mennen and Van der Slik2000; Hakuta et al.). In fact, the relationship between age and level of mastery of a L2 should show a discontinuity around the end of the critical period (Johnson & Newport, Reference Johnson and Newport1989, Reference Johnson and Newport1991). In most studies, however, no evidence was found for the occurrence of such a discontinuity (Birdsong, Reference Birdsong, Davies and Elder2004; Chiswick & Miller; Hakuta et al.). Additionally, it was found that learners who started to acquire a L2 later occasionally reached nativelike levels of mastery (Birdsong, Reference Birdsong1992; Bongaerts, Planken, & Schils, Reference Bongaerts, Planken, Schils and Birdsong1995; Bongaerts et al., Reference Bongaerts, Mennen and Van der Slik2000), which, according to the critical period hypothesis, should be impossible. Despite the fact that no discontinuities have been reported regarding the relationship between age of arrival and the acquisition of a L2, it does not seem likely either that the process is entirely linear. Several studies (Chiswick & Miller; Flege, Yeni-Komshian, & Liu, Reference Flege, Yeni-Komshian and Liu1999; Johnson & Newport, Reference Johnson and Newport1989) have reported an asymptotically declining trend for age of arrival. The possible explanations for this declining trend are subject to much debate (see Birdsong, Reference Birdsong2006), and an extensive overview is beyond the scope of this study. Johnson and Newport (Reference Johnson and Newport1989), for example, have stated that the reason for this asymptotically declining trend is that, paradoxically, language learning becomes more difficult for older learners as a result of certain increasing cognitive abilities. However, L2 learning also seems to become more difficult when people age as a result of a gradual decline of cognitive abilities like memory and reasoning; a process that, according to Salthouse (Reference Salthouse2009), starts when people have passed beyond their mid-twenties. It is, therefore, hypothesized that the attained level of proficiency was rather high when migrants were young at their arrival and declined gradually when migrants were older at their arrival.
There are two main manners of acquiring a L2. Although both kinds of acquisition will be employed in most cases, a L2 will be learned during interactions with the native population or by taking lessons in that language on a regular basis, either in the country of origin or in the country of reception. Length of residence may be seen as a proxy for the amount of exposure to the target language. In the SLA literature, the effect of input and interaction is well documented (Gass, Reference Gass1997; Krashen, Reference Krashen1985; Long, Reference Long, Ritchie and Bhatia1996). For some languages, however, the length of input or exposure is harder to establish unambiguously than for others. English, for example, has high visibility internationally in the mass media and is commonly used as a lingua franca in economic traffic. Additionally, English is taught in secondary schools in many countries. As a consequence, many migrants have been exposed to English in their country of birth during childhood or adolescence, and it is perhaps for this reason that the effect of length of residence on the acquisition of English is often nonsignificant (Hakuta et al., Reference Hakuta, Bialystok and Wiley2003). Acquiring a language such as Dutch that is less prominent in international communication might present a different case because, in most foreign countries, there is practically no exposure to the Dutch language. Hence, it is expected that the effect of length of residence will be strong when migrants have just arrived and that it will decline over time, as their mastery of Dutch reaches a saturation point. This hypothesis is based, inter alia, on the findings of Van Tubergen and Kalmijn (Reference Van Tubergen and Kalmijn2005), who used length of residence and its square to predict immigrants’ self-assessment of their proficiency in eight target languages.Footnote 1
The number of hours spent on learning the L2 will also be considered. It is hypothesized rather straightforwardly that the number of hours spent on lessons in Dutch has a positive effect on Dutch language proficiency. Education has been found to affect SLA as well (Chiswick & Miller, Reference Chiswick and Miller2003; Flege et al., Reference Flege, Yeni-Komshian and Liu1999; Hakuta et al., Reference Hakuta, Bialystok and Wiley2003). The effect of schooling may be multifold. Educational attainment can serve as a proxy for intelligence: Immigrants with more years of schooling may be expected to have greater abilities to acquire new information, including the acquisition of a second or even a third language. Additionally, these immigrants may have superior language production abilities or greater knowledge of their mother tongue (Chiswick & Miller, Reference Chiswick and Miller2007). Education may also affect some components of SLA more than others. Flege et al., for example, have found that the acquisition of rule-based English morphosyntax is positively affected by education, whereas its lexically based aspects and the occurrence of a foreign accent are not. Finally—and what is easily forgotten—learning is a skill that has to be learned as well. Research among illiterate immigrants or immigrants with low levels of education has demonstrated that it is not the lack of intelligence per se that severely hampers the acquisition of a L2 but the lack of learning skills that are normally acquired in school (van de Craats, Kurvers, & Young-Scholten, Reference van de Craats, Kurvers and Young-Scholten2006). For example, it has been shown that learners with low levels of education have developed low metalinguistic skills and are less aware of the differences and similarities between their mother tongue and the target language (van de Craats, Reference van de Craats and Faux2007). It might be helpful to consider Cummins’s (Reference Cummins1993) distinction between basic interpersonal communication skills and cognitive academic language proficiency. Basic interpersonal communication skills are used in day-to-day conversations to interact socially with other people and are cognitively not very demanding. In contrast, cognitive academic language proficiency is focused on in school and refers to formal learning. It includes metalinguistic skills such as inferring, comparing, classifying, and synthesizing teaching materials. Lack of cognitive academic language proficiency may thus severely impede the acquisition of an additional language, especially when it is offered in a school setting. It is therefore expected that educational level will be positively related to the acquisition of Dutch.
The gender of language learners also needs to be considered. In contemporary handbooks on SLA, the role of a learner’s gender is hardly discussed. De Bot, Lowie, and Verspoor (Reference De Bot, Lowie and Verspoor2005), for instance, did not even provide a single entry on gender or sex in their advanced resource book on SLA. Ellis (Reference Ellis1994) reported on two large-scale studies in which women outperform men and suggested that the higher degree of motivation among girls, found in several studies, is at least partly responsible for this gender-related performance difference. This relative lack of interest on gender differences in L2 research is in sharp contrast with the massive literature on gender effects in L1 acquisition research. Macoby and Jacklin (1974), for example, performed a meta-analysis and identified 85 studies that reported women outperforming men on verbal ability. Their conclusion was that “girls do better on tests of grammar, spelling, and word fluency” (p. 26). Cole (Reference Cole1997) and Willingham and Cole (Reference Willingham and Cole1997) concluded in an even larger study, with more than 4 million students, that women retained their language advantage over the past 30 years. Women fared much better in writing and language use (grammatical conventions, expression, spelling, etc.), whereas small effect sizes were detected for reading and vocabulary reasoning. These outcomes are in line with studies on differences between men and women regarding their cognitive functioning and language processing due to the influence of sex hormones (Estabrooke, Mordecai, Maki, & Ullman, Reference Estabrooke, Mordecai, Maki and Ullman2002; Kimura, Reference Kimura1999). Assuming that these outcomes may be extended to SLA (see Ullman, Reference Ullman and Sanz2005), it is hypothesized that women will outperform men in their mastery of the Dutch language.
Hypotheses on Context Characteristics
In addition to learner characteristics, context characteristics also need to be considered. Van Tubergen and Kalmijn (Reference Van Tubergen and Kalmijn2005) identified three kinds of context effects: destination, origin, and setting effects. Destination effects pertain to characteristics of the receiving countries. Setting effects stem from the combination of country-of-origin characteristics with country-of-destination characteristics. Destination and setting effects might be studied when—as in their study—migration effects of different receiving countries are analyzed. In the present study, only one receiving country, The Netherlands, was included, and therefore destination and setting effects will not be considered here. Origin effects pertain to characteristics of the country of birth that can affect a migrant’s proficiency in the target language.
The quality of the educational system of the country of origin will also be examined here. Substantial variation in the quality of educational curricula has been observed, not just when comparisons are made with less advanced third world countries but even within Western Europe (Organisation for Economic Co-operation and Development, 2008). It is hypothesized that migrants from countries with a high-quality educational curriculum will be more proficient in Dutch than migrants from countries with a less developed school curriculum.
Finally, the difference between monolingual and multilingual countries is examined, because it may be expected that migrants from multilingual countries, such as Belgium, Italy, Spain, and Switzerland, have higher metalinguistic skills (Bialystok, Reference Bialystok2007). Therefore, it is hypothesized that learners from multilingual countries are more successful in acquiring an additional language than learners originating from monolingual countries. Belgium presents a special case here because the two dominant languages are Dutch and French. In theory, Belgians are bilingual and therefore ought to be proficient in Dutch. For historical reasons, however, Flemish citizens are more fluent in French than Walloons are in Dutch, and this is probably one of the reasons why French-speaking Belgians are included in the database. Belgian learners of Dutch will be expected to achieve higher levels of mastery of Dutch than learners from other multilingual countries.
METHOD
Sample
Since the early 1990s, the State Examination of Dutch as a Second Language (STEX) is administered on three occasions each year. These examinations consist of two separate exams. Program II (STEX II) is offered to migrants who intend to start a higher level education in The Netherlands or who have a higher level occupation. Program I (STEX I) is designed for migrants who intend to pursue a lower level (vocational) education or who have a lower level occupation. The demands in Dutch language proficiency are the same for both levels, although in STEX II, the tasks are more abstract. These STEX II examinations are required only for migrants who will be enrolled in Dutch universities; however, until 2005, the vast majority of migrants took these exams voluntarily. This implies that a certain amount of self-selection based on motivation, for example, cannot be excluded as a reason for taking these exams.
In this study, the test results of the STEX II exams from 1995 to 2004 were examined. Because there were three occasions for examination each year, this resulted in measurements taken on 30 separate occasions. The examination consists of four language proficiency skills: speaking, writing, reading, and listening, which were tested separately. A candidate has passed the entire exam when he or she has received 500 points or more on each of the four subexams. In the current study, only the two productive skills—oral and written proficiency in Dutch—will be discussed. I selected both productive skills because speaking skills may diverge from written proficiency for several reasons. For example, migrants may make use of a script other than Latin (Greek), or there may exist an important phonetic difference between the mother tongue and the target language (English-Dutch), or, depending on their mother tongue, migrants may express themselves more easily orally than in written form, or vice versa.
Although the candidates come from virtually every country in the world, the present study will be restricted to the results of migrants from the following Western European countries: Austria, Belgium, Denmark, France, Finland, Germany, Great Britain, Greece, Ireland, Italy, Norway, Portugal, Spain, Sweden, and Switzerland. Candidates from Cyprus, Greenland, Iceland, Liechtenstein, Luxemburg, and Malta as well as candidates whose mother tongue was not a language of the country of origin were excluded for numerical reasons.
In total, 7,121 West European candidates from the countries selected took at least one of the four subexams between 1995 and 2004. Candidates who did not pass were allowed to take the examinations as often as they wanted. However, when a candidate received 500 points or more for a skill, this candidate had passed that subexam and was not allowed to participate in that part of the test any more (e.g., to try to obtain a higher score). Data on test scores, on the number of times candidates took the exam, as well as on gender and age were available for all candidates.
Before the actual examination had taken place, candidates were invited to complete a brief questionnaire about various background characteristics, such as length of residence in The Netherlands, country of birth, mother tongue, education, and so on. The response rate was 80.9%, which was primarily caused by missing answers on the questions regarding the candidate’s education.Footnote 2 This restricted the sample to 5,763 candidates. It was thus examined whether this lack of response to questionnaire items affected the outcomes on examination scores. It turned out that those who had answered the questions on the background characteristics had, on average, higher test scores than those who did not answer the questions about their background. Given the large number of observations, even trivial differences can turn out to be highly significant. This was indeed the case: T values were 3.72 and 4.48, respectively, with associated p-values below .001. Significance does not necessarily imply meaningfulness, however. Therefore, Cohen’s d was calculated; it ranged from .08 to .10. Although Cohen (Reference Cohen1988) hesitated to offer clear-cut definitions of the term, there will be little disagreement about considering such effect sizes as small. Thus, the test score differences between candidates who answered the questions on educational level and those who did not—although highly significant—can be considered trivial.
Variables
Dutch Speaking Proficiency Test. This test was constructed by the Centraal Instituut Toetsontwikkeling (Central Institute Test Development) and the Bureau Interculturele Evaluatie (Bureau of Intercultural Evaluation)—two large test battery constructors in The Netherlands. The speaking test consists of 14 tasks. The candidates are, for example, asked to respond to the statement “In Dutch television a lot of ads are made for all kinds of products, even in the middle of a program. What is your opinion about ads on TV?” The examination took about 30 min. Candidates received detailed instructions through headphones and were subsequently asked to give oral responses to the tasks, which were recorded on tape. The tasks included different language tasks—for example, provide information, give instructions, congratulate, refuse, complain, apologize, state an opinion, tell a story, and so on. The use of dictionaries was prohibited. At least two experienced judges evaluated each recorded response independently. Language production was assessed on the functional language proficiency of the candidates. This implies that content was given more weight than form. The candidate’s score was the average of the scores assigned by the two judges (NT2 State Examination, 2008).
The candidate’s responses had to meet several criteria to be evaluated: They had to be audible, they had to be in Dutch, and they had to fit in with the situation described in the assignment. If these conditions were met, the responses were judged on content and correctness of Dutch. Additionally, other aspects played a role in the assessment: wording, pronunciation, pace, vocabulary, register, coherence, and word order. In total, language production was evaluated on approximately 60 items. When the judges disagreed on whether the candidate had passed the exam and the scores based on their evaluations differed by more than 20%, a third judge independently judged the candidate’s exam. The averages of the two closest judges’ scores were used to calculate the candidate’s score.
Dutch Writing Proficiency Test. This test consists of two kinds of tasks: Part A consists of eight short writing tasks, whereas part B is a single, more extended task. In part A, candidates, for example, had to complete the following sentences: “If […], the advertising agency will have to open a new branch,” or “The board of directors of a large truck factory has announced that 50% of its employees have to be fired next month because […].” In part B, candidates were provided with information, both textual and visual, on a rather complex process. For example, they had to describe how a marketer, commissioned by a city council, conducted research on the desirability of an indoor swimming pool, which ultimately resulted in the building of the pool. Candidates had to produce a short, logical, and coherent text that described this process adequately. The texts were judged on adequacy, grammatical correctness, spelling, coherence, composition, and word use. The judging procedure was virtually identical to the procedure used to evaluate the speaking assignments (NT2 State Examination, 2008).
In the present study, for all tests, a candidate’s first score was studied, which means that if, for instance, a candidate took the writing test more than once, because he or she failed the examination, only this candidate’s first score was included, whereas the subsequent scores were discarded. The difficulty of the examinations was held constant over time, by applying a specific application of an item response theory model—namely, the one-parameter logistic model (Verhelst, Glas, & Verstralen, Reference Verhelst, Glas and Verstralen1995), an advanced kind of Rasch model. Item response theory assumes that the probability of a correct answer on, for example, a language proficiency test item is a mathematical function of a person and an item parameter. A candidate’s language proficiency is a person parameter and varies across individuals. Item parameters include an item’s difficulty (some items are more difficult than others) and its discriminative function (some items discriminate better between less and more proficient candidates). A decisive advantage of item response theory models as compared to models based on classical test theory is that the test scores of candidates who took the exam on different occasions are allocated at the same ability distribution; hence, their test results can be analyzed simultaneously. Item response theory uses the term ability distribution to express a candidate’s proficiency level as measured by a given language proficiency test. By means of item response theory, candidates’ scores will be situated or located at the same distribution. To do so, parts of an older exam were used in the new exam (although the actual design was much more complex). The scores on the exam were standardized: 500 points or more implied that the candidate had passed the exam. A score of 500 points implies that a candidate has a proficiency at the B2 level (i.e., upper-intermediate level) as defined in the Common European Framework (Kuijper, Bergsma, & Bechger, Reference Kuijper, Bergsma and Bechger2004); it is equivalent to the International English Testing System (IELTS, 5.5 band score). In total, although data from 5,763 learners were available, not all learners who took the speaking proficiency test took the writing proficiency test, and vice versa. This restricted the number of learners who took the speaking and writing tests to 5,594 and 5,636, respectively.
Learner Characteristics
Age of arrival in The Netherlands. On the basis of the most current information on age and length of residence, age at time of arrival in The Netherlands was calculated. To check on nonlinear effects of age on migration, age on migration squared, and age on migration to the third power were also included in the analyses.
Length of residence. Candidates provided information on how long they had resided in The Netherlands. To check on nonlinear effects of length of residence, I also included the quadratic and cubic terms of length of residence.
Number of hours studying the Dutch language. Candidates were also asked how many hours they typically studied Dutch in an average week and for how many months they had done this. Based on this information, the number of hours that they used for studying the Dutch language was estimated. Its quadratic and cubic terms were used as well.
Years of education. Candidates were asked if they received secondary and tertiary schooling, and if so, for how many years. Based on this information, the number of years of education was calculated. Candidates who provided valid information on their tertiary education but failed to do so on their secondary schooling were excluded from further analysis. It must be noted that only candidates with a demonstrable amount of at least secondary schooling were allowed to take the STEX II exam. It could therefore be expected that the range of this educational variable would be restricted. As can be seen in Table 1, however, this is not entirely the case: The information on educational level was not always provided as accurately as was anticipated. Based on preliminary analyses, the impression is that some candidates overestimated the number of years in secondary and tertiary school, or both, whereas others did not provide any useful information at all. Here, too, I included the squared and third power terms.
Description of the sample

Gender. Females were coded as 1, males were coded as 0.
Context Characteristics
Genetic linguistic distance. The genetic linguistic distance scores were used; these scores measure the distance between the 11 West European languages considered in this study and the Dutch language (Cavalli-Sforza et al., Reference Cavalli-Sforza, Menozzi and Piazza1994).
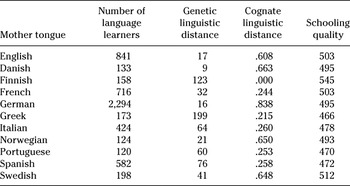
Cognate linguistic distance. The proportion of cognates of the Dutch part of the Swadesh 200-item list, extracted from Dyen et al. (Reference Dyen, Kruskal and Black1992) were used.Footnote 3 However, Finnish poses a problem because it is not an Indo-European language and, hence, it was not included in the Swadesh list. It is, therefore, assumed that the proportion of cognates between Dutch and Finnish was zero.Footnote 4 Both the scores on the genetic and the cognate linguistic distance measures for the 11 West European languages are presented in Table 2.
Distribution of participants by mother tongue, genetic linguistic distance, cognate linguistic distance, and schooling quality scores

Note
For Germanic, French, and English mother tongues, average schooling quality scores are weighted by country of origin.
Schooling quality. The Organisation for Economic Co-operation and Development regularly reports on student performance in secondary schooling in a large number of countries around the world. The mean of the average reading, mathematical, and science performance per country in 2003 was used as an indicator for schooling quality.Footnote 5, Footnote 6
Monolingual versus multilingual. Based on the language characteristics of the country of origin, a distinction between monolingual countries and multilingual countries (Belgium excluded) or Belgium was possible.
Description of the Sample
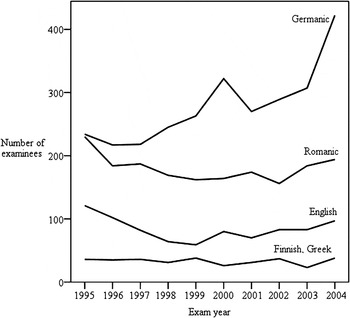
In Figure 1, the trend of candidates who took one of the examinations between 1995 and 2004 is presented, according to their mother tongue. For numerical reasons, the languages have been collapsed into four categories: the Romance languages, English, the Germanic languages (English excluded), and, finally, Finnish and Greek into a separate cluster. It is evident from Figure 1 that Germanic- and Romance-speaking candidates showed an increase from 1998 to 2004, whereas no apparent trend is observed for English-, Finnish-, and Greek-speaking candidates.
Number of West European migrant examinees in the Netherlands between 1995 and 2004.

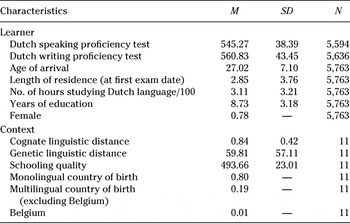
Tables 1 and 2 provide a description of the sample. Table 1 shows that the average candidate passed the examination (mean scores are above 500 points), although a rather large variation can be observed. The mean speaking test score of all candidates over all occasions was 545.27 (SD = 38.39), whereas the mean score for writing was 560.83 (SD = 43.45). The mean age of arrival was 27 years (SD = 7.10), whereas the average length of residence in The Netherlands was almost 3 years (SD = 3.76). Candidates spent, on average, 311 hr on lessons in Dutch, which does not seem very extensive; however, there is a great deal of variation because the standard deviation is 320 hr. Candidates received around 8.73 years of education beyond primary school. More females (78%) than males participated. Because approximately equal numbers of Western European men and women arrive in The Netherlands (Statline, 2008), this is contrary to the expectations. There may be several reasons for this female overrepresentation, but the two main reasons seem to be women’s greater willingness to learn the Dutch language and women’s spouses being Dutch.
With respect to the context level variables, it can be observed that both linguistic distance measures show substantial variation around their means. Students’ mean educational performance in 2003 (as measured by the Organisation for Economic Co-operation and Development data) also showed substantial variation among the countries involved. Finally, almost 80% of the candidates originated from monolingual countries and 1% originated from Belgium.
Table 2 gives a more detailed description of participants’ mother tongue. Nearly 40% of the candidates originated from German-speaking countries; mainly from Germany. It can be seen that substantive proportions also descend from English- and Romance-speaking countries. Additionally, Table 2 presents the results of the genetic and cognate linguistic distance scores adopted from Cavalli-Sforza et al. (Reference Cavalli-Sforza, Menozzi and Piazza1994) and McMahon and McMahon (Reference McMahon and McMahon2005). Table 2 also illustrates that Finnish candidates have the highest schooling quality scores, whereas Greek, Portuguese, and Spanish students have the lowest schooling quality scores. Examinees’ scores from the remaining countries fall in between those values.
Analyses
Given the hierarchical nature of the data (learners nested in mother tongues), multilevel analysis is appropriate (Snijders & Bosker, Reference Snijders and Bosker1999). MLwiN 2.10 (Rasbash, Steele, Browne, & Prosser, Reference Rasbash, Steele, Browne and Prosser2004) was used to perform the multilevel regression analyses.Footnote 7 Multilevel analysis has initially been developed to explain the variation in educational performances of students—for instance, variation in language proficiency (e.g., Van der Slik, Driessen, & De Bot, Reference Van der Slik, Driessen and De Bot2006). This type of analysis proved that individual student performances were not just dependent on characteristics at the student level (e.g., parents’ educational level and income) but also on characteristics at the classroom or the school level (e.g., public or private, ethnic or socioeconomic composition). Before the introduction of multilevel analysis, it was common practice to treat these classroom- or school-level characteristics as individual-level characteristics, which is inappropriate because the standard errors of the classroom- or school-level effects are severely underestimated and the likelihood of a Type I error (rejecting a true null hypothesis) increases substantially. Multilevel software like MLwiN can handle the occurrence of different measurement levels simultaneously and will produce the correct standard errors for effects at each level. Although initially developed for studying educational outcomes of students nested within classrooms (e.g., within schools), today multilevel analysis is broadly used for the analysis of a variety of hierarchically structured data.
In performing multilevel analysis, it is common practice to start with an empty null model to test if multilevel analyses would be meaningful. This is the case if there is variation at the higher measurement level (e.g., classrooms). Next, explanative variables at the individual level are added, initially to test if this results in a significant improvement in fit compared to the preceding, more parsimonious null model. The improvement in fit indicates that the model fits the data better, and this is tested by means of the log-likelihood ratio, which follows a chi-square distribution. If the improvement in fit is significant, it will be important to check whether the effects are in the predicted direction because improvement in model fit does not necessarily mean that the hypotheses are supported. Therefore, a distinction has to be made between models and hypotheses. In the present study, all individual-level characteristics are included in, what has been designated as, the baseline model. A separate null model and a baseline model have been conducted for Dutch speaking and writing proficiency. Finally, the hypotheses on the context characteristics are represented by the models A through C2 and will be tested in the same way as the individual-level hypotheses.
To test for the meaningfulness of multilevel analysis, within-mother-tongue variation was compared with between-mother-tongue variation for the dependent variables of Dutch speaking and writing proficiency. Multilevel analysis indeed appeared to be appropriate: For Dutch speaking and writing proficiency, an intraclass correlation of .21 and .17, respectively, was found, which means that 21% and 17% of the variation in proficiency scores was due to between-mother-tongue variation (Snijders & Bosker, Reference Snijders and Bosker1999). Such an amount of variation is considered substantial. The remaining 79% and 83% was due to within-mother-tongue variation. Next, to test for effects of learner-level characteristics, the baseline models were tested by adding learner-level characteristics to these null models. If quadratic and cubic terms proved to be nonsignificant, they were removed from the analyses.Footnote 8 Finally, context-level characteristics were added to these baseline models to test the context-level hypotheses. To provide a complete picture of the results, not only the final models but also the preceding and more parsimonious models are presented here. In this way, the impact of additional variables can be evaluated appropriately. Because the log-likelihood ratio follows a chi-square distribution, a given model is considered to have a better fit than a preceding, more parsimonious model if the difference in the log-likelihood ratio is at least 3.84 against 1 degree of freedom. The direction of the effect sizes of the added variables are used to test the accompanying hypotheses only if a model has a better fit than a preceding, more parsimonious model. If the improvement in fit is not significant, the accompanying hypotheses are refuted.
RESULTS
Prediction of Dutch Speaking and Writing Proficiency
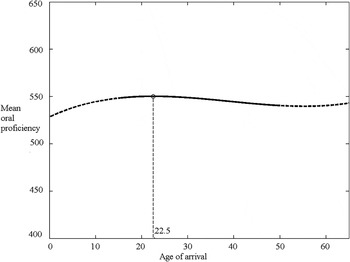
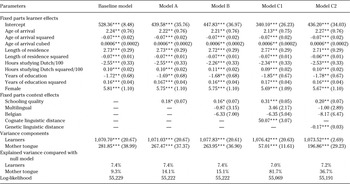
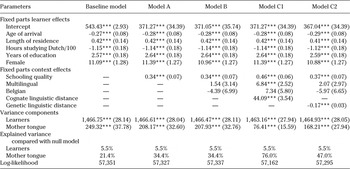
The results of the multilevel analyses that pertain to language proficiency are presented in Tables 3 and 4. The outcomes of the learner characteristics will be presented before discussing the hypothesis on the effect of mother tongue as measured by the cognate and genetic linguistic distance. The baseline models fit significantly better to the data than the preceding null models because the improvement in log-likelihood ratio is 436 against 10 degrees of freedom for speaking proficiency and 343 against 5 degrees of freedom for writing proficiency. The age of arrival hypothesis was confirmed for written proficiency in Dutch (B = −0.27, p < .001): The older the migrants were on their arrival, the less skilled they were in written Dutch. Both the squared and cubic terms of age of arrival were found to be nonsignificant and, hence, were eliminated from the final analyses. This means that the effect of age of arrival can adequately be described as a linear function. For speaking skills in Dutch, both the first-order and the squared and cubic terms of age of arrival proved to be significant, which makes the test of the age of arrival hypothesis a bit complicated. For that reason, the arithmetic function of age of arrival is provided in Figure 2. It has to be emphasized that age of arrival scores are empirically restricted, because approximately 98% of the candidates were 15–50 years of age when they arrived in The Netherlands, which means that the mean speaking skills of immigrants who would have been older than 50 at their arrival cannot be predicted (although it seems rather unlikely that their oral proficiency would increase as compared to those who arrived when they were 50).
Speaking proficiency in Dutch as a function of age of arrival.

Parameters of multi-level models for Dutch speaking proficiency

Note
Standard errors are given in parentheses. The reference categories are male and monolingual. The baseline model tests the learner characteristics hypotheses, model A tests the quality of school hypothesis, model B tests the multilingual hypotheses, model C1 tests the cognate linguistic distance hypothesis, and model C2 tests the genetic linguistic distance hypothesis.
*p < .05; ** p < .01; *** p < .001.
Parameters of multilevel models for Dutch writing proficiency

Note
Standard errors are given in parentheses. The reference categories are male and monolingual. The baseline model tests the learner characteristics hypotheses, model A tests the quality of school hypothesis, model B tests the multilingual hypotheses, model C1 tests the cognate linguistic distance hypothesis, and model C2 tests the genetic linguistic distance hypothesis.
*** p < .001.
It seems rather clear that the age of arrival hypothesis was also confirmed with respect to speaking proficiency. In line with previous studies (Chiswick & Miller, Reference Chiswick and Miller2008; Flege et al., Reference Flege, Yeni-Komshian and Liu1999; Johnson & Newport, Reference Johnson and Newport1989), the degree of speaking proficiency in Dutch decreased in a nonlinear fashion when learners arrive in The Netherlands at older ages and tended to reach a minimum level when migrants are 50 or older at their arrival. In other words, when all other learner characteristics such as length of residence are taken into account, the estimated average speaking proficiency scores of candidates who arrived at age 50 were on average 20 points lower than those of examinees who arrived at age 21;5.
The effect of length of residence on Dutch speaking proficiency was found to be strong for candidates who had just arrived but to decrease when candidates had resided in The Netherlands for a longer period. Hence, the hypothesis on length of residence was supported for speaking skills. For writing skills, the length of residence hypothesis was only partially supported, because the positive effect of length of residence did not decrease as years go by, which suggests that candidates continue to improve their writing skills.
The hypothesis on the impact of the number of hours studying the Dutch language was refuted for both speaking and writing proficiency in Dutch. Rather than a positive effect of the number of hours studying Dutch, a significant negative—difficult to explain—effect was found on both speaking and writing proficiency in Dutch. The hypothesis on the impact of education was supported for writing proficiency in Dutch because a highly significant positive effect (B = 2.57, p < .001) was found. The hypothesis was refuted for the effect of years of education on oral proficiency. Initially, this effect was negative, but it transformed into a positive effect when candidates received more than 12.5 years of education. This outcome is considered too meager to confirm the hypothesis on the impact of education. As predicted, it was found that female candidates performed significantly better than male candidates, particularly in the writing section of the test.
In models A, the effect of schooling quality is included. Models A fit significantly better than the baseline models because the drop in log-likelihood ratios for speaking and writing proficiency is 7 and 24 points, respectively, against 1 degree of freedom. Because the effect of schooling quality was highly significant and in the predicted direction for both speaking and writing skills in Dutch, the hypothesis that candidates originating from countries with high schooling quality will be more proficient in Dutch was supported. The hypotheses on the multilingual or monolingual character of the country of origin (i.e., that learners from multilingual countries, especially those from Belgium, will have a higher proficiency in Dutch than learners from a monolingual country) were tested by means of models B. No decrease in the log-likelihood ratios can be observed; hence, both hypotheses appeared to be refuted.
Model C1 pertains to the cognate linguistic distance hypothesis, whereas model C2 bears on the genetic linguistic distance hypothesis. It is evident from the log-likelihood ratios that both models fit significantly better than the preceding models B. For speaking proficiency, the fit improvement is 153 and 31 against 1 degree of freedom for the cognate and the genetic distance measure, respectively; for writing proficiency, these fit improvements are 165 and 32 against 1 degree of freedom. The effect parameters for cognate and genetic linguistic distance are in the predicted direction, which suggests that both the cognate and the genetic linguistic distance hypotheses are supported. For speaking proficiency, the effect parameters for cognate and genetic linguistic distance are .50 (p < .001) and −.17 (p < .001), respectively; for writing proficiency, they are .44 and −.17 (both p < .001), respectively. It is interesting to note that as a result of adding the cognate linguistic distance measure, the efficiency of the remaining context-level parameter estimates has improved rather substantially as well, because all standard errors have decreased. As a consequence, the positive effect of being born in a multilingual country on writing proficiency in Dutch has now also become significant. Thus, for writing proficiency in Dutch, the hypothesis on the multilingual or monolingual character of the country of origin seems to be confirmed after all.
It was already reported that 21% and 17% of the variation in oral and written proficiency, respectively, was accounted for by variation between mother tongues, whereas the remaining 79% and 83% occurred at the individual learner level. Tables 3 and 4 show that compared to the null models, the baseline models explained 9.3% and 21.4% of the variance, respectively, at the mother-tongue level and about 7% and 5% at the individual-learner level. The inclusion of quality of schooling (models A) did not provide any additional explanation at the learner level because the explained variance remained constant at 7.4% and 5.5%, respectively, compared to the baseline model. However, adding schooling quality improved the explanative power at the mother-tongue level rather substantially to 14.1% and 34.4% for speaking and writing skills, respectively. The inclusion of the variables that pertain to the hypotheses on the multilingual or monolingual character of the country of origin did not result in an increase of explained variance, neither at the learner nor at the mother-tongue level. The inclusion of the linguistic distance measures presents an entirely different picture, however. At the mother-tongue level, the explained variance for speaking proficiency rose abruptly from 15.1% to 81.7% when cognate linguistic distance was added. For writing proficiency, although not as impressive, there was an increase in explained variance of 41.6% compared to model B. In contrast, the inclusion of the genetic linguistic measure cannot match this rise in fit because the improvement of explained variance ranges from 12.6% to 21.6%. Therefore, it is quite clear that, as predicted, the explanative power of the cognate linguistic distance measure was much greater than the explanative power of the genetic linguistic distance measure.
Linguistic Distance Revisited
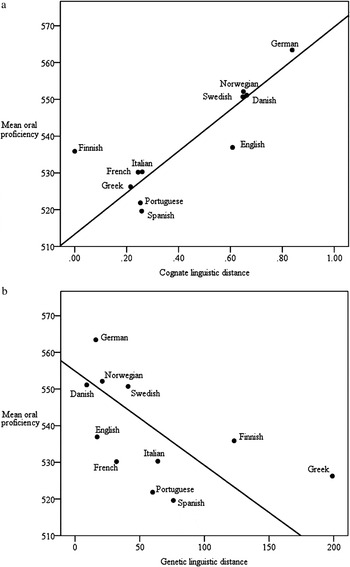
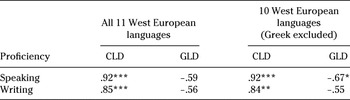
To gain a more comprehensive picture of the relationship between mother tongue and linguistic distance, the proficiency scores at the mother-tongue level were aggregated and weighted by the number of candidates for each mother tongue. These weighted mean scores for oral and written proficiency in Dutch were then correlated with the cognate and genetic linguistic distance measures (see Table 5). A scatter diagram of the relationship between the mean proficiency scores and the two linguistic distance measures revealed the Greek language to be an outlier in relation to the genetic measure (see Figure 3b). Therefore, the calculations were repeated only with the 10 other West European languages.
Mean oral proficiency scores: (a) cognate linguistic distance; (b) genetic linguistic distance.

Correlations between mean proficiency scores and cognate linguistic distance (CLD) or genetic linguistic distance (GLD)

*p < .05; **p < .01; ***p < .001.
In Table 5, it is not surprising to observe that the mean levels of mastery of learners with different mother tongues were strongly correlated with the cognate linguistic distance measure (McMahon & McMahon, Reference McMahon and McMahon2005). These correlations vary between .85 and .92 and suggest that the overlap between the scores on the different measures of linguistic distance varies between 72% and 85% (i.e., correlations squared). Setting the language scores of Greek examinees aside did not affect these correlations. This correlation between the mean levels of mastery of learners with different mother tongues and the linguistic distance measure, however, does not apply to the genetic linguistic distance measure of Cavalli-Sforza et al. (Reference Cavalli-Sforza, Menozzi and Piazza1994) because the correlations with the mean proficiency scores are, with one exception, nonsignificant. The overlap can only be observed when the scores of Greek-speaking migrants are omitted (45%), but it seems rather clear that, unlike the cognate linguistic distance scores, the genetic linguistic distance scores were unsuitable to account for the mean proficiency scores. The scatter diagrams presented in Figure 3 underscore this conclusion because the cognate distance scores and the mean proficiency scores were found to fit onto the ordinary least square regression line to a much higher degree than the observations for the genetic distance scores and the mean proficiency scores (which seem to be scattered more or less randomly).Footnote 9
DISCUSSION
This study is a contribution to research on the role of mother tongue on the acquisition of an additional language in several ways. A large-scale database was used: It contains data of nearly 6,000 L2 learners from 11 Western European countries on two direct measures of language fluency—namely, test scores on speaking and writing proficiency in Dutch. The combination of objective proficiency measures with the large-scale nature of the database is quite unique in SLA research and allowed for the test of a variety of hypotheses not studied in depth yet.
Multilevel analysis techniques were conducted to test hypotheses on both the learner and the mother-tongue level. At the learner level, most of the hypotheses were supported, although the effects on speaking proficiency were all nonlinear, whereas these effects were linear for writing proficiency. It is difficult to explain why the effect for oral fluency was more complex. One of the reasons might be that the improvement of written proficiency has no end state, whereas there is an end state to the improvement of speaking skills. It is intriguing that the effect of number of hours studying the Dutch language was highly significant but opposite to the predicted direction for both speaking and writing proficiency: Learners who studied more received, on average, lower exam scores than learners who studied less. One possible explanation might be that learners whose L1 is more distant from Dutch studied more than learners whose mother tongues were more closely related to Dutch but did not succeed in receiving comparable exam results. This hypothesis might be tested by examining the effects of learner and context characteristics on the number of hours studying Dutch, but this is the topic of another study.
Context or country-of-origin characteristics have been examined in addition to learner characteristics. The country of origin’s quality of schooling was found to have a positive impact on oral and written proficiency in Dutch, which is quite remarkable, because all countries included in this study are highly developed Western European countries. It may thus be hypothesized that the impact of a country’s schooling quality on SLA is even more pronounced for migrants from less developed non-Western countries.
Perhaps most important, the various analyses employed in this study have shown rather convincingly that the impact of the mother tongue could be modeled by means of the cognate linguistic distance measure, adopted from McMahon and McMahon (Reference McMahon and McMahon2005). Between 40% and 60% of the variation between mother tongues can be accounted for by the cognate linguistic distance measure. This study also revealed that the explanative power of the highly contested genetic linguistic distance measure (Cavalli-Sforza et al., Reference Cavalli-Sforza, Menozzi and Piazza1994) is rather poor, which suggests that the variation in Dutch language fluency can be explained to a much lesser extent by means of this measure.
A disadvantage of the cognate linguistic distance measure compared to the genetic distance measure is that it is a rather limited measure; only Indo-European languages are included. The outcomes of this study may therefore comprise an encouragement for linguists to develop alternative linguistic distance measures as explanations for why L2 learners with mother tongues outside the Indo-European language family experience varying degrees of difficulties in acquiring an additional language. The attractiveness of large-scale databases such as the one used in the current study is that they can be used to empirically test the validity of linguistic distance measures based on linguistic features other than degree of genetic or vocabulary resemblance. The development of such measures may thus enhance our knowledge of why some combinations of structural linguistic features are more important for the explanation of the variation of SLA than others. In this respect, the world atlas of language structures project (Haspelmath et al., Reference Haspelmath, Dryer, Gil and Comrie2005) seems to offer a promising avenue of research.
It needs to be emphasized that speaking and writing skills pertain to the productive aspects of language proficiency. Although these skills form perhaps the most central aspects of language proficiency, it remains to be seen if the results of the present study can be replicated with the receptive skills. The database used here is age-restricted; that is, the vast majority of the candidates were at least 15 years old when they arrived in The Netherlands. For this reason, the critical period hypothesis (Johnson & Newport, Reference Johnson and Newport1989) could not be tested adequately because, when they arrived, virtually all candidates had passed the critical period. Although Figure 2 seems to indicate that speaking proficiency increases until candidates are 20 years old and will increase again when candidates are older than 55, it must be emphasized that conclusions based on extrapolations of the age of arrival function outside its empirical borders are unwarranted. It does not seem unlikely that a logistic curve—perhaps best described as a mirror image of a stretched S-curve—would be more appropriate to model the age of arrival function should test results of older candidates become available.
Another potential drawback of this study is that relationships between motivational and attitudinal factors could not be studied because these data were not collected. It has been noted, however, that the sample of candidates was partly self-selected; that is, the majority of candidates took the exams voluntarily. Because candidates took the test voluntarily, little variation in motivational and attitudinal factors is to be expected; these factors would thus not explain the results any further.
The outcomes of this study might be of use in a variety of settings. First, the results might encourage social scientists to employ more extended measures for cognate linguistic distance that might help explain why, all other things being equal, learners with a variety of L1s display various degrees of difficulty in acquiring a L2. Such a project will be completed in the near future by including all Indo-European languages available in the database. In the long run, this line of research will be extended to the study of languages outside of the Indo-European language family. Many linguists have studied which linguistic features are responsible for this variation in the difficulty to acquire another language. The results of the current study might be used to examine, more systematically perhaps than previously, the contribution of these linguistic features. Second, L2 teachers have long recognized in their daily practice this variation in the difficulty to acquire another language across students from different linguistic backgrounds. However, these teachers’ knowledge is often fragmented and built on accidental observations. The current study presents a more systematic picture of how and to what extent different mother tongues hamper the acquisition of L2s that are more or less distant to learners’ mother tongue. The current findings might therefore help improve teaching materials for migrants with different mother tongues. Additionally, the findings of the current study might help to explain why some learners need more time than others to reach a certain level of fluency—knowledge that could be incorporated in course development. Third, for those politicians and policy makers of the host country who are occasionally ignorant of the language difficulties that immigrants face, perhaps the results of this study can provide some insight into why, for instance, older migrants with mother tongues not belonging to the Indo-European language family are virtually incapable rather than unwilling—as sometimes is assumed—to acquire the dominant language of the host country. Perhaps that insight softens the relentless strive for language assimilation that can occasionally be observed in some Western European countries, at the expense of the parental authority of older migrants.