I. INTRODUCTION
Amorphous polymers are major components of both naturally occurring and synthesized adhesive materials, yet many simple effects including the interplay between crosslink density and the molecular scale mechanisms that control adhesive performance remain poorly understood. In nature, such adhesive materials are often found to play an important functional role at diverse material interfaces. For example, spider silk uses groups of branching silks as glue to achieve adhesion that is able to secure the edges of web structures subjected to wind or impact loading. Reference Pugno, Cranford and Buehler1,Reference Cranford, Tarakanova, Pugno and Buehler2 Other examples include gecko feet, mussel and barnacle adhesion plaques, and amyloid protein biofilms, which generally also achieve impressive adhesion through amorphous protein structures which have only weak interactions such as van der Waals forces. Reference Barlow, Dickinson, Orihuela, Kulp, Rittschof and Wahl3–Reference Qin and Buehler8 The fascinating interfacial mechanics of these materials are found to be derived from the cooperative and synergistic integration of their building blocks, Reference Buehler9 and these natural adhesives possess mechanisms to maximize adhesive performance in a variety of environments; they could prove invaluable as inspiration for the design of new synthetic adhesives. To apply these concepts to synthesized amorphous polymer adhesives, however, it is critical to understand how the mechanics and chemical interaction of the constituent polymer chains can be designed and tailored to control deformation mechanisms at the molecular scale and ultimately optimize the adhesive response.
One of the most common applications of synthesized amorphous polymer adhesives is in pressure sensitive adhesives (PSAs), used in both industrial and consumer grade tape and label products, in which temporary adhesion to diverse surface types is required. These adhesives are characterized by their ability to form an adhesive bond just by the application of a small compressive force, as well as the ability to be completely removed without leaving a residue upon debonding. Reference Creton10,Reference Krenceski and Johnson11 PSAs are commonly made from a variety of polymers of low glass transition temperatures including natural rubbers, acrylics, and styrenic block copolymers. Reference Creton10,Reference Khan and Poh12 They are very different from many irreversible adhesives such as epoxies that undergo some form of curing or setting process with phase transformations, which results in a drastic change in rheological properties, as well as the formation of chemical bonds between the adhesive and adherend. In contrast, amorphous polymer PSAs do not undergo any phase transformations and they achieve adhesion in a similar manner to many natural adhesives, solely in the solid state via van der Waals interactions. Reference Creton10,Reference Khan and Poh12–Reference Zosel14
The performance of amorphous polymer adhesives is strongly dependent on the rheological properties of the constituent polymers. There is a clear tradeoff in performance with changes in the stiffness of the polymer. In general, the stiffness must be low enough that the adhesive is able to deform and make sufficient contact with a surface as described by the Dahlquist criterion, Reference Dahlquist and Patrick15 but the stiffness must also be large enough to provide sufficient resistance to deformation and to prevent cohesive failure. Reference Khan and Poh12 Furthermore, a significant viscous response is desirable to promote energy dissipation during debonding. Reference Gent and Schultz16 Molecular weight can also have an important effect on adhesive response. Reference Creton10–Reference Khan and Poh12,Reference Poh, Giam and Yeong17–Reference Poh and Yong20 Low molecular weight polymers are found to perform well in peel and tack tests due to their ability to flow (increased wettability) but they perform poorly in shear. A higher molecular weight can lead to an optimal adhesive response. Reference Poh and Yong18 Another factor that has been investigated extensively is the inclusion of tackifying resins and fillers. Reference Khan and Poh12,Reference Poh, Lee and Chuah21–Reference Tobing and Klein24 As with the molecular weight, the tack response is found to increase initially with increased concentration of tackifier and reaches an optimal response before decreasing with further addition of tackifier. The extent of crosslinking is yet another important factor, which plays in important role in PSA performance. Previous work has shown that an optimal degree of crosslinking in terms of the tack exists just above the gel point, Reference Zosel25 however the extent to which crosslinking affects properties such as elastic modulus and the total work required to debond, as well as the molecular mechanisms, which play a large role in adhesive performance have not been extensively studied.
Simple coarse-grained polymer models have proven extremely useful in elucidating polymer properties and behaviors at scales which currently are not accessible with experimental techniques. Such models have successfully been used to investigate a broad range of polymer systems including basic dynamics and structure of amorphous polymers, Reference Auhl, Everaers, Grest, Kremer and Plimpton26,Reference Kremer and Grest27 adhesion of end-tethered polymers, Reference Sides, Grest, Stevens and Plimpton28,Reference Sides, Grest and Stevens29 and properties of highly crosslinked network polymer adhesives. Reference Stevens30–Reference Tsige and Stevens33 Similar models have also been used to demonstrate the importance of the coupled effects of polymer–polymer and polymer–surface interactions in determining the elastic and adhesive properties of polymer films. Reference Xia and Keten34,Reference Xia, Mishra and Keten35 Here, we use a simple coarse-grained polymer model to directly investigate the extent to which crosslinking affects the adhesive response of amorphous polymer adhesives. We provide qualitative and quantitative insights into how the degree of crosslinking affects adhesive response and we examine molecular scale mechanisms that can be harnessed to tune and ultimately optimize the adhesive performance.
II. MODEL AND METHODS
A. Coarse-grained polymer model
We use a simple bead-spring polymer model based on that of Kremer and Grest. Reference Auhl, Everaers, Grest, Kremer and Plimpton26,Reference Kremer and Grest27 The polymer chains are treated as a string of spherical beads of mass m, which interact via a total energy described by the sum of nonbonded, bonded, and angle interactions:
 $$E = E_{\rm{b}} + E_{\rm{\theta }} + E_{{\rm{NB}}} =\; \mathop \sum \limits_{{\rm{Pairs}}} {\rm{\varphi }}_{{\rm{LJ}}} \left( {r_{ij} } \right) + \mathop \sum \limits_{{\rm{Bonds}}} {\rm{\varphi }}_{\rm{b}} \left( {r_{ij} } \right) + \mathop \sum \limits_{{\rm{Angles}}} {\rm{\varphi }}_{\rm{\theta }} \left( {{\rm{\theta }}_{ijk} } \right)$$
 $${\rm{\varphi }}_{{\rm{LJ}}} \left( {r_{ij} } \right) = 4{\rm{\varepsilon }}\left[ {\left( {{{\rm{\sigma }} \over {r_{ij} }}} \right)^{12} - \left( {{{\rm{\sigma }} \over {r_{ij} }}} \right)^6 } \right]\quad r_{ij} \lt r_{\rm{c}}$$
 $${\rm{\varphi }}_{\rm{b}} \left( {r_{ij} } \right) = - 0.5K_{\rm{b}} R_{\rm{0}}^{\rm{2}} {\rm{ln}}\left[ {1 - \left( {{{r_{ij} } \over {R_{\rm{0}} }}} \right)^2 } \right] + {\rm{\varphi }}_{{\rm{LJ}}} \left( {r_{ij} } \right)$$
 $${\rm{\varphi }}_{\rm{\theta }} \left( {{\rm{\theta }}_{ijk} } \right) = K_{\rm{\theta }} (1 + \cos {\rm{\theta }})$$
All parameters used in the present work are described in reduced Lennard-Jones units; all distances and energies are defined in terms of the parameters σ and ε, respectively, and all other quantities are derived from them. Here the cutoff distance r c = 2.5σ, the bond stiffness K b = 30 ε/σ2, the maximum bond length R 0 = 1.3σ, and the bending stiffness K θ = 1.5ε. The model is implemented in the LAMMPS simulation package Reference Plimpton36 ; visualizations are performed with VMD. Reference Humphrey, Dalke and Schulten37
B. Generation of amorphous polymer structures
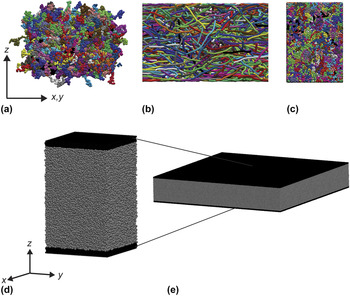
Amorphous polymer melt structures are created following a simple three-step process shown schematically in Fig. 1. First, the initial geometry is created by defining the simulation box and building independent random walk chains inside the box. The random walk chains are created in a stepwise manner; the position of the first bead or monomer unit is chosen at random and then subsequent beads or monomers are placed by randomly picking a point on the surface of a sphere Reference Marsagli38 of radius r 0 (where r 0 is the equilibrium bond length between beads or monomers) and placing the next bead or monomer at that point. Each generated structure comprises 1000 chains with 100 beads per chain.
Representative snapshots from the three phases of structure preparation. The different colors indicate beads belonging to different chains. Panel (a) shows the initial random walk structure in which the chains are highly overlapped. Panel (b) shows the structure following the relaxation process. This structure is a dilute collection of mostly extended chains. Panel (c) shows the final structure following the equilibration and crosslinking steps. The structure becomes much more dense and the chains are highly entangled. A single unit cell with adhesive walls is shown in (d); a 9 × 9 array of unit cells is shown in (e) which demonstrates the thin film geometry achieved with the periodic boundary conditions.

The second step of the process is a relaxation of the overlapped structure that is implemented with simple microcanonical [NVE ensemble of fixed number of particles (N), a fixed volume (V), and a fixed energy (E)] molecular dynamics (MD). All MD simulations are run with the LAMMPS simulation package Reference Plimpton36 with a time step of Δt = 0.006τ, where τ = σ(m/ε)1/2. During the relaxation process, the nonbonded (Lennard-Jones) interactions are replaced by a soft repulsive potential of the form
 $${\rm{\varphi }}_{ij} = A\left[ {1 + \cos \left( {{{{\rm{\pi }}r_{ij} } \over {r_{\rm{c}} }}} \right)} \right]\quad r_{ij}\; \lt\; r_{\rm{c}}$$
where r c = 3σ. Over the course of the relaxation phase, the value of A (the strength of the repulsive potential) is slowly ramped from zero to 15ε over 2 × 10⁵ steps, and then the value is held there for an additional 3 × 10⁵ steps. The final structure after relaxation comprises a dilute collection of extended chains [Fig. 1(b)].
The final step for creating the polymer melt geometries is equilibrating the relaxed structure with isothermal–isobaric [NPT ensemble of constant temperature (T) and constant pressure (P)] MD to form a dense amorphous geometry. The equilibration consists of three steps: initial equilibration at high temperature to promote dynamic mixing of the chains and remove any structural artifacts introduced through the initial structure definition and relaxation process, low temperature equilibration and formation of crosslinks, and final equilibration of the crosslinked structure. The high temperature equilibration is performed at a temperature of T = 2.5ε/k B for 7 × 10⁵ steps, followed by a low temperature run at T = 1.0ε/k B for 8 × 10⁵ steps. Following the crosslinking step (described below), a final equilibration run is performed at T = 1.0ε/k B for 4.9 × 10⁵ steps.
Over the course of the structure preparation process, a film-like geometry is enforced by imposing periodic boundary conditions in the x- and y-directions and fixed boundary conditions with wall potentials in the z-direction [Figs. 1(d) and 1(e)]. For the relaxation and initial equilibration steps, simple reflecting walls are used to confine the chains in the z-direction; for the subsequent equilibration steps, the reflecting walls are replaced by walls which interact through a 9-3 Lennard-Jones potential:
 $${\rm{\varphi }}_{{\rm{wall}}} (r) = 4{\rm{\varepsilon }}_{{\rm{wall}}} \left[ {\left( {{{{\rm{\sigma }}_{{\rm{wall}}} } \over r}} \right)^9 - \left( {{{{\rm{\sigma }}_{{\rm{wall}}} } \over r}} \right)^3 } \right]\quad r \;\lt\; r_{\rm{c}}^{{\rm{wall}}}$$
with εwall = ε, σwall = 2σ, and r c wall = 6σ. This wall potential approximates the interaction with the explicit walls used to investigate adhesive performance (described below) and the parameters are chosen such that the polymer–polymer and polymer–wall interactions are similar in strength. All of the wall potentials are positioned such that the total thickness of the structure is maintained at ∼60σ. During the equilibration phase, a zero pressure boundary condition is maintained in the x- and y-directions to allow the structure to achieve a dense, stress-free configuration.
C. Polymer crosslinks
Crosslinking is enabled in these structures via the incorporation of three distinct bead types during the generation of the initial structure. Beads designated as “type 1” are not allowed to form crosslinks, whereas those designated as “type 2” are able to form crosslinks. Once a crosslink is formed, the two beads that form the crosslink are changed to “type 3.” Aside from the ability to form crosslinks, the three bead types are identical. When creating the initial random walk structure, each bead is assigned as type 1 or type 2 with a prescribed probability ranging from 0 (no crosslinkable beads) to 0.1, and the restriction that type 2 beads are not allowed to be adjacent on the same chain to prevent crosslinking between beads which are already bonded. During the structure equilibration process, a reaction step is implemented in which two type 2 beads within 1.1 r 0 are allowed to form a crosslink; the final crosslink density can be controlled by adjusting the initial concentration of type 2 beads as well as the duration of the reaction step. In the present work, 1 × 10⁴ steps are allowed for the reaction step. All crosslinks are described by the same parameters as bonds within chains and are thus considered covalent crosslinks.
D. Assessment of adhesive performance
A simple tack test is performed to characterize the adhesive performance of the crosslinked amorphous polymer structures. This test is performed with canonical [NVT ensemble of constant volume (V) and constant temperature (T)] MD with periodic boundary conditions in the x- and y-directions. The Lennard-Jones wall potentials used in the equilibration are replaced by three layers of beads arranged in an FCC lattice with the (1 1 1) face oriented along the z-direction and a lattice constant of 1.204σ; similar setups have been successfully used to assess adhesive performance in previous work.
Reference Tsige and Stevens33
The beads in the walls interact with the polymer beads via Eq. (2) with εwall = ε, σwall = 2σ, and r
c
wall = 6σ, but do not interact with each other. The walls are treated as independent rigid bodies; the bottom wall is held fixed and the top wall is allowed to move. Before performing the tack test, an initial compression step is carried out in which a constant stress of −0.2ε/σ3 is applied to the top wall for 2.5 × 10⁵ steps to promote adhesion to the walls. The tack test is then performed by displacing the top wall at a constant velocity of
 $\dot z = 0.002\,{\rm{\sigma }}/{\rm{\tau }}$
. We note that the strain rate can be an important factor in polymer film mechanics, but single strain rate is used for all simulations in the present work to isolate the effects of crosslinking in determining the mechanical response. Adhesive performance is assessed through the stress–strain response, including changes in the elastic modulus and the plateau stress. Importantly, the toughness modulus is calculated from the area under the stress–strain curve for each case as it provides a measure of the energy dissipated per unit volume during the debonding process. A total of three tack test simulations are performed for each crosslinked structure to account for stochastic effects; an additional 100,000 equilibration steps are performed prior to the inclusion of the adhesive walls to sample a new configuration. The results for the adhesive performance are obtained by averaging the results from the three runs; error bars indicate the minimum and maximum observed values.
III. RESULTS AND DISCUSSION
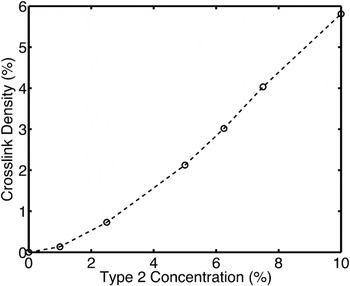
Seven crosslink densities, ranging from 0 to 5.81% are investigated. Figure 2 shows the final crosslink density in the amorphous structures as a function of the initial concentration of crosslinkable beads; here the crosslink density is defined as the fraction of beads involved in crosslinks:
 $${{\rm{\rho }}_{{\rm{xl}}}} =\, {{{N_3}} \over {{N_{{\rm{total}}}}}}\, =\, {{2{N_{{\rm{XL}}}}} \over {{N_{{\rm{total}}}}}}$$
Variation of final crosslink density with the concentration of crosslinkable (type 2) beads. We study seven crosslink densities ranging from 0 to 5.81%.

The factor of two arises since two beads participate in each crosslink. We note that these crosslink densities are not unique; the final value depends on the number of steps allowed for the reaction phase. In the present work, we have chosen to limit the number of steps allowed for the reaction to 1 × 10⁴ to sample a representative range of crosslink densities.
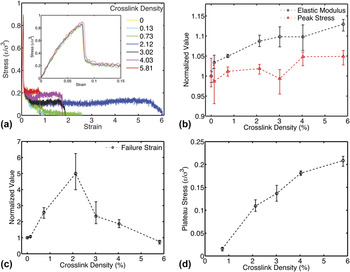
The stress–strain responses of the seven structures investigated are shown in Fig. 3(a); the inset shows the low strain response. All of the structures initially feature a similar elastic response followed by a sudden drop in the stress, which corresponds to the initial formation of a defect (void) in the material. These results show excellent qualitative agreement experimental results for PSA tack tests in which an initial peak in the force–displacement response is followed by a drop in the force to a plateau value which extends to larger displacements. Reference Creton10–Reference Khan and Poh12,Reference Zosel14,Reference Dahlquist and Patrick15,Reference Zosel25 The specific responses in the elastic regime are plotted in Fig. 3(b) with all values normalized by the response of the non-crosslinked structure. As expected, the elastic modulus increases with increasing crosslink density due to the extra connectivity in the network, however the increase is modest – the highest crosslink density studied only resulted in an 11% increase in the elastic modulus. A similar trend is observed in the value of the peak stress achieved in the elastic regime. For most of the structures considered, crosslinking results in an increase in the peak stress compared to the non-crosslinked structure, but again the effect is modest indicating that crosslinking alone is not an optimal strategy for enhancing the mechanical response of amorphous polymers in the small strain regime.
Panel (a) shows the stress–strain response of the seven structures investigated; the inset plots the small strain (elastic regime) response. Panel (b) shows the variation of the elastic modulus and peak stress as a function of crosslink density. Panel (c) shows the strain-to-failure with increasing crosslink density. Panel (d) plots the plateau stress versus the crosslink density. The lowest two crosslink densities are excluded since those structures failed before supporting a steady applied stress. The mean value from three tack test simulations are plotted with error bars showing the minimum and maximum observed values.

In contrast, crosslinking has a dramatic effect on the stress–strain response in the post-elastic regime. For the lowest two crosslink densities (0% and 0.13%), the response is quite similar with a gradual decrease in the stress until failure. Once the crosslink density is increased to 0.73%, however, the structure is able to sustain a nonzero stress (the plateau stress) to a much higher strain before failing. As the crosslink density is increased to 2.12%, a very large change in the response is observed as the additional connectivity allows for the polymer to achieve a much higher strain before failing, however further increase in the crosslink density cause the strain-to-failure to decrease as the additional connectivity causes the structure to respond in a more elastic rather than viscous manner [Fig. 3(c)]. Additionally, the plateau stress, which is plotted in Fig. 3(d), for the five structures, which are able to sustain a nonzero stress, is found to increase significantly with increasing crosslink density; it increases 13-fold over the small range of crosslink densities investigated. This result clearly demonstrates how sensitive adhesive properties can be to small changes in crosslink density. In particular, the plateau stress is an important indicator of the load magnitudes that an adhesive is able to sustain during typical usage.
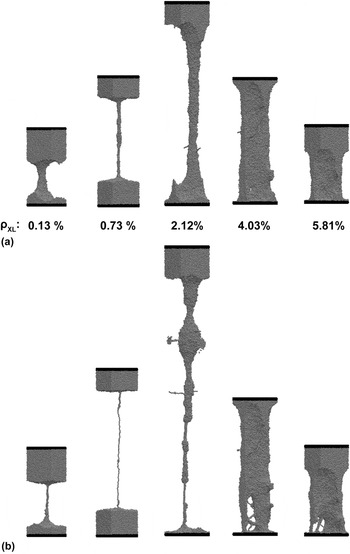
Figure 4 shows representative simulation snapshots from the post-elastic regime. The snapshots demonstrate the key mechanisms that give rise to the dramatic variation in mechanical response. Figure 4(a) shows the fibril structures formed during the deformation process. With higher crosslink densities, the stable fibril grows in diameter due to the additional connectivity, and more importantly, it is clear from the relative amount of the material involved in the fibril that crosslinking results in a larger fraction of the polymer material being involved in the deformation response. We note that the relatively small system size and the use of periodic boundary conditions introduces a finite size effect into the systems, which suppresses the typical crazing geometry in a single periodic cell. The two lowest crosslink density structures exhibit large volumes in which much of the polymer is not stressed, and only the small number of chains in the fibril participates in the deformation, which accounts for the large global strain. The two high crosslink density structures, however, exhibit deformation along most of the thickness of the sample. Figure 4(b) shows the same structures right before failure. In the structures with lower crosslink densities, the fibrils eventually neck down to a single chain, whereas with higher crosslink densities, a larger fraction of the material is extended and the deformed structure develops a more tortuous geometry with numerous smaller scale features. Furthermore, the cross-sectional area of the fibrils tends to increase with increasing crosslink density; this is likely the mechanism that results in the increase in the plateau stress.
Representative simulation snapshots from the post-elastic regime. The crosslink density (concentration of beads in crosslinks) is given by ρxL. Representative fibril structures are shown in (a); various degrees of deformation are shown to highlight the diversity of the deformed geometries. Snapshots of the structures just prior to failure are shown in panel (b).

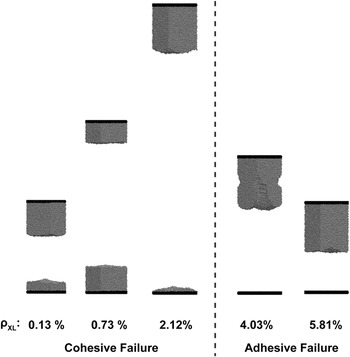
The failure response of the adhesives is shown in Fig. 5; a clear transition is observed from a cohesive failure mode in which failure occurs within the polymer material to an adhesive failure mode in which failure occurs by debonding of all of the polymer material from one of the adhesive walls. We note that the relatively smooth failure surfaces result from the fact that the polymers are tested above their glass transition temperature and thus the extended material seen in Fig. 4 snaps back into the remaining material as the strain energy is relieved. It is interesting to note that even though the structure with ρxL = 2.12% displays an impressive deformed structure in which all of the material appears to be effectively utilized, it still fails cohesively as a small amount of material is left on the bottom wall after failure.
Representative simulation snapshots after failure. In each case the structure relaxes quickly after failure. Lower crosslink densities result in cohesive failure, while structures with larger crosslink densities fail adhesively. Adhesive failure is typically desirable as PSAs are often used in reusable applications.

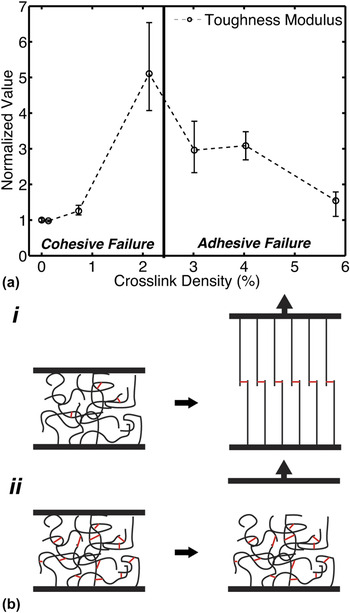
The toughness modulus (normalized by the non-crosslinked response) is shown in Fig. 6(a). The toughness modulus is a measure of the energy dissipated per unit volume during deformation and thus here it demonstrates changes in the work required to debond the adhesive. We observe a very large range of responses, mostly in line with the failure strain response; an optimal response is reached at a modest degree of crosslinking, but the performance decreases with further increase in the crosslink density. We also note the importance of the interplay between the failure strain and the plateau stress in determining the toughness modulus as a function of crosslink density. Although the failure strain increases rapidly at low crosslink densities, the very small (or nonexistent) plateau stresses at these crosslink densities prevent an appreciable increase in the toughness modulus. Thus, the toughness modulus increases more slowly than the failure strain for small amounts of crosslinking. In contrast, at higher crosslink densities where the failure strain drops off rapidly, the toughness modulus displays a less severe decline due to the increasing plateau stress.
Panel (a) plots the normalized toughness modulus; the mean result from three tack test simulations is shown with error bars indicating the minimum and maximum observed values. Increasing the crosslink density causes an initial increase in the toughness modulus due to increases in the plateau stress and strain-to-failure. However, further increases cause a drop in the toughness modulus due to a decreased strain-to-failure. A schematic of the competing deformation mechanisms responsible for the observed response is shown in (b). For low crosslink densities (i), the chains are able to extend and the crosslinks effectively increase the average chain length and in turn increase the overall extensibility. For larger crosslink densities (ii), the deformability decreases and the structure transitions to an adhesive failure mode.

Figure 6(b) shows schematics of competing molecular scale mechanisms which explain the observed peak in the toughness modulus as well as the transition from cohesive to adhesive failure. For low crosslink densities [Fig. 6(b, i)], crosslinks have the effect of increasing the average chain length and increasing the overall deformability of the crosslinked structure, giving rise to an increase in the strain to failure. As the crosslink density is increased further [Fig. 6(b, ii)], the crosslinks begin to reduce the deformability as an elastic network forms with short chains between connected nodes. Although the strength and stiffness of such a structure can be higher as adding crosslinks helps to stabilize the molecular conformation, the structure fails adhesively at the interface before a significant amount of energy can be dissipated in debonding inside the structure. This is made clear by the drop in the toughness modulus as the crosslink density is increased above the optimal value. The increased connectivity causes an increase in the plateau stress which would typically increase the toughness modulus, but the drastically decreased overall extensibility becomes the important factor in determining the amount of energy that the polymer can dissipate before failing at the interface.
Another mechanism that contributes to the transition between cohesive and adhesive failures is that for low crosslink densities, the polymer chains within the structure have weak interactions and behave more independently during failure, as a single defect or crack does not significantly affect the extensibility of the rest piece of material. For high crosslink densities, however, the interactions between polymer chains become much stronger, making the material less flaw tolerant. Thus a single defect or crack can cause stress concentration and can propagate by breaking the interfacial interactions, as illustrated in Fig. 4(b) and Fig. 6(b), dissipating less energy before failure.
IV. CONCLUSIONS
Molecular dynamics simulations were performed on simple coarse-grained polymer systems to directly investigate the effects that crosslinking has on the adhesive performance of amorphous polymer adhesives. Many properties were found to be highly sensitive to crosslink density, most notably the plateau stress, strain-to-failure, and toughness modulus, all of which are important parameters to consider in the design of new adhesive materials which seek to maximize mechanical performance as well as to have predictable mechanical behavior before failure. The results demonstrate that we can systematically tune the mechanical response of amorphous polymer adhesives by simply adjusting the crosslink density, and, importantly, that optimal performance is achieved at an intermediate degree of crosslinking, which coincides with the transition from cohesive to adhesive failure. Our study also reveals the key mechanisms that contribute to these two different failure modes. Moreover, the weak interaction between the polymer adhesives and the substrate can reform after failure while the polymer network remains largely intact, making the adhesives reusable.
Our results demonstrate good qualitative agreement with deformation behavior of PSAs observed in experiments. The model described here is simple and general and can be extended to include the specific physical parameters of many polymer adhesives. Scaling of the adhesive properties with physical crosslink density could be investigated further for specific polymer systems of interest to provide further validation. Furthermore, this model is capable of providing insight into diverse molecular scale mechanisms and thus it can be used to investigate many other properties which could affect adhesion including the organization of crosslink sites, dispersity of the polymer chains, the role of crosslinking in the presence of surface roughness, and the interplay between crosslinking and strain rate or temperature effects in adhesive films. Although the model is very simple, our results provide valuable insights, which can guide the design of future polymer adhesive materials that optimize the adhesive response through careful engineering of crosslinks.
The coarse-grained model used in the current study is developed for polymer adhesives but it can be parameterized to become suitable for studying many structural biological systems including gel, cytoskeleton, silk, and many similar copolymer materials. Factors including mutations, interactions with nanoparticles, stress condition, pH, and salt concentration that affect crosslink strength and many others can be quantitatively implemented in the model as well, making our method and result applicable in the broad field of soft matter.
ACKNOWLEDGMENTS
We acknowledge support from Henkel Corporation. We acknowledge fruitful discussions with M. Hamm, C. Paul, and P. Palasz.