I. INTRODUCTION
Zinc oxide (ZnO) is a widely used semiconductor due to its large band gap (∼3.3 eV) and high exciton binding energy (60 meV) making it a useful UV emitter and absorber. Reference Huang, Mao, Feick, Yan, Wu, Kind, Webber, Russo and Yang1,Reference Baxter and Aydil2 Surface modification in the ZnO QDs is known to determine the optical properties like fluorescence emission emerging from the random recombination of the trapped electrons and holes, also known as defect emission. Reference Tang, Choo, Li, Ding and Xue3 Therefore, the emission spectrum is broad with generally low quantum yield. A number of liquid phase techniques have been used for the synthesis of the ZnO nanocrystals; however, poor control over nucleation and growth process limits the particle size and homogenity. Reference Murray, Kagan and Bawendi4–Reference El-Gamel, Wortmann, Arroub and Mathur8
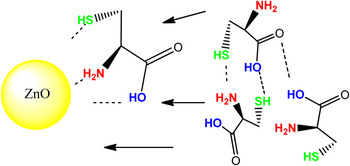
For controlling the growth of the QDs, appropriate solvents can be used as a quencher after the nucleation-burst by using their strong adsorption properties onto the formed structures. Micelle formation for the control of the particle/polymer interface or injection of suitable capping ligands, even biomolecules like glutamic acid and histidine, are common strategies to control the particle growth habits or by other methods. Change in the capping ligand or polymer leads to anisotropic or hierarchical structures such as elongated prisms or flowerlike aggregates, respectively. Reference Xiong, Wang, Liu, Chen, Wang and Xia9–Reference Wong, Bonevich and Searson19 Within this context, the use of capping ligands possessing high chemical affinity toward ZnO has proved to be effective in exemplifying an arrested growth of nanoparticles as well as to control the hierarchy and orientation of the nanocrystals. Reference Xiong, Wang, Liu, Chen, Wang and Xia9–Reference Wong, Bonevich and Searson19 Cysteine is a biologically important molecule containing amino, thiol, and carboxylic functional groups capable of undergoing specific reactions with the metal centers. In this study, we demonstrate the effect of cysteine capping on the synthesis of ZnO QDs and their use in cell labeling and formation of supra-structures due to the ligand shell. A scheme of cysteine-functionalized ZnO QDs have been shown in Fig. 1.
Cysteine-functionalized ZnO QDs and intermolecular interaction among surface-bound and free cysteine ligands.

II. RESULTS AND DISCUSSION
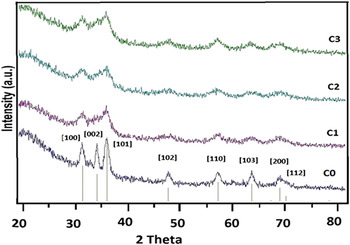
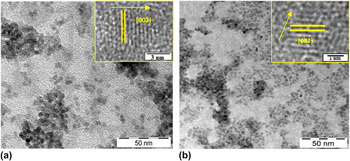
XRD patterns of conventional and cysteine-functionalized ZnO QDs at different cysteine concentrations showed wurtzite structure in both cases (Fig. 2, JCPDS Card No. 36-1451). No other crystalline impurities or residues were observed while the peak broadenings were attributed to the very small grain size (<5 nm). However, the diffraction peaks were sharper in conventional ZnO QDs. The analysis of both naked and cysteine coated QDs by transmission electron microscopy (TEM) revealed spherical grains with a predominantly narrow size distribution (Figs. 3 and S1).
XRD patterns of conventional (C0) and cysteine-functionalized ZnO QDs (C1–C3).

TEM images of conventional and cysteine-functionalized ZnO QDs (Inset images are HR-TEM analysis with lattice spacing).

HR-TEM analysis revealed both ZnO QDs that the growth direction is [002] in with a d–d spacing of 0.26 nm that corresponds to ZnO.
Intermolecular interaction among surface-attached cysteine molecules evidently induced particle agglomeration with particle size gradually increasing upon increasing cysteine concentration (C1: 2.5 nm, C2: 2.8 nm, and C3: 3.1 nm). However, the conventional ZnO QDs prepared under similar conditions displayed an average size of 3.8 nm, which indicates that particle growth is suppressed due to the presence of cysteine as a surface chelating agent.
Since electronic transition from valence to conduction band determines the shape of the UV absorption, the confinement effects observed in nanoscopic particles caused an enlargement of the band gap (E g). For calculating the average particle size of ZnO QDs, the half of the excitonic peak width from the absorption spectra of ZnO suspensions at various reaction times was also measured and substituted in the Meulenkamp equation to calculate the average E g values. Reference Meulenkamp20
 $$240/{\rm{\lambda }}_{1/2} = a + b/D^2 - c/D\quad ,$$
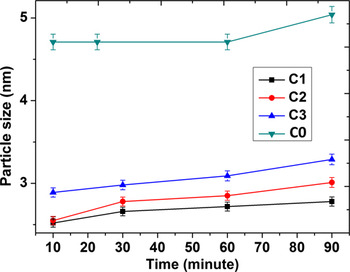
where a, b, and c are constants. The calculated values of QD sizes plotted against reaction time (Fig. 4) indicated minimal crystal growth in cysteine-capped QDs. The particle size calculated from the UV-visible absorption data was found to be comparable with TEM measurements.
Average particle size distribution extrapolated from UV-visible absorbance spectra of ZnO QDs.

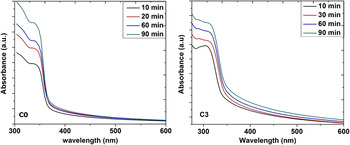
Figure 5 shows the UV-visible absorbance spectra of conventional and cysteine-capped ZnO QDs synthesized under different reaction conditions at various reflux time periods (Fig. S2). The band gap energies were calculated with the help of the following equation:
 $${\rm{\alpha h\nu }} = C{\rm{(h\nu }} - E_{\rm{g}} {\rm{)}}^m \quad ,$$
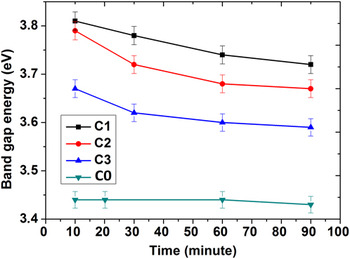
where α is the absorption coefficient, C is a constant, hν is the photon energy in eV, and E g is the band gap energy of the semiconductor. The calculated band gap energies (Fig. 6) showed that increasing amount of cysteine decreased the band gap energy of QDs.
UV-visible absorption spectra for the synthesis of conventional (C0) and cysteine capped ZnO QDs (C3).

Band gap energy variation in synthesized QDs.

It is known that by using a suitable capping agent like cysteine, it is possible to control coarsening effects in nanoparticles. Reference Liu, Fu, Liu, Liu, Jiang, Liu, Gao and Tang21 It was observed that the particle size increased upon increasing the cysteine amount. In solution, surface complexation or solution coordination takes place for chelation of zinc species in Zn(OH)4 2−. Reference Degen and Kosec22 Under these basic conditions, cysteine plays a major role for the formation of ZnO QDs. Apparently, thiol groups cause the zinc release or acceleration of the release process to form zinc–cysteine complexes. Increasing the cysteine amount, the zinc concentration is relatively decreased in the medium due to the formation of soluble zinc–cysteine complexes. Reference Cockel, Vahrenkamp and Zuberbühler23,Reference Arena, Musumeci, Rizzarelli, Sammartano and Rigano24 As for Zn(OH)2, it has lower thermodynamic stability than ZnO and this intermediate transforms into ZnO spontaneously. When the concentration of the zinc hydroxide species in the medium exceeds a critical value, ZnO begins to self-nucleate. However, by systematic cysteine complexation, zinc concentration is decreased, which favors aggregation of ZnO nanocrystals to form larger particles. Reference Oskam, Hu, Penn, Pesika and Searson25–Reference Tomczak, Gupta, Drummy, Rozenzhak and Naik30
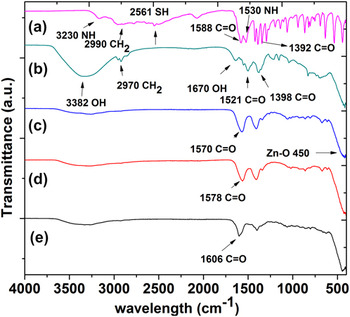
Fourier transform Infrared (FTIR) spectra of pure cysteine, conventional and cysteine-capped QDs exhibited zwitterionic (internal salts) structure and showed the spectral characteristics of both carboxylic and primary amine groups (Fig. 7).
FTIR spectra of (a) free cysteine, (b) C0, (c) C3, (d) C2, and (e) C1 samples.

In the case of free cysteine, peaks at 1588 and 1392 cm−1 correspond to the asymmetric and symmetric carbonyl stretching. The peak at 1525 cm−1 is due to N–H bending, whereas a broad band of N–H stretching is observed in the range 3000–3500 cm−1 together with the acidic function. These results are in good agreement with the reported FTIR spectra of a general amino acid. Reference Umetsu, Mizuta, Tsumoto, Ohara, Takami, Watanabe, Kumagai and Adschiri31 A shift in the position of COO− and N–H stretching is likely due to a change in their dipole moment when cysteine binds to metal or metal oxide surface with high electron density. Consequently, the large band from 2300 to 3300 cm−1 has shifted to higher wave numbers. Reference Barth32,Reference Spanhel and Anderson33 Zn–O band at 450–460 is evident in all ZnO QDs (C0, C1, C2, and C3), although the amount of the cysteine caused a systematic shift as seen in Fig. 7. The carbonyl stretching peak is at 1606 cm−1 (C1), 1578 cm−1 (C2), and 1570 cm−1 (C3) showing possible changes in the carbonyl asymmetric and symmetric stretching with different loading of cysteine amount.
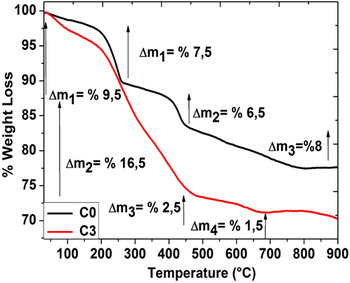
Figure 8 shows TG/DTA analysis of the conventional (C0) and cysteine modified (C3) ZnO QDs. For the conventional ZnO QDs, in the first (until 250 °C) and second steps (250–432 °C), volatile components, adsorbed humidity, and organic groups were removed which is 73% of the total removed amount. After this, event decomposition was terminated at around 800 °C. By analyzing the pure cysteine decomposition profile (Fig. S3), it was found that the decomposition of cysteine occurred in a single step. Till 230 °C, organic groups and adsorbed humidity were removed, whereas the complete decomposition ended at 450 °C.
Thermal analysis of conventional (C0) and cysteine-capped QDs (C3).

Increased amount of surface-bound cysteine and its removal during the differential thermogravimetric analysis was observed in C1:10% < C2:12% < C3:16% in the given order (Fig. S3). C1, C2 (Fig. S3), and C3 decomposed in four steps (Fig. 8), whereby the first two steps can be attributed to the removal of adsorbed humidity and partial cysteine removal of the cysteine shell. With increasing cysteine, decomposition accordingly increased (Fig. S3) (C1:10% C2:12% C3:16%). However, this process was accompanied with temperature shifts (290 °C for C1, 300 °C for C2, and 310 °C for C3) probably due to physisorbed layers of cysteine molecules. In the third step, chemisorbed cysteine molecules were removed until 450 °C and chemisorbed residual organic moieties were eliminated from the surface. Total weight loss increased from C1 to C3, which can be attributed to the higher concentration of immobilized cysteine molecules on the QDs and multilayered ligand adsorption. Further confirmation of the different amount of loaded cysteine molecules on the QDs was confirmed by energy dispersive x-ray spectral analysis that showed an increasing amount of sulfur. (Fig. S4).
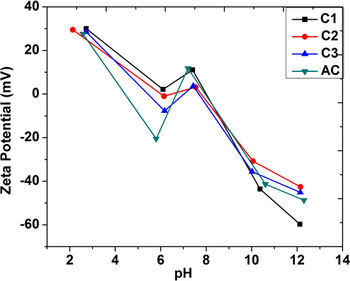
Owing to the zwitterionic character of immobilized cysteine molecules, zeta potential (ζ) measurements were conducted at different pH values (pH: 2–13). The zeta potential of conventional ZnO QDs was found to decrease with increasing pH, however around pH > 6, an increase was observed that was attributed to the ion adsorption on ZnO QDs aggregates present in the solution. Since HCl and NaOH solutions were used to prepare solutions having different pH values, small fluctuations in zeta potential values in the transition pH region (6–8) are anticipated. The variation of zeta potential with pH values (Fig. 9) revealed a higher zeta potential for smaller particles that would provide higher stability as verified by the higher stability of the colloidal solutions against sedimentation. Reference Han, Wang, Ma and Su34 The cysteine-capped QDs were found to be highly stable below pH < 3 (around +30 mV). Also at high pH values (>10), zeta potential values confirmed high stability (<−30 mV) possibly due to the zwitterionic effect of the cysteine molecules. According to the results presented in Fig. 9, the zeta potential of the cysteine-capped ZnO QDs showed a consistent tendency, and it can be speculated that cysteine molecules showed the similar bonding behavior at different pH values. Reference Viswanatha, Santra and Sarma35–Reference Guo, Yang, Yang, Yu, Wang, Ge and Wong37
Zeta potentials of the conventional (C0) and cysteine-capped QDs (C1, C2, C3).

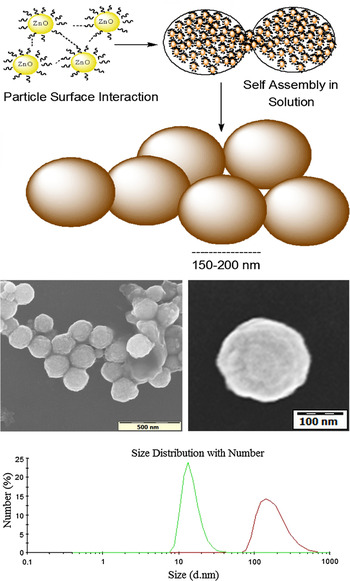
Functional groups like carboxylic, thiol, or amino groups and their distribution on the nanoparticle surface are known to influence short-range interparticle interactions. The surface chemistry and pH effect in ZnO QDs can generate hierarchical structures depending on the solution conditions, whereby the hydrogen bonding among functional groups can manipulate the ZnO QDs surfaces and augmented by van der Waals interactions and dipole–dipole forces, bigger spherical structures ranging from 150–200 nm can result (Fig. 10). As can be seen in the dynamic light scattering (DLS) measurements, QDs show relatively small hydrodynamic size (12 nm) in freshly prepared solutions which then gradually increased to an average 200 nm size indicating the possible formation of the hierarchical structures.
Assembly of ZnO QDs to form supra-structures and their hydrodynamical property observation with time.

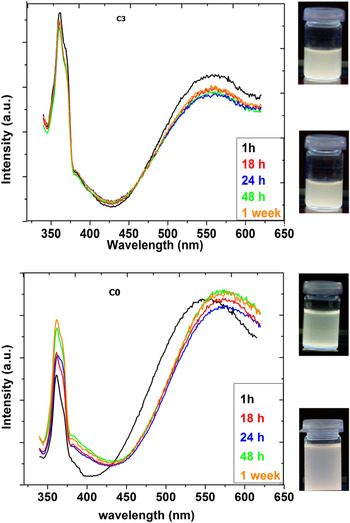
Photoluminescence measurements on ZnO QDs dispersed in ethanol showed visible yellow luminescence for cysteine-capped ZnO QDs (Fig. 11). Visible emission from conventional ZnO QDs showed a shift toward longer wave lengths due to the Ostwald ripening and particle growth. Reference Meulenkamp20 The images of colloidal solutions in photoluminescence graphics (top, Fig. 11) showed a change in the optical properties of C0, whereas the visible emission color of C3 remained unchanged upon storage for a week. The observed visible luminescence in ZnO QDs evident as a broad band with maximum between 2.20 and 2.10 eV possibly originates from the native oxygen defects that can be controlled by surface modification. Reference Noshir, Zeshan, Kathleen and Searson12,Reference Singh, Viswanath and Janu38,Reference Dijken, Makkinje and Meijerink39 The emission in the UV region for both cysteine-modified and conventional ZnO QDs was attributed to the recombination of trapped shallow charge carriers (exciton emission). Reference Vandijken, Meulenkamp, Vanmaekelbergh and Meijerink40,Reference Schmidt-Mende and MacManus-Driscoll41 For cysteine-modified ZnO QDs, the intensity of UV and visible emission peaks decreased slightly over a period of 18 h, but the peak position remained unchanged for more than a week supporting their colloidal stability.
ZnO QDs visible emission stability for conventional (C0) and cysteine capped QDs (C3).

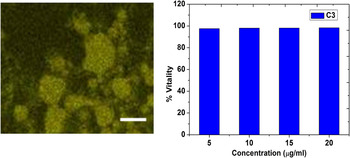
Visible light emission of the cysteine-capped ZnO QDs was used in labeling of human embryonic kidney 293 (HEK 293) cells. Cytotoxicity of cysteine-capped ZnO QDs on HEK 293 cells was determined by the 3-(4,5-dimethylthiazol-2-yl)-2,5-diphenyltetrazolium bromide (MTT) assay (Carl Roth, Karlsruhe, Germany). For this purpose, formazan crystals were solubilized with 4 mM HCl in isopropanol containing 0.1% Tergitol solution (Sigma Aldrich, Steinheim, Germany). After exposure to the different amounts of cysteine-capped ZnO QDs (5, 10, 15, and 20 μg/mL), 20 μL MTT solution was added to each well and incubated at 37 °C for 2 h. The medium was removed and 200 μL MTT solvent was added to each well and mixed thoroughly. The absorbance was read at 620 nm by enzyme-linked immunosorbent assay (ELISA) (Elx800, Biotek, Germany). The results were computed in relation to an untreated control. Our previous studies revealed that ZnO nanoparticles show dose dependent cellular toxicity during 24 and 48 h incubation. Reference Buerki-Thurnherr, Xiao, Diener, Arslan, Hirsch, Maeder-Althaus, Grieder, Wampfler, Mathur, Wick and Krug42,Reference Tuomela, Autio, Bürki-Thurnherr, Arslan, Kunzmann, Andersson-Willman, Wick, Mathur, Scheynius, Krug, Fadeel and Lahesmaa43 In this study, HEK 293 cells have been treated in the same manner by introducing C3 quantum dots (20 μg/mL), incubating them at 37 °C but in shorter times 1–2 h. MTT assay test revealed that only ∼5–8% of the cell viability loss was observed during 2 h treatment as presented in the confocal microscopy of HEK 293 cells exposed to ZnO QDs (Fig. 12).
HEK 293 labeling with cysteine capped ZnO QDs (C3) (left) scale bar: 20 μm; 2 h MTT assay for C3 (right).

III. CONCLUSIONS
Cysteine-functionalized zwitterionic ZnO QDs exhibiting interesting optical absorption behavior in the visible range and extraordinary colloidal stability over a wide pH range due to the zwitterionic nature of the surface were synthesized, characterized, and tested toward their cytotoxic properties. The stability of the optical emission in cysteine@ZnO nanoparticles was attributed to the chemical coordination of the ligands to Zn2+ centers that concomitantly reduce the numerical density of oxygen defects on or near the surface. In addition, the presence of a sterically compact hydrophilic (thiol) shell reduced the hydrodynamic radii of the nanoparticles in solution and supported (via H-bonding) the formation of hierarchical spherical nanostructures. To the best of our knowledge, this is the first report on single amino acid coated ZnO QDs, which in view of their excellent solubility are suitable for investigating cell–nanoparticle interactions and anti-fouling properties. As an example, human embryonic kidney cells were labeled with cysteine modified ZnO QDs. Finally, the surface modification strategy described here can be applied to other metal oxide nanoparticles for potential theranostic applications.
IV. EXPERIMENTAL SECTION
ZnO QDs were prepared by using 5 mmol of Zn(CH3COO)2·2H2O dissolved in 75 mL of the EtOH under vigorous stirring at 50 °C. The resulting clear solution was mixed with a mixture of cysteine and 7 mmol LiOH·H2O in 75 mL MeOH. The amount of cysteine was varied as 2.5, 5.0, and 7.5 mmol and the obtained samples were labeled as C1, C2, and C3, respectively, against the conventional ZnO QDs denoted as C0. The diluted reaction mixture was refluxed for 90 min at 55 °C under nitrogen atmosphere, whereby aliquots were collected at different time intervals (10, 30, 60, and 90 min) to record the particle size evolution by optical absorption spectra. Similar synthesis procedure excluding cysteine was applied to obtain the conventional QDs, and aliquots were analyzed after 10, 20, 40, 60, and 90 min. The prepared ZnO QDs were precipitated out by adding hexane to the reaction mixture and were washed with water, ethanol, and hexane and dried in vacuum for 6 h. The powder x-ray diffraction (XRD) patterns of as-synthesized ZnO QDs were measured with a STOE-STADI MP vertical system in transmission mode using Cu Kα (α = 0.15406 nm) radiation. Particle size was investigated with TEM (LEO 912 Omega, Zeiss, Oberkochen, Germany) operated at 120 kV with zero loss conditions. The energy-filtered electron micrographs were recorded with a high-speed scanning camera (sharp: eye, 2048 × 2048 pixels, TRS, Moorenweis, Germany) under remote control using the image acquisition system (iTEM, Olympus Soft Imaging Solutions GmbH, Münster, Germany). HR-TEM images were obtained with LEO OMEGA thermal analysis of the prepared ZnO QDs carried out in the temperature range from 30 to 800 °C with a heating rate of 10 °C/min under nitrogen atmosphere (flow rate; 25 mL/min) using Mettler Toledo TGA/DSC 1stare systems. FTIR analyses were carried out with Perkin Elmer-Spectrum 400 (Melville, NY) with universal ATR sampling accessory in the 400–4000 cm−1 range. UV-visible and photoluminescence measurements were carried out using Perkin-Elmer Lambda 950 and Yvon-Horiba FluoroMax-3 (Germany), respectively. Fluorescence lifetime measurements were conducted by Pico Quant (Germany) with 375 nm excitation. For the labeling application, HEK 293 human kidney cells were cultured on 12 mm coverslips. Then prepared cells were mounted on glass slides with gelvatol. Images were taken by confocal microscopy (Leica, Germany, LSM TCS SP5). Zeta potentials and hydrodynamic size of ZnO QDs were obtained by using Malvern Zetasizer Nano ZS with disposable cuvettes. Surface morphology and EDX analysis were acquired by Nova Nano SEM 430 (FEI, Philips, Eindhoven, Netherlands).
ACKNOWLEDGMENTS
Authors are thankful to the University of Cologne and the European Project “NANOMMUNE” (EC-FP7-NANOMMUNE- Grant No. 214281) for the financial support. We gratefully acknowledge Muhammad Sajid Hussain from the University of Cologne for the Confocal Microscopy measurements.