Introduction
The usual management procedures in sheep breeding, such as transportation, foot treatment, pharmacological treatment, shearing, isolation, capture and so on, induce an endocrine and metabolic response known as stress (Baldock and Sibly, Reference Baldock and Sibly1990; Hargreaves and Hutson, Reference Hargreaves and Hutson1990a). The severity of the reaction is governed by a number of factors including individual sensitivity, unfamiliarity to the stimulus and the relative intensity (Grandin, Reference Grandin1997). The response is also conditioned by social position and by sex within the group, since dominant animals and males have a higher resistance to stress, as evidenced by a lower cortisol concentration in blood (McGlone et al., Reference McGlone, Salak, Lumpkin, Nicholson, Gibson and Norman1993; Turner et al., Reference Turner, Canny, Hobbs, Bond, Clarke1 and Tilbrook2002). Furthermore, novelty produces a strong hormonal and metabolic reaction in animals; how quickly they get used to a particular stimulus will depend on its intensity, and a gradual approach to the stress factor reduces the response (Dantzer and Mormede, Reference Dantzer and Mormede1983; Grandin, Reference Grandin1997). The reaction to the above-mentioned stress factors is mainly centred in the activation of the sympathetic system and the hypothalamic–hypophysis–adrenal axis through catecholamine and glucocorticoid production (Miller and O’Callaghan, Reference Miller and O’Callaghan2002). These hormones render the animals alert, thus giving them the ability to react to environmental stimuli, in order to preserve organic homeostasis (Herman and Cullinan, Reference Herman and Cullinan1997). Glucocorticoids and catecholamines also cause a rise in glycaemia, starting from glucidic and non-glucidic substrates such as proteins and an increase of non-esterified fatty acid (NEFA), derived from lipid mobilization (McMahon et al., Reference McMahon, Gerich and Rizza1988; Mormede, Reference Mormede1988). Taken together, these effects produce a greater availability of energy for the brain and muscles, and thereby a more efficient behavioural response to stress. Glucocorticoids and catecholamines provoke the increase of blood sodium (Na) and a decrease of potassium (K), modifying the electrolytic equilibrium (McDonald, Reference McDonald1975). Moreover, blood magnesium (Mg) is affected by cold-exposure stress (Achmadi et al., Reference Achmadi, Sano and Terashima2001), but little is known regarding the relation between the shearing procedure and this last mineral. Growth hormone (GH) is among the various hormones involved in stress response, though its concentration during stress differs between species. Stress causes an increase in the plasma concentration of GH in humans (Greenwood and Landon, Reference Greenwood and Landon1966), monkey (Meyer and Knobil, Reference Meyer and Knobil1967) and pig (Machlin et al., 1968), while the opposite occurs in rodents (Muller et al., Reference Muller, Arimura and Saito1967). GH secretion is not modified by surgical stress in dogs, or by restraint in dark chambers in sheep (Lovinger et al., Reference Lovinger, Connors, Kaplan, Ganong and Grumbach1974; Cronin et al., Reference Cronin, Siegel and Moberg1981). The action of this hormone in a situation of acute stress, like shearing, is not yet known, but it plays an important role in the regulation of several physiological processes such as growth, lactation and other metabolic effects (Gluckman et al., Reference Gluckman, Breier and Davis1987). The events leading to shearing must be among the most stressful, since the animal is penned for capture, separated from the flock, thrown down and finally shorn (Hargreaves and Hutson, Reference Hargreaves and Hutson1990a). However, effects of tying of the animals on stress are not known as properly as the other procedure, but this practice is always utilized during shearing in Sardinian sheep management.
Therefore, in order to determine how the various stages of shearing affect GH secretion, the levels of this hormone in blood, along with cortisol concentrations and a number of blood parameters, were analysed in adult female and male sheep, and in ewe lambs with no previous experience of shearing. The different age and gender categories of animals were utilized to compare the effect of previous experience and sex on shearing procedure hormonal response.
Material and methods
Animals
The study was carried out on a flock of about 400 Sarda breed sheep. The location was in Sardinia, at 39° North Latitude, 600 m above sea level. During the day, the animals grazed on natural pasture, and were penned at night, when they received a concentrated commercial food-supplement of 200 g per head (crude protein (CP) 20.4% and 12.5 MJ metabolizable energy (ME)/kg dry matter (DM)). The sheep also had free access to hay (CP 11.1% and 7.2 MJ ME/kg DM) and water. According to the traditional techniques of Sardinian sheep breeding, the animals are shorn once a year, in late spring. Fifty sheep were randomly chosen from the flock, according to the following criteria: 30 previously unshorn ewe lambs, aged about 8.1 months; 10 adult ewes of about 4 years; and 10 entire adult males of about 4.7 years of age. Adult ewes and males had been shorn in the previous years.
Experimental procedures
The animals were divided into the following experimental groups:
Group A: 10 ewe lambs; they were separated from the flock, and kept together in a pen from which they could not see the rest of the flock.
Group B: 10 ewe lambs; they were separated from the flock, and their feet were tied. These were not shorn, but were kept tied and placed in the lateral decubitus position during the treatment.
Group C: 10 ewe lambs; they were separated from the flock, their feet were tied and subsequently shorn and kept in the shearing pen.
Group D: 10 adult ewes; they were separated from the flock, their feet were tied, they were shorn and kept in the shearing pen.
Group E: 10 entire males; they were separated from the flock, their feet were tied, they were shorn and kept in the shearing pen.
For each animal, treatment (separation, tying of the feet and shearing) was performed, on the same day, without any interruption. The whole treatment lasted approximately 20 min for each sheep, whether shorn or unshorn, and it took about 2 h to perform the treatments on all five groups. Shearing was performed by hand using traditional shearing scissors in a 15 × 10 m pen. The animals were led into a pen, where they were fed, before being led into the shearing area through a sliding door. After the process, the animals were released into an adjacent pen.
Blood samples
Five samples of blood were taken by one puncture from the jugular vein of each animal, using sample tubes containing heparin (Becton Dickinson, Plymouth, UK).
First sample: the day before shearing at 0900 h, for all the groups.
Second sample: just after the start of separation from the flock, at 0900 h, for all the groups.
Third sample: 10 min after the second sample. This sample was collected while animals of Groups B, C, D and E were kept tied, animals of Groups C, D and E were also being shorn and animals of Group A were only separated from the rest of the flock.
Fourth sample: 10 min after the third sample, just before the feet were untied in animals of Groups B, C, D and E.
Fifth sample: the day after, at the same time as the first sample (0900 h).
The blood was immediately centrifuged at 3000 rpm for 20 min at 4°C, and the plasma was frozen at −20°C until analysis.
Hormone analysis
Plasma concentration of GH was quantified by a heterologous double-antibody radioimmunoassay (RIA), according to Celi et al. (Reference Celi, Seren, Celi, Parmeggiani and Di Trana2003). The method was developed using a rabbit antiserum to bovine GH (NHI-GH-B13) at a final dilution of 1 : 7000. The cross-reactivity was as follows: GH 100%; prolactin (PRL) 0.1%; LH 0.01%; and FSH, thyroid stimulating hormone (TSH), adrenocorticotropin hormone (ACTH) and caprine placental lactogen (cPL) <0.01%. Assay sensitivity (90% B/B0) was 0.5 ± 0.12 ng per tube. Purified ovine GH (NIDDK-oGH) was used for radio-iodination according to Salacinsky et al. (Reference Salacinsky, McLean, Sykes, Clement-Jones and Lowry1981); specific activity was 27.6 μCi/μg. The same preparation (NIDDK-oGH) was used as the reference standard. The within-assay coefficient of variation (WACV) and the between-assay coefficient of variation (BACV) were 9.7% and 13.8%, respectively. Plasma levels of cortisol were determined as reported by Tamanini et al. (Reference Tamanini, Giordano, Chiesa and Seren1983) using a RIA method. The sensitivity (90% B/B0) of the cortisol antibody was 4.9 ng/ml, and the cross-reactivities were as follows: 20.4% with cortisone, 74.6% with deoxycortisol-11α, 1.1% with corticosterone and 0% with progesterone and oestrogens.
Analysis of metabolites
Plasma glucose and Mg were analysed using enzymatic colorimetric methods, GOD-POD-PAP and HK-G6PDH, respectively (Sentinel Chemical, Milano, Italy). Na and K concentrations were determined by a flame spectrophotometer (Corning Flame Photometer 410; Corning Medical and Scientific, Corning, NY, USA).
Statistical analysis
Hormone profile data were analysed by repeated measure analysis of variance (ANOVA) using MINITAB Statistical software (Minitab Inc. 2000, State College, PA, USA) for the comparison of plasma concentrations of the various hormones and metabolites over time. Sources of variation were group, sample and their interaction. All data are reported as mean ± SD; differences with P < 0.05 were considered significant.
Results
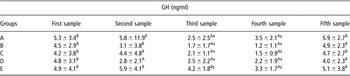
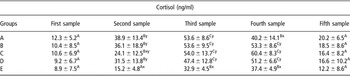
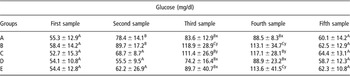
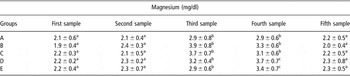
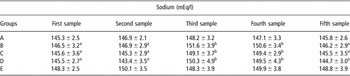
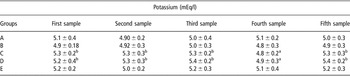
Mean plasma GH levels showed a progressive drop in all the groups during the treatments. Plasma GH levels decreased (P < 0.01) in Groups A, B and C during (third sample) or at the end of treatment (fourth sample), while at the beginning (second sample) in Group D, but only at the end of treatment in Group E (P < 0.01). GH levels in Group E were higher than those in the others during the third sample, whereas at the end of treatment (fourth sample) Groups A and E showed the highest level (P < 0.05) (Table 1). Plasma concentration of cortisol rose (P < 0.01) in Groups B, C and D from the second to the fourth sample but in Group E it was later than in the other groups (third sample). In Group A, the cortisol dropped in the fourth sample compared with the third one (P < 0.01), but it was still significantly higher than at the basal levels (first sample). Mean glucocorticoid values among the groups varied in the second and third samples, Group E had lower levels than Groups A, B and D in the second sample (P < 0.05) and lower levels than all the other groups in the third sample (P < 0.05). In the fourth sample, a significant difference of the plasma cortisol levels appeared between Groups B, C, D and the other groups (P < 0.05) (Table 2). Blood glucose levels rose in Groups A and B at the second in comparison with the first sample (P < 0.01), while in Groups B, C, D and E at the third sample in comparison with the second (P < 0.01) and in Group E at the fourth sample in comparison with the third (P < 0.01). The highest mean values of glucose were at the third sample for animals of Groups B and C, and at the fourth sample for animals of Groups B, C and E (P < 0.05) (Table 3). Mg concentration in blood rose in all groups in the third and fourth samples (P < 0.05) (Table 4). Plasma concentrations of Na rose in the third and fourth samples only in Groups B, C and D (P < 0.05) (Table 5). The highest K levels in blood were (P < 0.05) found in the fourth sample in Groups C and D (Table 6).
Mean ± s.d. values of growth hormone (GH) (ng/ml) in the groups during sampling

Group A: ewe lambs only separated from the flock; Group B: ewe lambs separated and tied; Group C: ewe lambs separated, tied and shorn; Group D: adult ewes separated, tied and shorn; Group E: entire adult males separated, tied and shorn.
First sample: the day before shearing; Second sample: at the moment of separation from the flock; Third sample: 10 min after the second sample; Fourth sample: 10 min after the third sample; Fifth sample: the day after shearing.
ABMean values within a row with different capital letters differ significantly (P < 0.01) in sample comparison.
xyMean values within a column with different lower-case symbols differ significantly (P < 0.05) in group comparison.
Mean ± s.d. values of cortisol (ng/ml) in the groups during sampling

Group A: ewe lambs only separated from the flock; Group B: ewe lambs separated and tied; Group C: ewe lambs separated, tied and shorn; Group D: adult ewes separated, tied and shorn; Group E: entire adult males separated, tied and shorn.
First sample: the day before shearing; Second sample: at the moment of separation from the flock; Third sample: 10 min after the second sample; Fourth sample: 10 min after the third sample; Fifth sample: the day after shearing.
ABCMean values within a row with different capital letters differ significantly (P < 0.01) in sample comparison.
xyMean values within a column with different lower-case symbol differ significantly (P < 0.05) in group comparison.
Mean ± s.d. values of glucose (mg/dl) in the groups during sampling

Group A: ewe lambs only separated from the flock; Group B: ewe lambs separated and tied; Group C: ewe lambs separated, tied and shorn; Group D: adult ewes separated, tied and shorn; Group E: entire adult males separated, tied and shorn.
First sample: the day before shearing; Second sample: at the moment of separation from the flock; Third sample: 10 min after the second sample; Fourth sample: 10 min after the third sample; Fifth sample: the day after shearing.
ABCMean values within a row with different capital letters differ significantly (P < 0.01) in sample comparison.
xyMean values within a column with different lower-case symbol differ significantly (P < 0.05) in group comparison.
Mean values ± s.d. values of magnesium (mg/dl) in the groups during sampling

Group A: ewe lambs only separated from the flock; Group B: ewe lambs separated and tied; Group C: ewe lambs separated, tied and shorn; Group D: adult ewes separated, tied and shorn; Group E: entire adult males separated, tied and shorn.
First sample: the day before shearing; Second sample: at the moment of separation from the flock; Third sample: 10 min after the second sample; Fourth sample: 10 min after the third sample; Fifth sample: the day after shearing.
abcMean values within a row with different lower-case letters differ significantly (P < 0.05) in sample comparison.
Mean ± s.d. values of sodium (mEq/l) in the groups during sampling

Group A: ewe lambs only separated from the flock; Group B: ewe lambs separated and tied; Group C: ewe lambs separated, tied and shorn; Group D: adult ewes separated, tied and shorn; Group E: entire adult males separated, tied and shorn.
First sample: the day before shearing; Second sample: at the moment of separation from the flock; Third sample: 10 min after the second sample; Fourth sample: 10 min after the third sample; Fifth sample the day after shearing.
abMean values within a row with different lower-case letters differ significantly (P < 0.05) in sample comparison.
Mean ± s.d. values of potassium (mEq/l) in the groups during sampling

Group A: ewe lambs only separated from the flock; Group B: ewe lambs separated and tied; Group C: ewe lambs separated, tied and shorn; Group D: adult ewes separated, tied and shorn; Group E: entire adult males separated, tied and shorn.
First sample: the day before shearing; Second sample: at the moment of separation from the flock; Third sample: 10 min after the second sample; Fourth sample: 10 min after the third sample; Fifth sample the day after shearing.
abMean values within a row with different lower-case letters differ significantly (P < 0.05) in sample comparison.
Discussion
The various treatments produced a drop in blood-plasma levels of GH in all the groups under observation. The greatest drop was observed in females separated from the group, separated and tied, as well as in those that had also been shorn. This fact demonstrates that somatotropin secretion is affected at the beginning by any stress, such as separation, tying and shearing, but it is later influenced by severe stress, such as tying and shearing in comparison to the separation from the flock. Indeed, in animals that were only separated from the group, plasma GH levels rose again in the fourth sample without reaching the level of the first sample, after a significant drop. The other three groups of females suffered a further drop in GH levels, as highlighted by the significant differences, which is seen in a comparison of the groups. Cataldi et al. (Reference Cataldi, Magnan, Guillaume, Dutour, Sauze, Mazzocchi, Conte-Devolx and Oliver1994) observed, on the contrary, that blood levels of this hormone rose significantly after an acute, short-lived period of stress, determined by isolation and manual immobilization. Similar results were also observed in bovines, after undergoing a brief period of heat stress, while long-term heat stress of the same animals led to a drop in somatotropin (Trenkle, Reference Trenkle1978). Long-term heat stress did not produce variations in blood GH in sheep (Colthorpe et al., Reference Colthorpe, Anderson, Martin and Curlewis1998). Researches attempting to explain the mechanisms of stress on somatotropin secretion are not in agreement. In sheep, Cataldi et al. (Reference Cataldi, Magnan, Guillaume, Dutour, Sauze, Mazzocchi, Conte-Devolx and Oliver1994) found not only the above-mentioned GH increase but also an increase of growth hormone releasing hormone (GHRH), which is, by itself, responsible for the GH rise. On the contrary, administration of glucocorticoids or cortisol, both in vivo and in vitro, causes the GH concentration to fall, by inhibiting GHRH secretion as well as by synthesis of somatotropin by pituitary cells (Sartin et al., Reference Sartin, Kemppainen, Coleman, Steele and Williams1994; Thompson et al., Reference Thompson, Coleman, Hudmon, Kemppainen, Soyoola and Sartin1995). Therefore, as in the case of our experiment, the blood levels of cortisol could lead to a different response of the somatotropic axis. The decrease of plasma GH levels, found in our research, is an interesting result that should be taken into consideration as GH is a hormone involved in metabolic regulation and could affect the regulation of lipid, glycaemic and protein metabolism (Gluckman et al., Reference Gluckman, Breier and Davis1987). It also plays an important role in the animal’s immune response (Davis, Reference Davis1998) regulating lymphopoiesis and lymphocytes migration to inflammatory sites directly and indirectly through IGF-I (Khosraviani and Davis, Reference Khosraviani and Davis1996; Clark, Reference Clark1997).
Blood cortisol levels rose in all the animals; the high levels were maintained steady between the third and fourth samples, except for in Group A, in which a decrease was registered at the fourth sample. The rise in blood cortisol levels, which we observed both in only tied animals and in tied and shorn animals, supports what Hargreaves and Hutson (Reference Hargreaves and Hutson1990a and Reference Hargreaves and Hutson1990b) found. The lack of difference between the two groups indicated that tying the legs of the animals was as stressful as tying and shearing. This finding also agrees with those reported by Hargreaves and Hutson, (Reference Hargreaves and Hutson1990c). The change of corticosteroid levels in sheep that had only been isolated from the flock does not agree with the findings of Hargreaves and Hutson (Reference Hargreaves and Hutson1990c). They found that isolation produced a rise in cortisol levels only during the initial stages of observation, whereas in our experiment, when the animals were not isolated one by one but were kept together in a group separated from the main flock, the levels of this hormone remained high for the whole isolation period, in agreement with the findings of Cataldi et al. (Reference Cataldi, Magnan, Guillaume, Dutour, Sauze, Mazzocchi, Conte-Devolx and Oliver1994).
Furthermore, there was no difference in cortisol levels between the sheep that had been shorn in previous years and those subjected to shearing for the first time. This fact supports what Hargreaves and Hutson (Reference Hargreaves and Hutson1990d) reported, who shore the same animal twice, 2 weeks apart, without obtaining any change in response to the second shearing. This confirms that the animals do not become accustomed to stressful procedures, such as upending (the manipulation in preparation for shearing) (Grandin, Reference Grandin1997). Moberg and Wood (Reference Moberg and Wood1982) found that though sheep may become accustomed to handling, there is only a minimal change, if any, in secretion from the adrenal cortex.
Males, on the contrary, show much lower plasma levels of cortisol than females, under the same treatment. This can presumably be attributed to an inhibiting effect of gonadal steroid on ACTH secretion (Dawood et al., Reference Dawood, Williams, Fullerton, Myles, Schuijers, Funder, Sudhir and Komesaroff2005), although the fact that there is a direct cortisol-inhibiting effect of testosterone on the adrenal gland cannot be excluded (van Lier et al., Reference van Lier, Perez-Clariget and Forsberg2003). However, cortisol haematic concentrations, recorded in all the animals involved in the trial, showed that shearing procedures, although they are necessary in sheep management, caused a severe stress.
Plasma levels of glucose rose in all groups during the experiment. This progressive rise is directly proportional to cortisol levels, and must therefore be attributed to the hyperglycaemic effect of this hormone, to which we may add an increased glucose production by the liver, due to stimulation of sympathetic-adrenergic activity (Ali et al., Reference Ali, Al-Qarawi, Mousa and Mohammed2001).
It is more difficult to explain the change of Mg levels, since it does not agree with a report by Al-Qarawi and Ali (Reference Al-Qarawi and Ali2005). In their experience, there was a drop of this mineral in the blood, which was considered to indicate stress, on the basis of earlier studies pointing to Mg sensitivity as a stress indicator in birds and mammals (Ali et al., Reference Ali, Silsby and el Halawani1987). This sensitivity was also proved by the fact that Mg salts given to turkeys and egg-laying chickens reduced the condition of stress. However, the mechanism of a stress-induced drop in Mg in the blood is yet to be explained (Ali et al., Reference Ali, Al-Qarawi, Mousa and Mohammed2001). The change observed by us may be linked to the shorter duration of stress-inducing stimuli; our experiment lasted only 20 min, while in the above-mentioned cases stress lasted much longer, producing Mg depletion.
As far as the change of Na and K levels is concerned, our results may be explained by the mineral-corticoid effect of glucocorticoids, leading to Na excretion and K retention (Debenedetti, Reference Debenedetti1998): the animals with the highest blood cortisol levels showed the greatest variation in the concentration of these two minerals.
Conclusion
The pattern of the blood parameters shows how the various stages of shearing all lead to a situation of stress. The change in blood GH levels suggests that, in sheep, GH secretion levels are influenced above all by tying, shearing and by sex. The observed high blood cortisol levels demonstrated that tying of the animals should be avoided, as this phase is the most stressful. Furthermore, alternative shearing methods, with the absence of feet tying, separation from the flock and waiting times, should be used to achieve stress reduction.