


Introduction
Ice streams are regions within ice sheets characterized by ice flow of orders of magnitude greater than that of the adjoining ice sheet. The Siple Coast of the West Antarctic ice sheet (WAIS) is characterized by several ice streams that flow into the Ross Ice Shelf and cause fluctuations in the mass balance of the WAIS on decadal to millennial timescales (see, e.g., Reference Fahnestock, Scambos, Bindschadler and KvaranFahnestock and others, 2000; Reference Conway, Catania, Raymond, Scambos, Engelhardt and GadesConway and others, 2002; Reference Catania, Conway, Raymond and ScambosCatania and others, 2006b, Reference Catania, Hulbe, Conway, Scambos and Raymond2012). Whillans Ice Stream (WIS), a prototypical WAIS ice stream, is currently slowing and experiencing changes in width (Reference Stearns, Jezek and Van der VeenStearns and others, 2005). Such short-term dynamism is internal to the ice-stream system and so occurs independently of climate forcing (Reference Hulbe and FahnestockHulbe and Fahnestock, 2007; Reference Catania, Hulbe, Conway, Scambos and RaymondCatania and others, 2012); however, as the climate warms, variability in this region of Antarctica may change, and it becomes important to distinguish between natural and forced variability. Furthermore, our understanding of natural variability in a region where it dominates is useful for interpreting changes in other regions where the influence of climate warming may be more apparent (e.g. the Amundsen Sea Embayment). Improved characterization of the magnitude of the changes that can occur, their frequency and underlying causes is required for accurate predictions of mass-balance changes for the entire WAIS.
Ice streaming occurs because of low basal drag at the ice-stream bed, which is related to the presence of lubricating subglacial meltwater (Reference Blankenship, Bentley, Rooney and AlleyBlankenship and others, 1986; Reference Engelhardt, Humphrey, Kamb and FahnestockEngelhardt and others, 1990; Reference Bentley, Lord and LiuBentley and others, 1998). Changing basal conditions with respect to meltwater over time may explain changes in ice-stream configuration and discharge. Because ice streams are characterized by low basal drag, lateral drag from the shear margins balances much of the driving stress (Reference Raymond, Echelmeyer, Whillans and DoakeRaymond and others, 2001; Reference Stearns, Jezek and Van der VeenStearns and others, 2005). Shear margins can migrate laterally at rates of up to hundreds of metres per year (Reference Bindschadler and VornbergerBindschadler and Vornberger, 1998), or they may rapidly jump in position (Reference Retzlaff and BentleyRetzlaff and Bentley, 1993; Reference Catania, Conway, Raymond and ScambosCatania and others, 2006b) changing the width of the ice stream. Margin migration may exert a strong influence on ice discharge because, for ice streams with low basal drag, the centre-line velocity increases proportionally to the fourth power of ice-stream width (Reference Van der VeenVan der Veen, 1999).
The distribution of meltwater beneath ice-stream shear margins is not well known. No large topographic barriers confine Siple Coast ice streams, so a lubrication boundary must exist where the bed transitions from thawed (under ice streams) to frozen (under the interstream ridges separating ice streams). The lubrication boundary controls the basal shear stress distribution at the margin in numerical models (Reference SchoofSchoof, 2004), affecting heat production and ultimately migration. Knowing the exact location of an ice-stream shear margin with respect to the subglacial lubrication boundary is important for understanding shear margin mechanics. Results from numerical models posit that basal lubrication is possible outside the margins (Reference SchoofSchoof, 2004), particularly for margins migrating outward (Reference Jacobson and RaymondJacobson and Raymond, 1998), but other models suggest that the basal lubrication boundary is probably located directly below the peak strain rate observed across the width of the shear margin (Reference Echelmeyer, Harrison, Larsen and MitchellEchelmeyer and others, 1994; Reference RaymondRaymond 1996). It is likely that this would be the location of greatest meltwater production (Reference SchoofSchoof, 2004; Reference Beem, Jezek and Van der VeenBeem and others, 2010). Countering this hypothesis, ice-penetrating radar data collected across an active shear margin of WIS did not show any jump in basal reflectivity (associated with an increase in basal lubrication) across the region of maximum strain rate (Reference Raymond, Catania, Nereson and Van der VeenRaymond and others, 2006).
In this paper we describe our use of a physical model to study the effects of changes in the distribution and magnitude of subglacial lubrication to an ice stream. Our experimental methodology and our approach towards scaling the model to an ice stream are presented. Our results focus on identifying the location of the ice-stream shear margins relative to the subglacial lubrication boundary, and on determining the influence of perturbations in subglacial hydrology on ice-stream margin position. Particular attention is also given to the effect of subglacial hydrology on ice-stream force balance: the partitioning of the drag forces, basal drag (rb), lateral resistance (rlat) and longitudinal resistance (rlon), which resist the gravitational driving stress (rd). These parameters provide a first-order characterization of ice streams, and their ratios can be scaled directly. Finally, we discuss how aspects of the experiments may be interpreted in the context of dynamic changes to ice streams, and how the model could be improved to strengthen those connections.
Methods
Experimental model
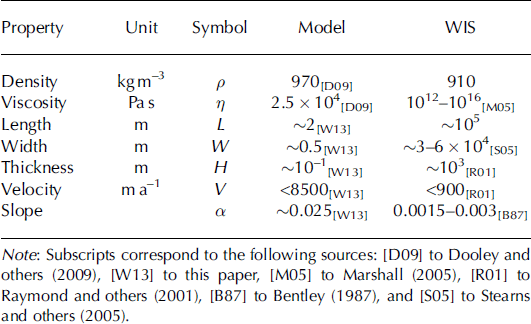
Our model (Fig. 1) consists of a flat and level 3 m x 1.25 m opaque clear plastic base with clear plastic walls on three sides and an open downstream end. Ice is represented in the model by polydimethylsiloxane (PDMS), a transparent silicone polymer (properties given in Table 1). Pressurized water is delivered beneath the PDMS through holes in the clear plastic base. Water is dyed blue in order to observe its spatial distribution, and is captured at the downstream end and recirculated through the flume to maintain consistent dye coloration.
(a) Experimental set-up viewed from overhead cameras during experiment 5. Water, dyed blue, is visible underneath the transparent PDMS. The four white circles are sub-PDMS water injection points. Black solid lines are lateral shear strain rates of the PDMS. Red lines are lateral shear margins derived from maximum lateral shear strain-rate values. Water-based lubricant was applied to the area within the dotted rectangle. Also visible is the acoustic sensor, arm and track.

Characteristic values of model (experiment 5) and ice-stream variables
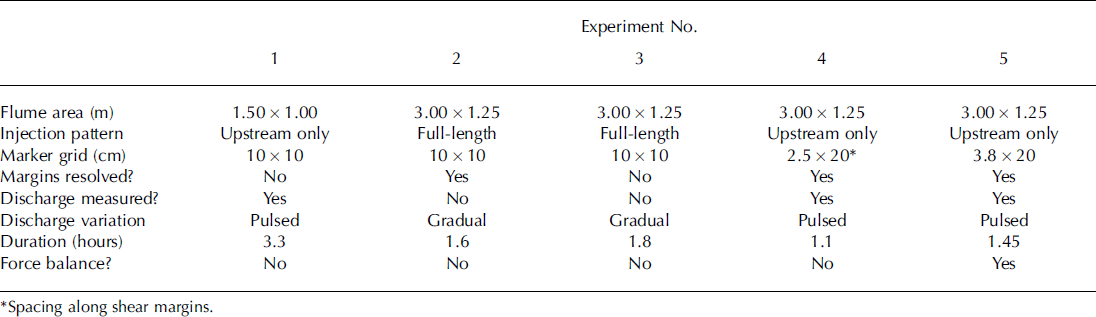
Eleven experiments were run in order to produce a fast-flowing PDMS ice stream and to observe changes in our model due to perturbations. Five experimental runs are presented here, although the experiments differed from one another in flume shape and size, in PDMS surface slope (inadvertently) and in the method, pattern, timing and changes in water discharge (Table 2). In addition, our measurement systems were refined with time, so data availability differs between experiments. All of the quantitative data presented are taken from experiments 1 , 4 and 5.
Procedural differences between experiments
The experimental procedure was similar for each experiment. Prior to loading the PDMS into the model, a thin layer of water-based lubricant was spread over the base of the model to prevent the PDMS from adhering to the plastic and to permit plug flow of the PDMS. The lubricant was applied over an area broader than our expected ice-stream width in order for model shear margins and water lubrication boundaries to develop spontaneously (Fig. 1). The PDMS was cut into manageable sections, loaded piece by piece onto the clear plastic base, and was then allowed to settle for ∼1 hour to permit the sections to merge together and achieve uniform thickness (∼6-10cm). Brightly painted wooden markers (0.9 cm diameter) were placed on the surface of the PDMS for feature tracking in photographs taken using an overhead time-lapse camera. Removing a blockade initiated downstream flow beginning from the downstream end of the flume, which created a surface gradient that propagated upstream, eventually reaching a steady form. We controlled valves underneath the flume, allowing us to choose the discharge rate of water flowing underneath the PDMS.
We collected data on PDMS surface height and velocity and sub-PDMS water discharge, although for some experimental runs the instrumentation was not in place or not working (Table 2). An acoustic sensor periodically measured the surface height of the PDMS in a lengthwise transect along the model centre (Fig. 1). Overhead photographs of the experiment were taken at 10 s intervals to track the changes in marker position across successive photographs in order to calculate PDMS surface velocity. The distribution of sub-PDMS lubrication (water) was tracked from the overhead photographs through the transparent PDMS, and we identified basal lubrication boundaries (henceforth ‘lubrication boundaries’) visually as the border between blue-dyed water and the clear plastic base. A paddle wheel flowmeter logged discharge of water into the model.
Rheological and dynamic scaling
Physical modelling is common in geomorphological studies, but is rarely seen in the study of ice sheets (for exceptions, see Reference Corti, Zeoli and Belmaggio Pand FolcoCorti and others, 2008; Reference BurtonBurton and others, 2012). Geomorphic modellers often attempt dynamic similarity (matching forces) to the natural system, which implies kinematic (matching motion) and geometric (matching form) similarity (Reference Paola, Straub, Mohrig and ReinhardtPaola and others, 2009). Our approach to scaling is twofold: (1) to determine the appropriateness of using PDMS to mimic the behaviour of ice (rheological scaling); (2) to determine if we achieve similarity in the force balance between model and nature (dynamic scaling). Our goal is to match the ratio of driving forces (gravitational driving stress) to resistive forces (lateral, longitudinal, and basal drag) in our model to the natural system (WIS). If the dimensionless ratio of forces from our model matches that of WIS (or part of WIS), then the model is dynamically scaled to the natural system.
Rheological scaling
We model ice streams using PDMS because both its density (Table 1) (and thus specific gravity) and its rheology are similar to ice. PDMS and ice have similar flow curves, in that they are Newtonian materials at low strain rates and strain-weakening materials at higher strain rates (Reference WeijermarsWeijermars, 1986). In addition, ice has a temperature-dependent rheology. However, these factors cause ice to soften within lateral shear margins, but PDMS does not undergo strain-weakening in the model because the strain rates in our experiments are too low.
Fluid flow in ice streams is laminar, meaning viscous forces dominate over turbulent forces, as shown by the Reynolds number, Re:

where p is the density, 77 is the dynamic viscosity, H is a characteristic length (we choose thickness) and v is velocity. Therefore, it is critical that flow is also laminar in our model. Using values from our experiments (Table 1), we find that Re :=s10∼5, which is well within the laminar flow regime.
Dynamic scaling
A temporally and spatially complete calculation of the force balance in our model is achieved using an acoustic sensor and overhead photography. We calculate Td, Tlat, Tlon, and use them to solve for Tb as follows:
Gravitational driving stress in the lengthwise x-direction (Fig. 1) is defined as

where H is PDMS thickness and |hx is surface slope because the model base is flat. PDMS surface height is assumed laterally constant, and is interpolated through time to cover the temporal gaps between acoustic sensor traverses.
PDMS surface velocity is used to calculate strain rates, which are translated into stresses by a constitutive law. The lateral strain rate exy and the longitudinal strain rate exx are defined as
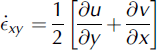

where y is the lateral dimension (across ice-stream width with zero at the centre of the model), v is the velocity in the y-direction and u is velocity in the x-direction. In the flume, v <c u, rendering the along-flow variation in lateral velocity, @@ vx, negligible.
The constitutive law for ice is written

(Reference Van der Veen and WhillansVan der Veen and Whillans, 1989), where o’ ij is the deviatoric stress directed along axis i on the plane perpendicular to j, B is the stiffness parameter, ee is effective strain rate and n is the power law exponent. Under the Newtonian assumption (n = 1) for the flow of PDMS, its constitutive law for flow in three dimensions is simply

where 77 is viscosity.
Changes in ice velocity along the length of the ice-stream ice exert a longitudinal resistance, Rxx, on the ice upstream and downstream, which is related to the deviatoric stresses by

(Reference Van der Veen and WhillansVan der Veen and Whillans, 1989) where &σ’ is the deviatoric stress; &σ’ yy and Rzz are negated in our force balance: &σ’yy because transverse velocity and its gradients are very small, and Rzz , the vertical resistive stress, because the softness of ice dictates that the vertical normal stress is always close to lithostatic. Thus

which, using the simple constitutive law for PDMS (Eqn (6)), is related to strain rate by

Lateral drag from shearing, greatest at the shear margins where the lateral gradient in downstream velocity, uy, is at a maximum, diminishes inward. The associated resistance is

or, using (Eqn (6)) to relate stress to strain rate

Drag forces are calculated from gradients in the vertically integrated resistive stresses using

(Reference Van der Veen and WhillansVan der Veen and Whillans, 1989) where the elevation of the bed is b. Eqn (12) shows the full force balance in x, including (from left to right) longitudinal drag (&Ƭlon), lateral drag (&Ƭlat), driving stress and basal drag. Vertical variations in all terms are considered negligible (verified experimentally by placing markers at depth in the PDMS), simplifying the integration to

where Eqn (13) is rearranged to solve for the x-component of basal drag, Tbx . Expressing resistive stresses as strain rates (Eqns (9) and (11)), writing the full driving stress (Eqn (2)) and keeping the viscosity, &η, constant yields the force balance equation in the x-direction:

Terms on the left-hand side of the equation are calculated using observations, and are summed to derive T bx as the residual of the force balance.
Results
Location of shear margins
The lateral shear margin centre is defined as the location of greatest absolute value of lateral strain rate, calculated from our gridded velocity data. The location of peak strain rate was calculated for every across-flow transect, and a straight-line interpolation was made between these locations for each margin (Fig. 1). This method resulted in shear margins with sharp bends and corners uncharacteristic of the smooth spatial variation of ice-stream shear margin position observed in nature. While we observe a clear preference for the shear margin to locate over the sub-PDMS lubrication boundary (in experiments 2, 4 and 5 where margin position was calculated), we find that shear margin centres sometimes also fall slightly inboard or outboard of the lubrication boundary (Fig. 1).
Margin migration
We intended to induce changes in margin position through changes in sub-PDMS water discharge, and we expected that increases in water discharge would cause an outward migration of the basal lubrication boundary, resulting in a widening and acceleration of the model ice stream. While we only measured margin migration in three experiments (Table 2), we can infer it in other experiments based on changes in the distribution of streaming velocity and the position of the lubrication boundary. We experimented with discharge methods (Table 2), but in general we perturbed the subglacial hydrological system with either slow, steady changes in discharge, or abrupt pulses. We found that the basal lubrication boundaries and the positions of the lateral shear margins were unaffected by gradual discharge perturbations, as the increased water flux was accommodated by a thickening of the water layer (observed as darkening of the blue shade of the water). Increased water discharge could also have been accommodated by increased subglacial water velocity, but we had no means to measure that property.
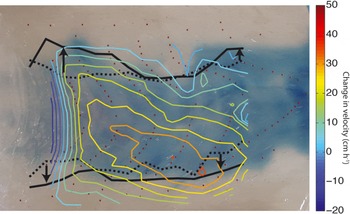
In contrast to gradual discharge changes, we found that discharge pulses were often effective at perturbing lubrication boundaries (Fig. 2). In general, we found that the lateral lubrication boundaries moved outward in association with strong discharge pulses (in experiments 1, 4 and 5). In experiment 1, the lubrication boundary migrated outward up to ∼25% of the original model ice-stream width in response to a sudden increase in discharge. This outward expansion was accompanied by the washout of sticky spots (regions within the model ice stream where the sub-PDMS water layer is thin or absent) (Fig. 3), an increase in velocity (up to 100%) and a widening of the streaming region of the PDMS. Similar behaviour was observed in experiments 4 (Fig. 2) and 5. There was usually little or no lag time in detecting the first changes to PDMS force balance or velocity as a result of discharge pulses.
Outward migration of lateral shear margins due to a discharge pulse (experiment 3). The initial measured shear margin position is shown by the dotted black line, and post-pulse measured shear margin position is shown by a solid line. Arrows indicate the direction of shear margin migration. Contours indicate the change in velocity from before the pulse to after the pulse. This photograph is taken post-increase in discharge. Refer to Figure 1 for scale.
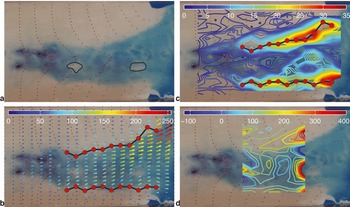
A snapshot from experiment 5 showing model sticky spots and their effect on force balance. (a) Two prominent sticky spots, referred to as ‘upstream’ (left) and ‘downstream’ (right). (b) Velocity (v; cmh–1), and maximum lateral strain-rate values at cross sections (red dots) connected to indicate lateral shear margin position. (c) Contours of lateral shear stress Rxy (Pa) and shear margin position (red dots) connected to indicate lateral shear margin position. Lateral shear is enhanced toward the ice-stream centre of the downstream sticky spot. This inner shear zone grew over time and eventually superseded the lower shear margin. (d) Basal drag (Tb) as a percentage of driving stress (rd). The highest basal drag within the ice stream is observed near both sticky spots. Low driving stress in the extreme downstream area accounts for the very high percentages. Refer to Figure 1 for scale.
Where we measured shear margin position, we found that outward migration of basal lubrication boundaries caused outward migration of shear margins. In experiment 4, this resulted in (up to) a 68% increase in the original width of the ice stream in the upstream area, and an increase in velocity (Fig. 2). We infer outward migration of shear margins coincident with outward migration of the basal lubrication boundary in other experiments because the velocity field indicated a widening of the ice stream. In one case, outward expansion of the lubrication layer occurred only over a small region and so did not result in observed shear margin movement. This is either due to the ability of shear margins to bridge heterogeneity in the lubrication boundary, or due to resolution problems in our velocity observations.
We found that the appearance of local decreases in basal lubrication (the formation of sticky spots) also caused changes in margin position, especially when these decreases occurred close to margins. The peak strain rate, and hence shear margin centre, oscillated back and forth between the lubrication boundary and a sticky spot formed in experiment 4, and, in experiment 5, a shear margin moved permanently inward 10-18 cm coincident with the maturation of a large (∼14x20cm2) sticky spot (Fig. 3a ‘downstream’), narrowing the ice stream by up to 30% in the downstream end at the end of the experiment. A persistent sticky spot further upstream and far from both margins (Fig. 3a ‘upstream’) caused a local increase in basal drag (Fig. 3d) and a decrease in velocity (Fig. 3b) of the model ice stream, but did not affect the position of either margin.
Hydrologic variability and force balance
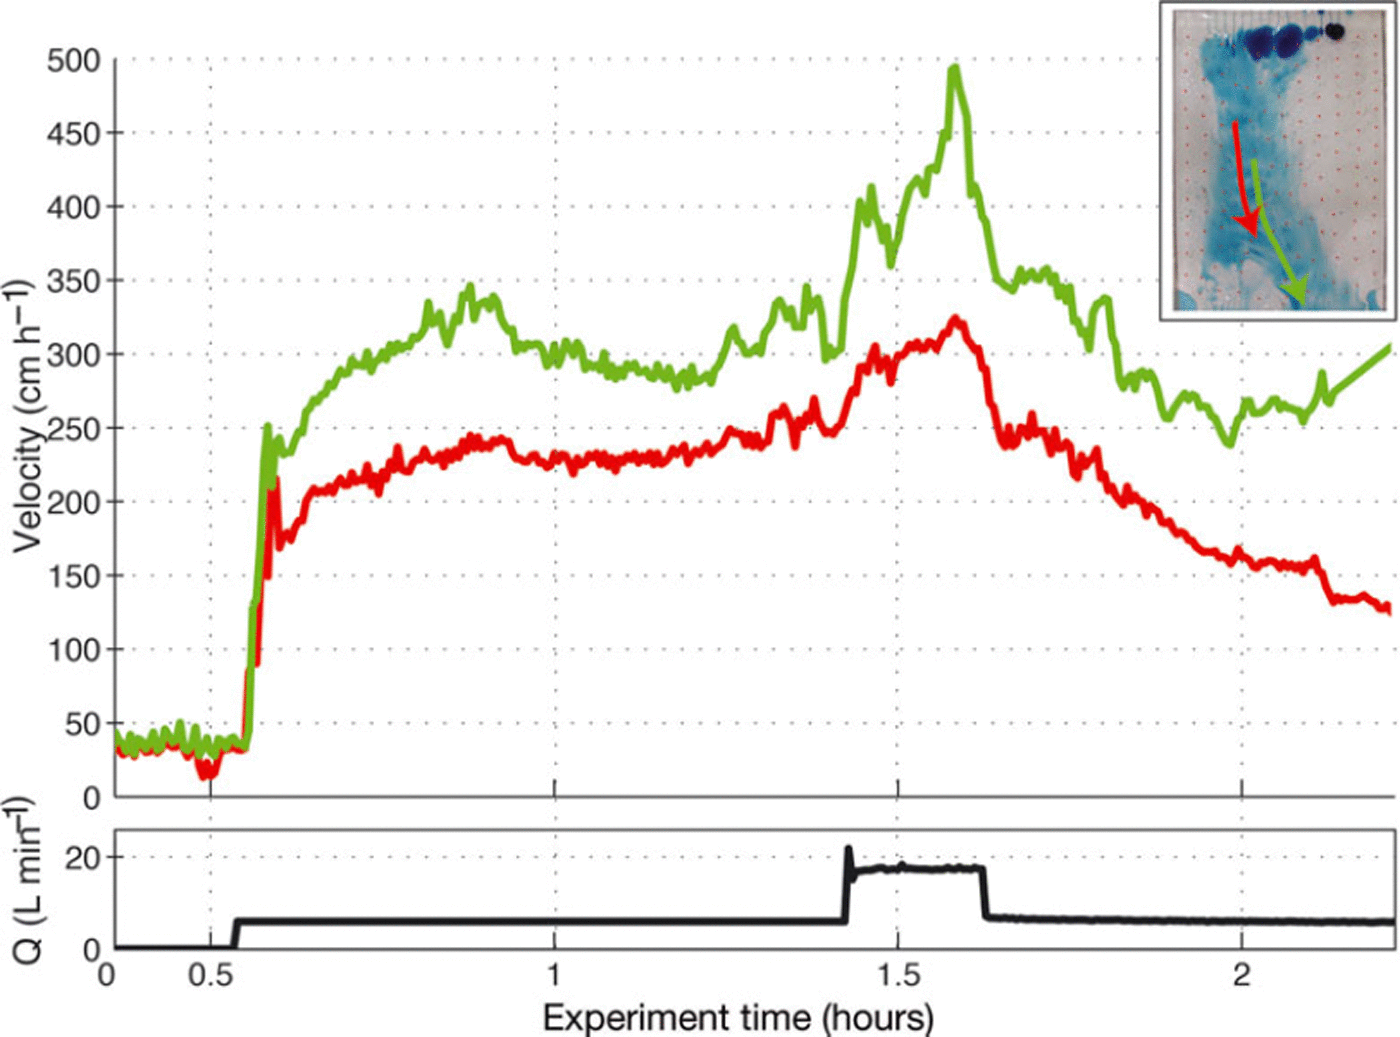
Changes in force balance and velocity were effectively forced through controlled pulses in water discharge. Discharge pulses caused a velocity response over a widespread area: sudden increases in discharge caused a speed-up, and sudden decreases caused deceleration (Figs 2, 4 and 5). Widespread acceleration occurred through a combination of widening of the model ice stream (Fig. 2) and a decrease in basal drag (Fig. 5c and d). Sticky spots grew in size and number after sharp decreases in discharge, especially when discharge was reduced to near zero.
Time series of Lagrangian velocity and discharge for experiment 1 , colour-coded to their trajectories shown in the inset. Arrow indicates downstream direction. This is a characteristic pulsed discharge event.
(a) Time series of the force-balance terms for the trunk region. Both raw observations (faded dots) and observations smoothed with a ten-point running mean (line) are shown. (b) Time series of discharge (black line), and local Eulerian velocity at the trunk region (faded dots) smoothed with a ten-point running mean (solid brown line). (c) Time series of the force-balance terms for the downstream sticky spot region. Both raw observations (faded dots) and observations smoothed with a ten-point running mean (line) are shown. (d) Time series of discharge (black line) and local Eulerian velocity at the downstream sticky spot region (faded dots) smoothed with a ten-point running mean (solid brown line).
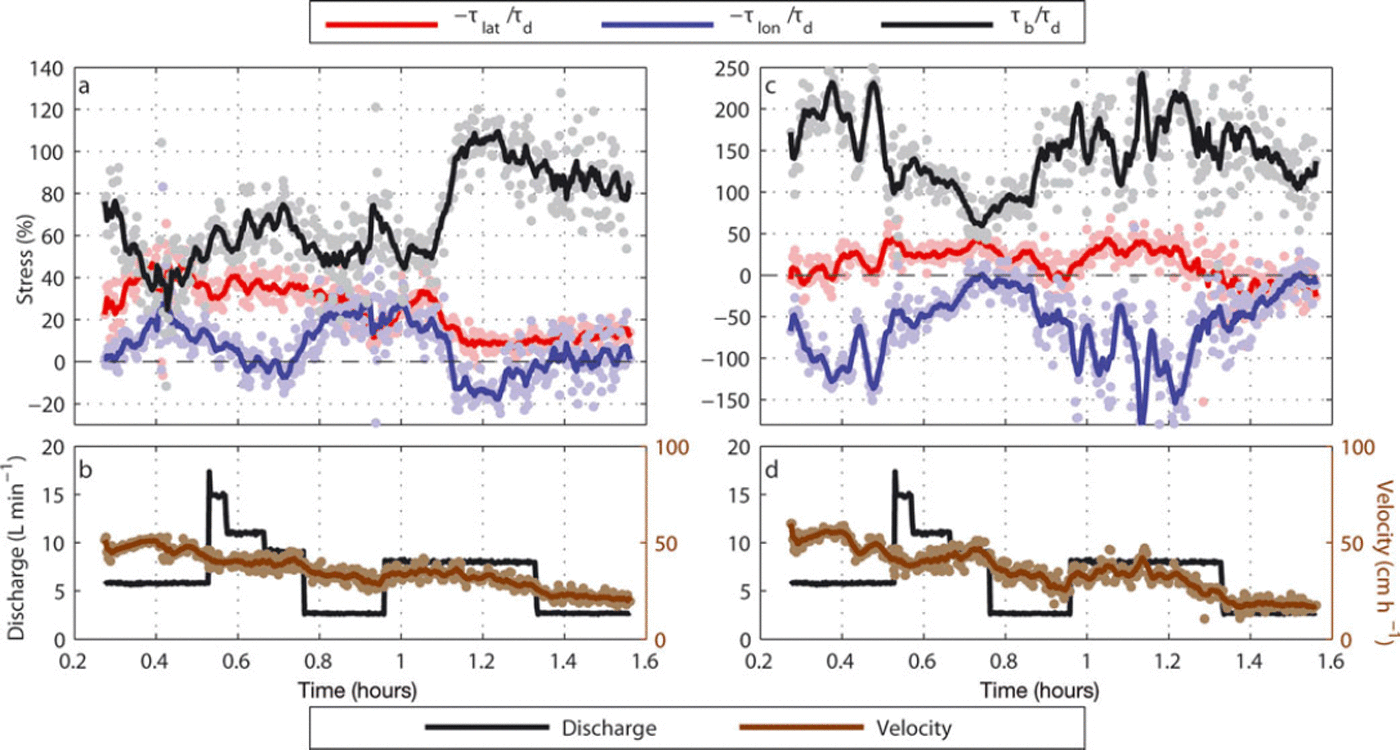
We also observed local sensitivity in velocity due to heterogeneity in the distribution of sub-PDMS water. This was most evident when sticky spots caused local increases in basal drag, resulting in a slowdown of the PDMS in the region and longitudinal compression directly upstream (Figs 3 and 5). Sticky spots grew larger during periods of low discharge, and some discharge pulses washed out sticky spots, reducing basal drag and eliminating longitudinal compression (Fig. 5c and d). The long-term decrease in veocity of the PDMS (Fig. 5b and d) is related to thinning and flattening of the surface slope over time and is not necessarily due to changes at the bed.
Discussion
Our model ice stream is a simple representation of real ice streams and does not accurately represent many of the important controls on ice-stream flow, including thermodynamics (and thus strain-heating), tidal motion, the rheological properties of till and ice fracture. Despite this, our experiments allow us to make basic observations of how ice-stream force balance and geometry may change as a result of changes in subglacial hydrology.
Comparing the model to an ice stream
We attempt to reproduce the force balance of WIS because there are many observational datasets available for this ice stream, and its ongoing dynamic changes may provide insight for comparison and interpretation of model results. Between 1987 and 1997, WIS slowed along its entire length (as much as 7.2 m a- 2 downstream of its onset region), and migration of its northern shear margin caused both narrowing and widening along the ice-stream length (Reference Stearns, Jezek and Van der VeenStearns and others, 2005). These changes to the WIS force balance are thought to indicate a strengthening of the bed over time, in part because the driving stress decreased by less than only 1% over the decade 1987-97 during which ice-stream slowdown is observed (Reference Stearns, Jezek and Van der VeenStearns and others, 2005). The model ice streams also slow over time, but this is due to a combination of decreased driving stress as the PDMS thins and the surface slope flattens, and an increase in basal drag as lubricant is carried away by the sub-PDMS water. Thus, while both systems experience slowdowns, their force balances evolve somewhat differently in time.
Despite strengthening at the bed, WIS remains a side-drag-dominated ice stream with the margins resisting ∼ 70-85% of the driving stress throughout the downstream reaches of the ice stream (Reference Stearns, Jezek and Van der VeenStearns and others, 2005). The shear margins resist a much smaller percentage of the driving stress in the ice-stream onset regions (22-53%), largely because the driving stresses are relatively high (Reference Stearns, Jezek and Van der VeenStearns and others, 2005). Ice-stream transverse velocity profiles are evidence of the relative contributions of basal and side drag to the force balance, with a theoretical ‘V-shaped’ profile in map view indicative of a basal-drag-dominated flow regime, more typical in onset regions (Reference Whillans, Jackson and TsengWhillans and others, 1993). A lateral-drag-dominated (margin-controlled) ice-stream velocity profile approaches plug flow (Reference Whillans, Jackson and TsengWhillans and others, 1993) and thus has a characteristic ‘U-shaped’ velocity profile, more typical in trunk regions of ice streams. Our model velocity profile more closely approximates those found in the onset region of WIS (Reference Echelmeyer, Harrison, Larsen and MitchellEchelmeyer and others, 1994). Additionally, in the calculated model force balance, basal drag usually exceeds lateral drag in the model trunk (defined here as the middle third of the model ice stream’s lateral extent between the upstream and downstream sticky spots) (Fig. 5a), and especially over the sticky spot (Fig. 5c), although it is temporally and spatially (Fig. 3d) variable. The percentage of driving stress resisted by lateral drag in our model trunk (Fig. 5a) is within the range of an onset region (Reference Stearns, Jezek and Van der VeenStearns and others, 2005). For these reasons, we conclude that our model best represents an ice-stream onset region, and possibly the transitional region between the onset region and the trunk.
In each experimental run we observed the formation of sticky spots. We suspect that these sticky spots form either as a result of boudinage – extension of the PDMS sandwiched between two less-viscous fluids (air and water) – which creates variability in PDMS thickness, or because of heterogeneity in the application or dissolution of the water-based lubricant. Sticky spots have long been predicted at the bed of WIS because homogeneous saturated till cannot impart even the small amount of basal drag found under the ice streams, and so basal drag must concentrate elsewhere (Reference Echelmeyer, Harrison, Larsen and MitchellEchelmeyer and others, 1994). In contrast to the model sticky spots, ice-stream sticky spots form either because of local strengthening of the subglacial till or because of bedrock protuberances (Reference Stokes, Clark, Lian and TulaczykStokes and others, 2007). These may be fixed in space. In our experiments, we observed along-flow migration of the sticky spots at a slower rate than the flow of PDMS. Despite these differences, the presence of sticky spots provides an opportunity to observe how an ice stream might respond to localized increases in basal drag. In ice streams, such increases in basal drag may occur as a result of basal freeze-on. Freeze-on both de-waters the substrate and strengthens the till, and may have caused the stagnation of the Kamb Ice Stream (KIS) (Reference Tulaczyk, Kamb and EngelhardtTulaczyk and others, 2000; Reference Christoffersen and TulaczykChristoffersen and Tulaczyk, 2003) and the current slowdown of WIS (Reference Joughin, Tulaczyk, MacAyeal and EngelhardtJoughin and others, 2004, Reference Joughin2005).
Factors controlling margin position
To within the resolution of our measurements, the lateral shear margins in our model are controlled by basal conditions, and are located at the lateral edge of the sub-PDMS hydrological system. This relationship has been hypothesized for ice streams for two main reasons (1) in the absence of any topographic or lithologic discontinuities at shear margin locations, there must exist a jump in basal drag in order to produce the strain rates observed (Reference Raymond, Echelmeyer, Whillans and DoakeRaymond and others, 2001); (2) there is probably sufficient strain heating within margins to produce meltwater (Reference SchoofSchoof, 2004; Reference Beem, Jezek and Van der VeenBeem and others, 2010). Despite these hypotheses, radar observations over the northern shear margin of WIS did not detect water beneath the location of peak strain rates measured in the margin (Reference Raymond, Catania, Nereson and Van der VeenRaymond and others, 2006). Reference Raymond, Catania, Nereson and Van der VeenRaymond and others (2006) suggested two possible explanations for this discrepancy: either strain-heating produces very fresh meltwater that may be invisible to radar, or the subglacial hydraulic boundary is located slightly further inboard of the shear margins (toward the middle of the ice stream) than the extent of the surveys. The freshwater hypothesis is supported by the modelling of Reference Beem, Jezek and Van der VeenBeem and others (2010), who find high melt rates at shear margins and a layer of thick, fresh water beneath them. However, there is also evidence that subglacial lubrication boundaries may be located at a distance of the order of one shear margin width inboard of shear margins, although these observations were for stagnated ice streams (Reference Catania, Conway, Gades, Raymond and EngelhardtCatania and others, 2003).
While we observe good correlation between shear margin position and basal lubrication boundaries, misalignment may occur because we lack the ability to detect shear margin position at a resolution that matches that of the basal lubrication boundary. This makes it impossible to determine how closely the lateral shear margin follows the small-scale variability in the basal lubrication boundary. If the basal lubrication boundary at the lateral edges of ice streams is not smooth and exhibits spatial variability (as in the experiments), then the position of ice-stream shear margins reflects the average or smoothed position of the location of the basal lubrication boundary. In this case, the lack of evidence of a basal lubrication boundary in the radar data of Reference Raymond, Catania, Nereson and Van der VeenRaymond and others (2006) could mean that their profiles happened to occur at locations where the basal lubrication boundary and the shear margin were misaligned. However, if ice-stream shear margins produce enough meltwater to lubricate the bed, the basal lubrication boundary is likely to be co-located with the shear margins and thus also smoothly varying. While we cannot argue for one interpretation based on our model experiments alone, it is possible that the lubrication boundaries beneath ice streams exhibit heterogeneity which is not reflected in the surface expression of shear margins.
Perturbations to margin position
Our experiments show that changes in basal drag that occur near ice-stream shear margins may induce large changes in ice-stream width, both inward and outward. In ice streams, variation in basal drag near the shear margin may arise from filling and draining of subglacial lakes (Reference Fricker, Scambos, Bindschadler and PadmanFricker and others, 2007). WIS overlies several small subglacial lakes, some of which occur near its shear margins, and our observations indicate that changes in lake volume could affect local basal drag and may explain some of the observed temporal variability in ice-stream margin position and discharge. We therefore suggest that the position of an ice-stream shear margin is sensitive not only to the lubrication beneath (and possibly outside) it, but also to changes in lubrication in regions broadly adjacent to it.
The shutdown of KIS, an ice stream north of WIS, may offer evidence of this sensitivity. Reference Catania, Scambos, Conway and RaymondCatania and others (2006) suggest that basal freezing in an area just inboard of the oldest KIS shear margin caused the northern KIS shear margin to jump inward, narrowing and slowing the ice stream by about 30% of its original width. This 30% narrowing is of roughly the same magnitude (after normalization by ice-stream width) as occurred in the downstream reaches of our model ice stream (experiment 5) due to the downstream sticky spot.
Perturbations to velocity
In general, we observe increased PDMS velocity during pulsed water discharge events (Figs 2, 4 and 5) and decreased PDMS velocity resulting from decreases in water discharge (Figs 4 and 5). We neglect the frictional force of the flowing sub-PDMS water layer on the base of the PDMS, and assume that changes in model ice-stream velocity are a consequence of changes in basal drag (Fig. 5) or a combination of changes in width and changes in basal drag (Fig. 2). Velocity was most sensitive to water discharge changes when initial or final discharge fell to near zero, suggesting higher sensitivity when subglacial water is scarce.
Even the largest sticky spot (Fig. 3 ‘downstream’) experienced a decrease in areal extent in response to a pulsed discharge increase (Fig. 5d), which resulted in decreased basal drag (Fig. 5c), decreased longitudinal compression (Fig. 5c) and an increase in the velocity of the overlying PDMS (Fig. 5d). Flooding of sticky spots reflects an increase in sub-PDMS water storage, so our observations of coincident increased water discharge and velocity agree with findings that increased storage of subglacial water affects glacier velocity more than absolute water discharge (Reference Bartholomaus, Anderson and AndersonBartholomaus and others, 2008; Reference SchoofSchoof, 2010). Gradual changes in water discharge probably affect the sub-PDMS water system less because the drainage network has more time to adapt, whereas pulses cannot be immediately accommodated and thus cause an increase in storage.
While widespread, sudden increases in water discharge beneath ice streams are not common, subglacial lakes can spontaneously drain beneath glaciers and ice streams. As an example, the drainage of subglacial lakes that then routed beneath Byrd Glacier caused a 10% increase in velocity that was maintained for the duration of the lake drainage (Reference Stearns, Smith and HamiltonStearns and others, 2008). Byrd Glacier is confined laterally by the Transantarctic Mountains and thus cannot widen, but the Siple Coast ice streams are generally unconstricted laterally; thus we suggest that such ice streams may widen and accelerate should they be subject to similar pulses of subglacial water.
Conclusions
Experimental ice streams were scaled dynamically to the onset regions of WIS. The model ice streams experienced changes to width, velocity and force balance as a result of changes to the sub-PDMS hydrology. We found that abrupt changes in basal drag at the boundary between a dry and watered bed in the model cause formation of lateral shear margins even when the distribution of water at the margins is not smoothly varying in space. It is not clear (at our observational resolution) how closely the lateral shear margins follow small-scale variability in the basal lubrication boundary. Should ice-stream shear margins overlie heterogeneous and irregular boundaries as in our experiments, their smoothly varying position at the surface of the ice stream probably reflects an average of the spatial variability in basal drag. Ice-stream shear margins may produce their own lubrication, suggesting an innate connection and alignment with the underlying lubrication boundaries, but our experiments show that shear margins develop over, and migrate along with, lubrication boundaries even if they do not produce their own meltwater.
In addition, we found that local reductions in basal lubrication (observed as sticky spots in our model) affect the local force balance by causing longitudinal compression, lateral shear and a decrease in local velocity. When sticky spots occur near shear margins they can induce inward margin migration that triggers further changes in force balance. Pulses of subglacial water can force an expansion of the lubricated area beneath our model ice streams by overwhelming the drainage system and causing the ice stream to widen.
Because our simplified model is scaled dynamically to parts of an ice stream, we believe its dynamic behaviour in response to perturbations in basal hydrology is informative as to how ice streams in nature may respond to perturbations in hydrology. Our modelling investigation could be improved both in experimental design and in the methodology of data collection. The model remains basal drag-dominated, despite attempts to reduce the basal drag. Modification of the model bed (e.g. application of a plastic film over the Plexiglas to curtail formation of sticky spots) may ultimately be required to address this problem. A suite of experiments in which key variables are methodically varied or kept constant would allow us to better isolate their effects. For example, WIS is slowing despite very little change in its driving stress; a model run in which driving stress is held constant would allow more direct comparisons to WIS. Data quality hampered efforts to calculate model force balance and shear margin position. The low spatial resolution in our velocity data could probably be improved by even finer grid spacing than we attempted, allowing for a closer inspection of shear margin position relative to sub-PDMS lubrication boundaries, and finer resolution of force-balance terms. The low temporal resolution of PDMS thickness might have masked temporal changes in the model driving stress. An attempt to detect the surface with a three-dimensional infrared projector was unsuccessful because the projected grid was too coarse to see the small surface markers, and the PDMS surface itself is transparent to visible and infrared light. Additional instrumentation to measure basal shear stress could improve or validate the force-balance calculation.
Acknowledgements
This research was conducted with support from the Jackson School of Geosciences at the University of Texas at Austin, and with wide-ranging help from Joe MacGregor, Lauren Andrews and Michael Markowski. We also thank David Mohrig and James Buttles, who assisted with experimental design and read a previous version of the manuscript. Finally, we thank our scientific editor, Richard Hindmarsh, and two reviewers, Alexander Jarosch and an anonymous reviewer, for their careful revisions.



