“Overreliance on conventional testing has greatly limited modern research on intelligence”. (Hunt, Reference Hunt2011, p. 24)
Decades ago, scientists discussed about intelligence assessment in the XXI century (Detterman, Reference Detterman1979; Horn, Reference Horn1979; Hunt & Pellegrino, Reference Hunt and Pellegrino1985; Resnick, Reference Resnick1979) and the main conclusions can be summarized around three points: use of computers, adaptive testing, and simulation of everyday problem solving situations.
Computers have been used to develop tasks for testing cognitive processes such as working memory, attention, processing speed, or visual search (Lavie, Reference Lavie2005; Miyake, Friedman, Quiroga et al., 2011; Rettinger, Shah, & Hegarty, 2001; Santacreu, Shih, & Quiroga, Reference Santacreu, Shih and Quiroga2011; Wilding, Munir, & Cornish, Reference Wilding, Munir and Cornish2001), but intelligence is still mainly measured by paper and pencil tests. This happens even when these printed-type intelligence tests can be administered using computers without modifying their main psychometric properties (Arce-Ferrer & Martínez-Guzmán, Reference Arce-Ferrer and Martínez-Guzmán2009). In this regard, Rubio and Santacreu (Reference Rubio and Santacreu2003) elaborated an adaptive computerized intelligence test that has scarcely been sold and even retired from the publisher’s catalog. Thus, for intelligence, computerized assessment has not been generalized.
Adaptive testing enables reduced testing time, adjustment between difficulty levels and examinees’ ability, and improvement in the obtained ability estimates (ETS, Pearson & CollegeBoard, 2010; Weiss & Kingsbury, Reference Weiss and Kingsbury1984). When adaptive testing supports computerized tasks, the evaluation allows individualized administration, response time registering, immediate feedback, or Speed Accuracy Trade Off –SATO- corrections.
Simulation of everyday problem solving situations has been used in different occupational areas (Gray, Reference Gray2002) such as flight training (Hays, Jacobs, Prince, & Salas, Reference Hays, Jacobs, Prince and Salas1992), teamwork, leadership and planning (Szumal, Reference Szumal, Silberman and Philips2000), education (Lunce, Reference Lunce2006) or medicine (Byrne, Hilton, & Lunn, Reference Byrne, Hilton and Lunn2007). Some of these simulations take advantage of video game environments. Sitzmann (Reference Sitzmann2011) has shown that studies using active job training procedures based on video games produce better indexes of declarative knowledge, procedural learning, and retention rate.
However, neither of the above did devise the revolution that video consoles and video games have involved for the general population. Nobody anticipated that these changes would be implemented into games, and even that a new domain would appear: ‘gamification’. This topic refers to the application of game mechanics and design techniques to engage and motivate people to attain their goals at work, in the school or everyday life settings (Burke, Reference Burke2014).
Video games
The first video game created in the 80s for analyzing cognitive processes was Space Fortress (Mané & Donchin, Reference Mané and Donchin1989). From the eyes of a video gamer from the XXI century it looks as an arcade game (http://hyunkyulee.github.io/research_sf.html), very simple in terms of graphic design and in 2D. Using this video game, Rabbitt, Banerji, and Szymanski (Reference Rabbitt, Banerji and Szymanski1989) analyzed the correlations between intelligence and video game performance through practice (five successive days). For measuring intelligence the AH4 was administered (Heim, Reference Heim1967). The obtained correlations from 56 participants ranging from 18 to 36 years old were: .283 for the first session, .422 with the slope learning function and .680 with maximum scores. Rabbitt et al. (Reference Rabbitt, Banerji and Szymanski1989) concluded: “a relatively unsophisticated video-game, on which performance may reasonably be expected to be independent of native language or acquired literacy, and which is greatly enjoyed by young people who play it, rank orders individual differences in ‘intelligence’ nearly as well as pencil and paper psychometric tests which have been specially developed for this purpose over the last 80 years” (p. 13).
Since this pioneer study, none was devoted to this topic until the XXI century. Recently, researchers have analyzed custom games to measure abilities (McPherson & Burns, Reference McPherson and Burns2007; Reference McPherson and Burns2008; Ventura, Shute, Wright, & Zhao, Reference Ventura, Shute, Wright and Zhao2013) or casual video games to test the cognitive abilities they might be tapping (Baniqued et al., Reference Baniqued, Lee, Voss, Basak, Cosman, DeSouza and Kramer2013). Twenty years after, scientists are recovering the topic, probably because people have incorporated video games into their lives and, also, developing video games is now affordable.
In Europe data from the quarter 3 2015 by GameTrack (Interactive Software Federation of Europe/IpsosMediaCT, 2015) show an average percentage of population playing any type of game from 40 in UK to 62 in France (42% for Spain), for 6 to 8 hours per week. There are differences by age, but not interaction age by sex. Among the youngest (6 to 15 years old) 85% play, on average, any type of game. These figures decrease to 55% for 15 to 34 years old, and for the oldest group (45 to 64 yrs.) it is an 18%. Furthermore, people prefer consoles, computers and smartphones to handhelds or tablets. For USA citizens during 2014, data from the ESA (Entertainment Software Association, 2014) show that 59% of the population plays video games. People of all ages play video games: 29% under 18, 32% from 18 to 35 and 39% over 36 years old. No differences by sex were observed: 52% males and 48% females. 51% of USA households have a dedicated console. And more noticeable, figures increase yearly, in both Europe and USA.
One relevant question is: are video games something more than a way for investing free time? Granic, Lobel, and Engels (Reference Granic, Lobel and Engels2014) have summarized four groups of benefits of playing video games: cognitive, motivational, emotional and social. The mentioned cognitive benefits are: training spatial abilities, changing neural processes and efficiency, as well as developing problem-solving skills and creativity enhancement. Importantly, if challenging enough, video games cannot be automated and, therefore, they could be used for testing purposes (Quiroga et al., Reference Quiroga, Román, Catalán, Rodríguez, Ruiz, Herranz and Colom2011). The same is true for the repeated administration of an intelligence test: if you are not able to deduce the more complicated rules the test includes, your performance will not improve.
Video games for measuring intelligence
Quiroga, Colom et al. (Reference Quiroga, Colom, Privado, Román, Catalán, Rodríguez and Ruiz2009), Quiroga, Herranz et al. (Reference Quiroga, Herranz, Gómez-Abad, Kebir, Ruiz and Colom2009) study was similar to Rabbitt et al.’s (Reference Rabbitt, Banerji and Szymanski1989) study. The focus was to analyze the effects of repeated playing to elucidate if practice leads to learning how to play and, ultimately, automatization. Three games from Big Brain Academy by Nintendo® were considered. Participants played five times each game in each session (1 session per week; two weeks between sessions). Obtained results showed that all participants improved their skill (d’s from .72 to 1.64) but more importantly, correlations between g (factor score obtained from a battery of tests) and video game performance through practice varied for the three games. One of the games showed increased correlations with intelligence (from .49 to .71), leading to the conclusion that some video games are not automated (consistent with Rabbitt et al., Reference Rabbitt, Banerji and Szymanski1989).
However, perhaps some games require a higher amount of practice to be automated. For checking this issue, Quiroga et al. (Reference Quiroga, Román, Catalán, Rodríguez, Ruiz, Herranz and Colom2011) increased substantially the number of practice sessions from 2 to 5 weeks, from 10 blocks of ten items to 25 blocks of ten items. Results showed that even with this very intensive practice, some video games couldn’t be automated (correlations between intelligence and performance remained stable across playing sessions: from .61 to .67) while others clearly show a different pattern (initial correlations were .61, but they decreased through practice to a value of .32). The fit between the expected and obtained patterns of correlations was very high: .65 and .81, respectively. As noted by Rabbitt et al. (Reference Rabbitt, Banerji and Szymanski1989) “high correlations between test scores and game performance may occur because people who can master most of the wide range of problems included in IQ tests can also more rapidly learn to master complex systems of rules, to attend selectively to the critical portions of complex scenarios, to make rapid and correct predictions of immanent events and to prioritize and update information in working memory” (p. 12).
Therefore, some video games seem to require intelligence each time they are played, but which abilities tap the different video games? Even more important, is intelligence measured by paper and pencil tests the same, at the latent level, than intelligence measured by video games?
Using 20 casual games and 14 tests measuring fluid intelligence, spatial reasoning, perceptual speed, episodic memory and vocabulary, Baniqued et al. (Reference Baniqued, Lee, Voss, Basak, Cosman, DeSouza and Kramer2013) found that games categorized as measures of working memory and reasoning were highly correlated with fluid intelligence tests (r = .65). Quiroga et al. (Reference Quiroga, Escorial, Román, Morillo, Jarabo, Privado and Colom2015) administered 10 tests measuring five abilities (Gf, Gc, Gv, Gy, and Gs) and twelve console games (representing four abilities’ domains: memory, visualization, analysis, and computation). Results showed extremely high correlations between the latent factor for video games and for the g factor (r = .93).
Therefore, two different types of video games, two different intelligence tests’ batteries, but the same conclusion: intelligence can be measured with commercial video games. The hypothesis by Hunt and Pellegrino (Reference Hunt and Pellegrino1985) regarding the influence of the device used for presenting the items (paper and pencil or computer) fails to substantiate.
The study by Quiroga et al. (Reference Quiroga, Escorial, Román, Morillo, Jarabo, Privado and Colom2015) included 12 games, and 10 of them came from Big Brain Academy® for Nintendo Wii®. Perhaps the high correlation obtained between the two latent factors (g and Video Game Performance) is due to the fact that the so-called “brain games” have been elaborated paralleling paper and pencil tests or lab tasks. Here we will test if intelligence can be measured with a commercial video game designed just for entertainment (leisure game), and if so, if we can create an Intelligence Test based on the game.
STUDY 1
Method
Participants
Participants were recruited from the Faculty of Psychology at the Universidad Complutense de Madrid (UCM) and from Colegio Universitario Cardenal Cisneros (CUCC) also located in Madrid, through flyers advertising to participate in a video game study. 55 people applied to participate, but 47 completed the whole experiment (38 women and 9 men). The mean age was 19.6 (SD = 1.65, range 18–25). Participants had no previous experience with the Nintendo DS or with the video game.
All participants signed an informed consent form, and accepted to avoid playing at home the video game they were playing in the Lab, during the 6 weeks required for completing the experiment. Upon study completion, participants received an exemplar of the video game played as gratification for their participation.
Procedure
Abilities’ tests and Video Games Habits Scale (VGHS; Quiroga et al., Reference Quiroga, Román, Catalán, Rodríguez, Ruiz, Herranz and Colom2011) were group administered in the first session and demographic data were collected. Afterwards, each participant agreed with the researchers the days per week (from Monday to Thursday) he/she will come to the Lab for playing one hour with the video game. Participants should complete 15 hours of playing, during 6 weeks at a maximum rate of 4 hours per week.
Researchers did provide consoles and video games to each participant, and saved the game each time after completing an hour of playing, on a flash memory card (Secure Digital Card or SD). Consoles and video games remained in the lab during the 6 weeks.
Materials
Abilities tests administered were the Abstract Reasoning (AR), the Verbal Reasoning (VR) and the Spatial Reasoning (SR) subtests from the Differential Aptitudes Test Battery, level 2 (Bennett, Seashore, & Wesman, Reference Bennett, Seashore and Wessman1990; DAT-5 Spanish adaptation by TEA in 2000). Internal consistency values for AR and SR were excellent (.83 and .90) and adequate for VR (.78).
The selected video game was “Professor Layton and the curious village”® for Nintendo DS®, because it had been released only some months before starting our study (2009), and, therefore, it was unknown. This is a puzzle adventure game based on a series of puzzles and mysteries given by the citizens of towns that Professor Hershel Layton® and Luke Triton® visit. Some puzzles are mandatory, but it is not necessary to solve all the puzzles to progress through the game. However, at certain points in the story guiding the game, a minimum number of puzzles must be solved before the story can continue.
In 2015, Professor Layton has become a series consisting of six games and a film. By April 2015 the series has sold more than 15 million copies worldwide. From each participant, several outcomes from the video game performance were saved, from the many the video game provides: (1) number of puzzles found per hour of playing; (2) number of puzzles solved per hour of playing; (3) number of points (games’picarats) per hour and time needed to complete the video game if less than the maximum allowed of 15 hours.
The “Video Games Habits Scale”, was developed by Quiroga et al. (Reference Quiroga, Román, Catalán, Rodríguez, Ruiz, Herranz and Colom2011). It consists of 16 questions covering the whole aspects of the playing experience: amount of time spent playing (hours per week), types of devices used, and type of video games played. For this study only answers to the first 6 questions were considered.
Results
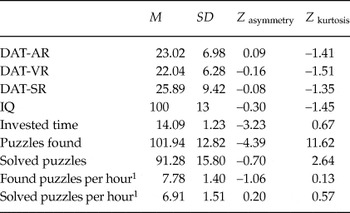
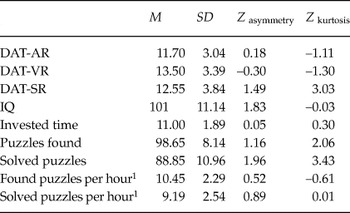
First of all, ability scores were factor analyzed (principal axis factoring, PAF) to obtain a g score for each participant that was transformed into the IQ scale (M = 100, SD = 15). Factor loadings were .92 for AR, .78 for SR and .76 for VR. The percentage of explained common variance was 68%. Table 1 includes descriptive statistics for the ability measures, computed IQs and video game outcomes. All ability measures showed proper distributions (standard asymmetry and kurtosis values < 2.00) while some video game outcomes did not. Invested time and number of found puzzles showed a high negative asymmetry, meaning that a high percentage of participants needed almost the maximum time allowed to complete the game and also a high percentage of participants found a great number of puzzles.
Descriptive statistics for abilities tests and video game outcomes (N = 47)

Note: 1These variables refer only to the first 11 hours of playing.
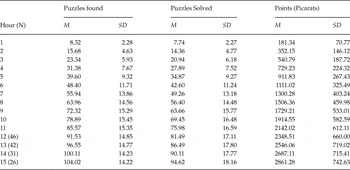
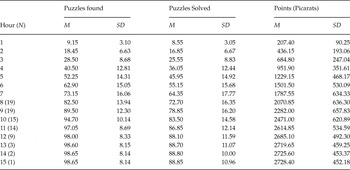
Table 2 shows descriptive statistics per hour for the video game outcomes. Video game outcomes provided by the console are aggregated. This is important because disaggregated measures are meaningless due to the fact that not all parts of the game include the same number of puzzles.
Descriptive Statistics

Note: Sample size decreases from the 11th hour, due to participants that had already completed the video game.
Figure 1 includes the correlations between IQ scores and video game performance (puzzles found and puzzles solved). The pattern of correlations shows an increasing value from the first hour to the 11th, both for found and for solved puzzles. The difference between correlation values is statistically significant in both cases (Z found puzz. = 3.51 > Z c = 1.96; Z solved puzz. = 3.65 > Z c = 1.96) from hour 1 (r g-found puzz. = .073; r g-solved puzz. = .198) to hour 11 (r g-found puzz. = .657; r g-solved puzz. = .586). After the 11th hour, correlations decrease, probably due to the sample size reduction caused by the fact that some participants have completed the video game. The correlation between g scores and invested time to complete the video game was r = –.522 (p < .001). Interestingly, participants with high and low IQ scores (over 100 and bellow or equal 100) clearly differed in the time required for completing the video game (M High IQ = 13.58, SD = 1.24; M Low IQ = 14.61, SD = .99; F(1, 45) = 9.78, p = .003; d = –.92). Participants with high IQ scores required, on average, one hour less to complete the game. Importantly, the 95% Confidence Interval showed no overlap between groups (High IQ: 13.06 to 14.11; Low IQ: 14.18 to 15.04).
Correlations between g and video game performance through practice.

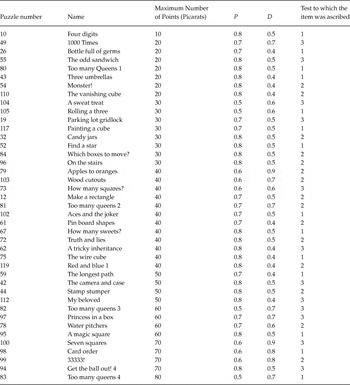
Because of the high relationship observed between intelligence and video game performance through practice, difficulty (P) and discrimination (D) indices were computed for each puzzle to select the best ones to elaborate a test. P index represents the proportion of examinees correctly answering the item. D index represents the fraction of examinees from the upper group correctly answering the item minus the fraction of examinees from the lower group correctly answering the item. To compute these indices, the formulae provided by Salkind (Reference Salkind1999) were used. The maximum value of D is 1.0 and is obtained when all members from the upper group (27% with the highest scores) succeed and all members from the lower group (27% with the lowest scores) fail on an item. Table 3 includes these indices for the 41 puzzles with P and D values > .40. Only 36 participants had completed data for these puzzles. With these 41 puzzles, a test and three equivalent versions were elaborated (VG-T1k = 14 puzzles; VG-T2k = 14 puzzles and VG-T3k = 13 puzzles) similar in P and D indices (F(2, 40) = 1.12, p = .337 and F(2, 40) = 1.794, p = .180. respectively). The obtained reliabilities (internal consistency) for the whole puzzles test and the three equivalent versions were: .937, .823, .806 and .840.
Selected puzzles from “Professor Layton and the curious village” with Difficulty (P) and Discrimination (D) indices ≥ .40

Note: Puzzles have been ordered by maximum number of “picarats” (points) that can be obtained in each.
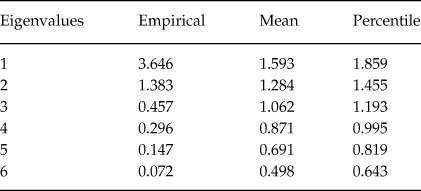
Afterwards, a parallel analysis was computed with the three ability scores and the three video game tests scores to determine the number of factors that best represent the shared variance. Table 4 includes the obtained results showing a different solution whether the mean or the 95th percentile is used as criterion. With the mean, 2 factors could be a good solution because the eigenvalue is higher than the one simulated with the mean. With the 95th percentile, results should be grouped in one single factor. Thus two Exploratory Factor Analyses were run. Oblimin rotation was used for the two factors solution.
Parallel analysis for the three ability tests and the three video game tests

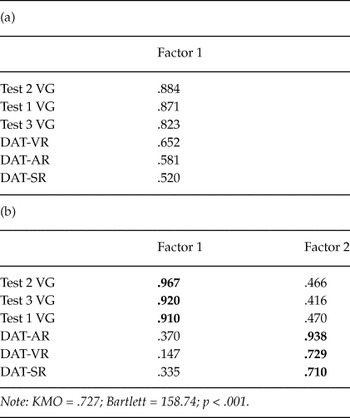
Table 5 includes both factorial solutions. Explained variance for the one factor solution is 54.17%, whereas explained variance for the two factors solution is 76.21% (57.30% for the first factor and 18.83 for the second); the correlation between the two factors is .478. Note that factorial outcomes from small samples are unstable, and, therefore, replication is mandatory (Thompson, Reference Thompson2004).
Factor solutions for one and two factors with the ability and video game tests

Discussion
Results obtained in this first study show that video game performance, measured either with Found Puzzles or Solved Puzzles, shows an increased correlation with intelligence through practice. This suggests that playing requires the systematic use of participants’ cognitive resources, as observed in previous studies (Quiroga et al., Reference Quiroga, Román, Catalán, Rodríguez, Ruiz, Herranz and Colom2011; Rabbitt et al., Reference Rabbitt, Banerji and Szymanski1989). Moreover, the medium-high and negative correlation between g scores and invested time to complete the game indicates that intelligence predicts the time required for completing the video game.
On the other hand, Difficulty and Discrimination indices have been used to select the best puzzles. Puzzles with both indices higher than .40 were selected and forty-one puzzles (34% of those included in the video game) passed the criterion. The resulting test showed a high reliability (.94).
Finally, exploratory factor analysis results suggested that video games and paper and pencil can be described either as measures of the same intelligence factor (all factor loadings > .50), or as two correlated intelligence factors (r = .48).
STUDY 2
Method
Participants
Participants were recruited from the Faculty of Psychology at the UCM, through flyers advertising to participate in a video game study. 45 people applied to participate but 27 had free time to complete the whole experiment (21 women and 6 men). Mean age was 20.56 (SD = 2.72, range 18–28). Participants from this study were older than those of the first study (d = –.43). Selected participants had no previous experience with the video game “Professor Layton and the Curious village”®, but many were familiarized with the Nintendo DS and the Layton series video games. Nowadays it is almost impossible to find young adults without video consoles experience. The sample in this study does not differ from the sample in the first study regarding sex, but they are slightly older and with more experience playing video games.
All participants signed an informed consent form and accepted to avoid playing at home during the 6 weeks required for completing the experiment. To reward participation, upon study completion, participants took part in a raffle of 9 video games as the one they had played.
Procedure
Exactly the same as in study one.
Materials
The same ability tests were administered, but only odd items because of time restrictions. Nevertheless, reliability coefficients showed acceptable values: AR = .71; VR = .80 and SR = .88.
Results
Table 6 includes descriptive statistics for ability measures, computed IQs and video game outcomes. Except for the high kurtosis shown by DAT-SR and number of Solved Puzzles, the remaining variables show proper distributions (standard asymmetry and kurtosis values < 2.0). The leptokurtic distributions for DAT-SR and number of Solved Puzzles indicate that more than expected participants grouped around mean values. Ability scores were factor analyzed (principal axis factoring, PAF) to obtain a g score for each participant that was transformed into the IQ scale.
Descriptive statistics for abilities tests and video game outcomes (N = 20)

Note: 1these variables only refer to the first 7 hours of playing.
Table 7 shows descriptive statistics per hour for video games outcomes and the number of participants having completed the game hourly. In this second study participants required less time for completing the game than in the first study.
Descriptive Statistics

Note: Sample size decreases from the 7th hour, due to participants that had already completed the video game.
Figure 2 includes the correlations between IQ scores and video game performance (puzzles found and puzzles solved). The pattern of correlations shows an increasing value from the first hour to the 7th, for both found and solved puzzles. The difference between correlation values is statistically significant only for solved puzzles (Z found puzz. = 1.43 > Z c = 1.96; Z solved puzz. = 2.77> Z c = 1.96) from hour 1 (r g-found puzz. = .388; r g-solved puzz. = .308) to hour 7 (r g-found puzz. = .514; r g-solved puzz. = .564). After the 7th hour, correlations decrease probably due to the sample size reduction caused by the fact that some participants have completed the video game. The correlation between IQ scores and invested time to complete the video game was –.539 (p < .01). Participants with high and low IQ scores (over 100 and bellow or equal 100) clearly differed in the time required for completing the video game (M High IQ = 9.36, SD = 1.62; M Low IQ= 11.80, SD = 1.74; F(1, 45) = 13.113, p = .001; d = –1. 45). High IQ scorers required, on average, two hours less to complete the game. Importantly, the 95% Confidence Interval showed no overlap between groups (High IQ: 8.27 to 10.46; Low IQ: 10.84 to 12.76).
Correlations between g scores and video game performance through practice.

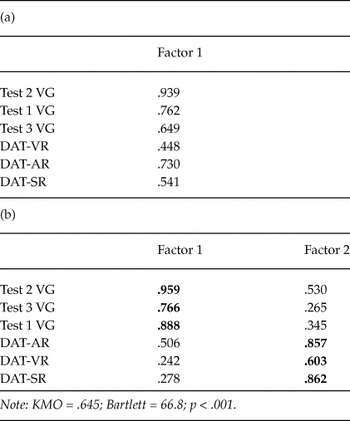
For each participant, scores from the puzzles test, as well as from the three equivalent versions constructed in the first study, were computed. Two Exploratory Factor Analyses (EFA), were run. Oblimin rotation was used for the two factors’ solution. Table 8 includes both factor solutions. Explained common variance for the one factor solution was 48.51%. Explained common variance for the two factors solution was 69.97% (51.65 % for the first factor and 18.32 for the second); the correlation between the two factors was r = .41.
Factor solutions for one and two factors with the ability and video game tests (Second Study)

Discussion
Results observed in this second study replicate the findings of the first study. Therefore, seven years after the first study, and with a different group of participants more familiarized with video games, the same results were obtained: (a) video game performance shows an increasing correlation with IQ through practice; (b) intelligence predicts the amount of time required for completing the video game; in this second study individuals with higher IQ scores required, on average, two hour less to complete the video game; (c) video games and paper and pencil can be described either as measures of the same intelligence factor (factor loadings > .45) or as two intelligence correlated factors (r = .41).
Comparison between studies
Participants from both studies were compared on the abilities measured and on the video game outcomes. 6 univariate ANOVAs were run. Table 9 summarizes the results. Group variances did not differ, except for the total points obtained in the video game. However, both groups obtained a similar average number of points. Groups differ in the number of puzzles found per hour (d = –.43) and in the number of puzzles solved per hour (d = –.82). In both instances, participants from the second study found and solved more puzzles. This suggests higher speed in the participants from the second study as a result of their previous experience with Layton series video games.
IQ and video game outcomes per Study

Note: 1these variables only refer to the first 7 hours of playing. *p < .05; ***p < .001.
Table 10 includes the correlations between IQ, ability measures, the three parallel tests made with the video game and the whole test. These correlations were computed for 56 participants (36 from study 1 and 20 from study 2). The magnitude of these correlations (.50 < r xy >.35) is similar to most of the convergent validity coefficients found for ability and intelligence tests (Pearson TalentLens, 2007).
Correlations between intelligence and ability measures, and tests constructed with the video game

Note: *p < .05; **p < .01.
General Discussion
Video games performance and intelligence assessment with a leisure video game
The first conclusion derived from the reported studies is this: Video game performance, measured either with Found Puzzles or Solved Puzzles, shows an increased correlation with intelligence through practice, showing that the selected video game requires the systematic use of participants’ cognitive resources, as observed by Rabbitt et al. (Reference Rabbitt, Banerji and Szymanski1989) and Quiroga et al. (Reference Quiroga, Román, Catalán, Rodríguez, Ruiz, Herranz and Colom2011).
Second, time invested for completing the video game correlates with intelligence differences in both studies (–.52 and –.54). Specifically, we have shown that high intelligence participants complete the game from one to two hours before than low intelligence participants (d = –.92 and d = –1.45). This converges with Ackerman’s (Reference Ackerman, Ackerman, Sernberg and Glaser1988) studies showing that time to learn a new task shows inverse correlations with intelligence.
Third, the most discriminative 41 puzzles’ test, along with the three equivalent versions created, showed satisfactory reliability (α = .937, α = .823, α = .806 and α = .840, respectively), compared with the usual range of accepted values (Tavakol & Dennick, Reference Tavakol and Dennick2011; from .70 to .95).
Fourth, EFA analyses showed that the one or two factor solutions account for a medium to high percentage of shared common variance. The one factor solution underscores that the constructed video game tests could be good measures of a g factor (loadings from .82 to .88 in the first study, and from .65 to .94 in the second study). The two-factor solution shows that the latent factor measured with the video game tests is correlated with the g factor in both studies (.48 and .41). These values depart from those reported by Quiroga et al. (Reference Quiroga, Escorial, Román, Morillo, Jarabo, Privado and Colom2015) for brain games, but are close to those obtained from Baniqued et al. (Reference Baniqued, Lee, Voss, Basak, Cosman, DeSouza and Kramer2013) for casual games.
Fifth, participants from both studies were similar in their IQ scores as well as in the obtained outcomes for the video game (found puzzles, solved puzzles and points) but they clearly differed in the efficiency measures computed for video game performance: found puzzles per hour and solved puzzles per hour (d = –.43 and d = –.82). Participants from the second study are more efficient, finding and solving almost 30% more puzzles per hour. This result was surprising; nothing from the participants’ characteristics led us to expect this huge difference in the speed for completing the task. This might be a consequence of having played video games since childhood. Indeed, for the first study (run in 2009) it was easy to find naïve participants, but it was impossible for the second study (run in 2015). Actually, Boot (Reference Boot2015) underscored the need of more precise measures about video game playing experience, including the history of game play across their lifetime. Results reported here support his demand.
Sixth, for the whole sample (participants from both studies that completed the 41 puzzles, N = 56) the correlations between IQ, ability measures and video games tests are in the medium range (.46 < r xy > .30) showing proper convergence. Note that previous studies correlating video games performance and ability measures obtained similar correlations values: (1) McPherson and Burns (Reference McPherson and Burns2008) using two specifically designed games to measure processing speed and working memory (Space Code and Space Matrix) obtained correlations ranging from .21 to .54 between games performance and tests’ scores (Digit Symbol, Visual Matching, Decision Speed, Picture Swaps and a short form of the Advanced Progressive Matrices); (2) Shute, Ventura, and Ke (Reference Shute, Ventura and Ke2015) used the commercial video game Portal 2 and obtained correlations ranging from .27 to .38 between video game performance and tests’ scores (Verbal Insight Test, Mental Rotation Test, Spatial Orientation Test and Visual Spatial Navigation Assessment); (3) Baniqued et al. (Reference Baniqued, Lee, Voss, Basak, Cosman, DeSouza and Kramer2013) used 20 casual games to obtain 5 components that correlated with the 5 latent factors obtained from 14 intelligence and ability tests; the obtained correlations ranged from .18 to .65. In this latter study, all game components correlated highly with the fluid intelligence latent factor (from .27 for visuo-motor speed games to .65 for the working memory games); and (4) Buford and O’Leary (Reference Buford and O’Leary2015) using the Puzzle creator from Portal 2 developed a video game test that correlates .46 with the Raven Standard Progressive Matrices.
In summary, here we have shown that intelligence can be assessed with existing commercial video games. Also, these video games’ tests converge with ability tests and IQ scores at the same level than ability tests do among themselves. However, an important question remains to be answered: is it feasible to use commercial video games for testing intelligence or abilities? Currently, our answer is negative because: (1) available video games are less efficient given that they require a lot of time for obtaining the same reliability and validity coefficients obtained with paper and pencil tests; (2) researchers lack control regarding stimuli and dependent variables; (3) outcomes are not saved in any type of data set, requiring inefficient data registration, and only small samples can be considered.
However, in exceptional cases, commercial video games could provide adequate estimations of cognitive abilities. For example, for applicants to high-level jobs (managers, etc.) completing a video game with no time limits is a novel and unexpected situation that can provide good estimations and valuable information about the ability to solve problems across an extended period of time.
What about the influence of previous experience playing video games? Could the assessment of intelligence be biased if video games are used? In this regard, Foroughi, Serraino, Parasuraman, and Boehm-Davis (Reference Foroughi, Serraino, Parasuraman and Boehm-Davis2016) have shown that when the video games measure Gf, previous experience does not matter, so having applicants familiar or unfamiliar with video games in general wouldn’t be a problem for the assessment of those groups.
We finish this report providing answers to the next crucial question: is there any future for video games as tools for assessing intelligence?
Future research on intelligence measured with video games
Thirty years ago, concluding remarks from Hunt and Pellegrino (Reference Hunt and Pellegrino1985) about the use of computerized tests in the next future distinguished economic and psychological reasons. Economic considerations underlie the use of computerized tests if the main reasons for their use are easy administration (psychologists are free to observe participants’ behavior because the computer saves performance), or greater accuracy (saving not only response, but also response time and type of response, from which to compute the derived scores needed). These economic reasons explain why thirty years later from this forecast we still lack a generalized use of computerized assessments of the intelligence factor. It has been very expensive to develop computerized tests even when their practical advantages have been recognized. However, commercial video games are beginning to include “mods” (abbreviation for modifications) for free allowing researchers to design his tests, as Buford and O’Leary (Reference Buford and O’Leary2015) or Foroughi et al. (Reference Foroughi, Serraino, Parasuraman and Boehm-Davis2016) have done with Portal 2 to test fluid intelligence. Nevertheless, even being free it is not easy to master the mod; multidisciplinary group are strongly needed.
Psychological issues arise when the new tool is intended to provide a better measure of intelligence than paper and pencil tests (Hunt & Pellegrino, Reference Hunt and Pellegrino1985). Could video games be better measures of intelligence and abilities? Recent reviews (Boot, Reference Boot2015; Landers, Reference Landers2015) suggest that testing with video games is more motivating, because they include an engaging narrative and usually consider new challenges or elements as players complete levels in the game. Engaging narratives are good because players solving problems or puzzles want to know more about the story. In other words, the narrative has to include key aspects for the game; otherwise, players will play the game without reading the story (as an example Cradle of Empires®, from Awem Studio®, includes a narrative not very engaging that allow players to avoid reading the story). Another important feature of recent video games is that motivation is managed through the essentials of the psychology of learning (Candy Crush®, now property of Activision Blizzard®, is an excellent example of how to use this discipline for designing a very addictive video game, see for example Hopson, Reference Hopson2001; Margalit, Reference Margalit2015).
Using video games for testing intelligence and cognition could also reduce test anxiety in those cases where assessment is perceived as a threatening situation. However, we think the most important point is that a video game can include the rules and components Primi (Reference Primi2014) has designed to create an assessment tool criterion-reference based, to overcome the question of arbitrary metrics on the normative based test scores (Abad, Quiroga, & Colom, Reference Abad, Quiroga and Colom2016). Thus, the next step for measuring intelligence is to develop tests that include an objective scale metric relying on cognitive complexity and essential processes underlying intelligence. Video Games could be the tool for fulfilling this goal. As noted by Primi (Reference Primi2014) “the scale proposed that the levels of fluid intelligence range from the ability to solve problems containing a limited number of bits of information with obvious relationships through the ability to solve problems that involve abstract relationships under conditions that are confounded with an information overload and distraction by mixed noise” (p. 775).
This goal can be certainly accomplished in the next future with video games, but available commercial video games are far from these two points, even new generation video games such as Portal 2® (Valve Corporation, 2011) or Witness® (Tekla Inc., 2016; http://the-witness.net/news/). Witness®, a 3D puzzle video game just released on January 2016, includes neither instructions nor time limits. The player has to deduce what to do to complete the game, it is a continuous visuo-spatial reasoning test, but the player has to explore and solve all the difficulty levels to complete the game. Thus, it is not an adaptive test and this point should be compulsory for the new tools. The same is true for Portal 2®. We need adaptive video games including mods for psychologists to develop their own tests. Also, it is crucial for video games to provide accuracy and speed scores, because this will allow computing efficiency measures. Recently, we have reviewed more than 40 games looking for ones saving both criteria, accuracy and speed, and it has been difficult to find more than 5. The most common situation is to have a game providing separate accuracy and speed scores. Even worst, a mixture expressed as “obtained points”, probably computed with an algorithm that remains unknown for users.
To conclude, video games might be the basis for the next generation of assessment tools for intelligence and abilities. They are T data in terms of Cattell’s (Reference Cattell1979) classification, and, therefore, are objective, and can be completed even without the supervision of a psychologist. Remote assessments are possible. Games are engaging, motivating and attractive, because people like to play. But they must be also psychometrically as sound as classic tests. In this sense, video games research requires validity studies (Landers, Reference Landers2015; Landers & Bauer, Reference Landers, Bauer, Lankowski and Bjork2015). This issue is still on its infancy but progress is made. Psychologists have to develop their own video games and contribute to the design of commercial video games.
Video games for assessment should include (1) an engaging story from which many levels could be derived, with and without distraction; (2) items of different complexity implemented in an adaptive way for testing each participant with the small number of items required to better discriminate his abilities profile; these items should differ in the number and difficulty of the rules needed to solve them; (3) measures of accuracy and speed from which efficiency measures could be derived; accuracy and speed must be automatically saved for each assessed intelligence process; (4) hierarchical levels of the essential processes that underlie intelligence (working memory and processing speed) that match the different developmental levels; (5) video games must be designed for avoiding automation through practice (psychomotor abilities should not be essential for video game outcomes) and (6) no time limit for the whole video game, but speed modules.
Finally, research studies on existing video games must follow the gold standard for psychological research as recently summarized by R. N. Landers addressing video games’ programmers: “Rigorous experimental designs, large sample sizes, a multifaceted approach to validation, and in-depth statistical analyses should be the standard, not the exception” (Landers, Reference Landers2015; p. iv).